. 2020 Apr 7;11(2):e03394-19.
doi: 10.1128/mBio.03394-19.

A Virus Hosted in Malaria-Infected Blood Protects against T Cell-Mediated Inflammatory Diseases by Impairing DC Function in a Type I IFN-Dependent Manner

Affiliations

A Virus Hosted in Malaria-Infected Blood Protects against T Cell-Mediated Inflammatory Diseases by Impairing DC Function in a Type I IFN-Dependent Manner

Ali Hassan et al. mBio. .

Abstract

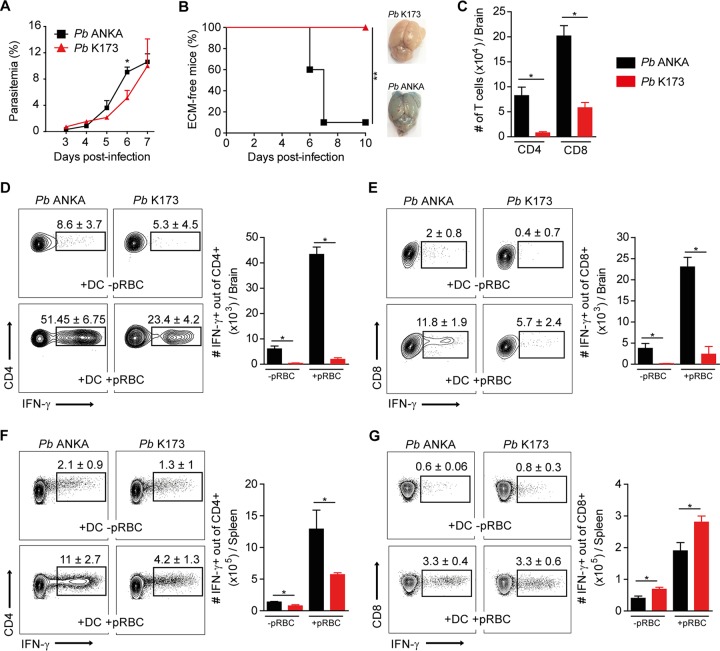
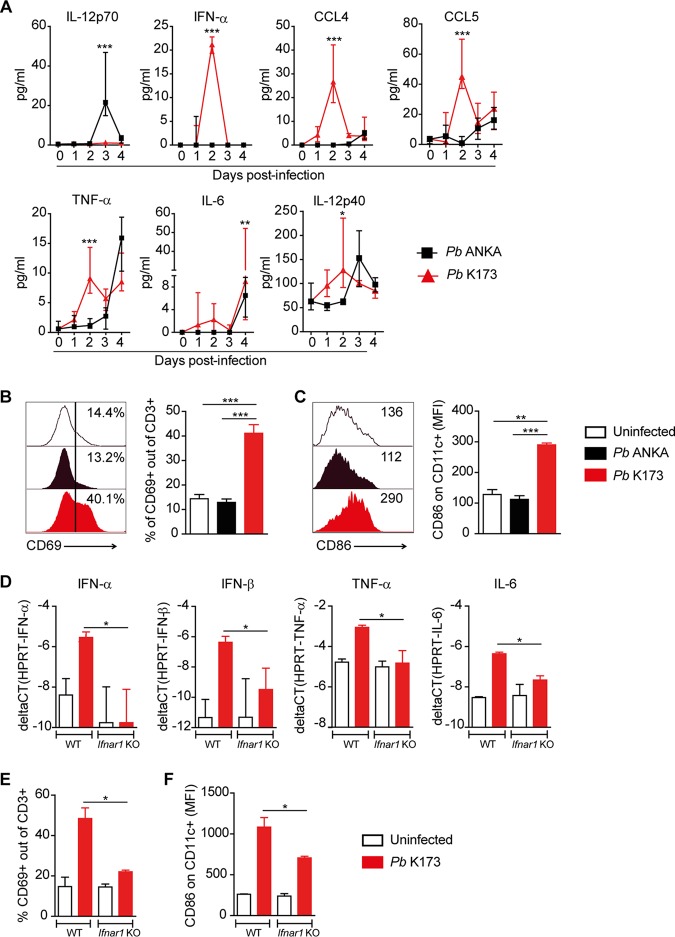
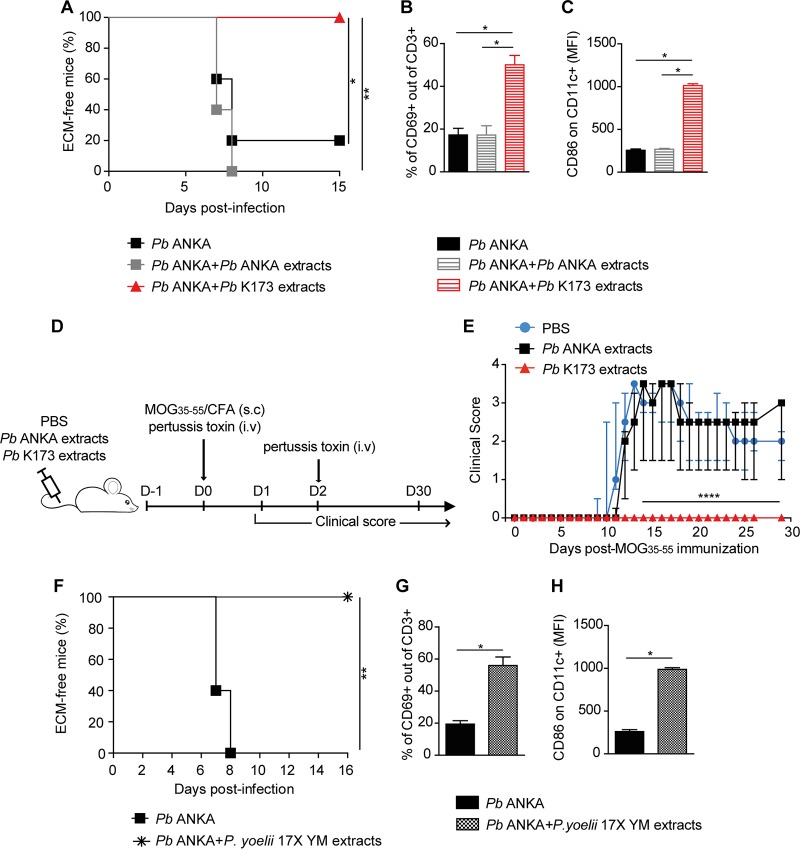
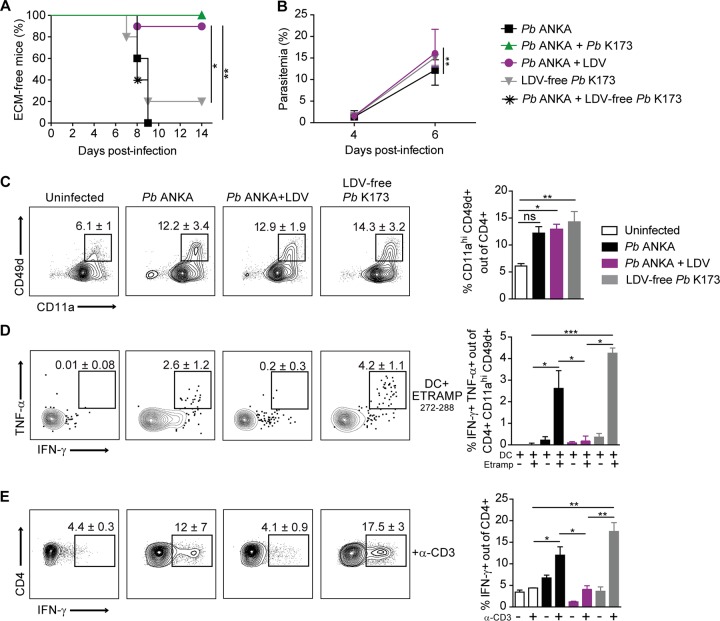
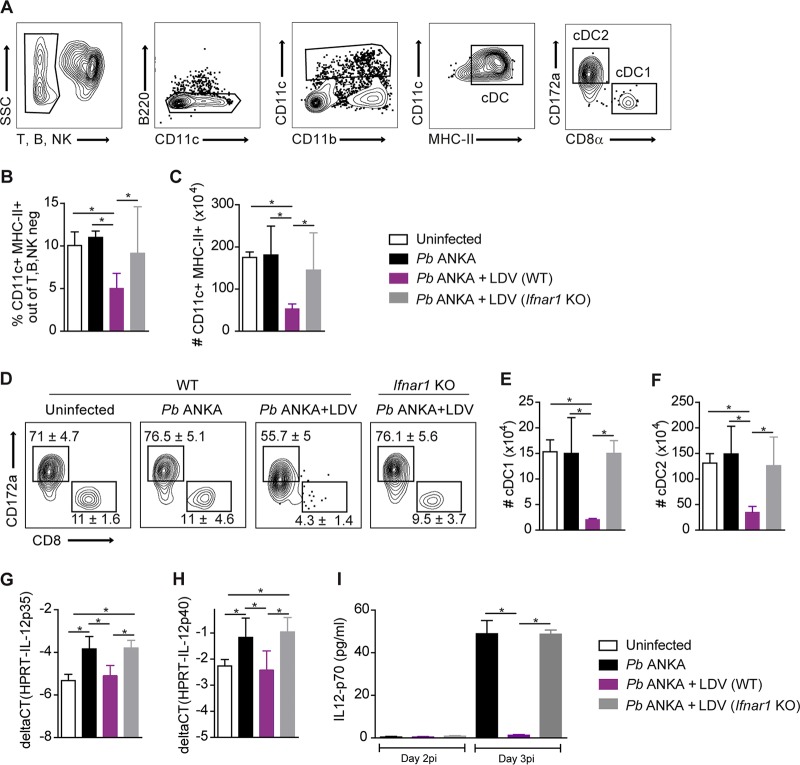
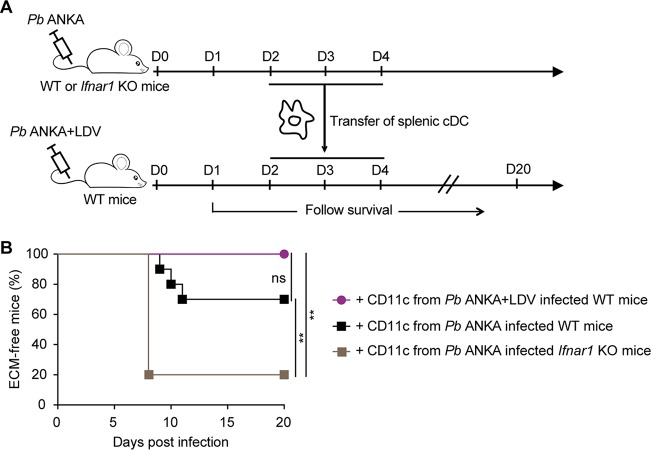
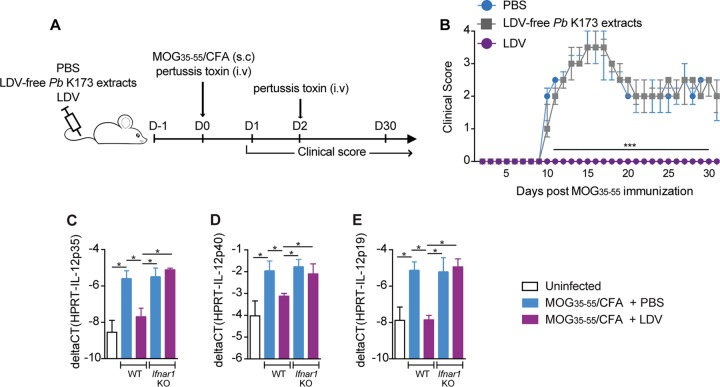
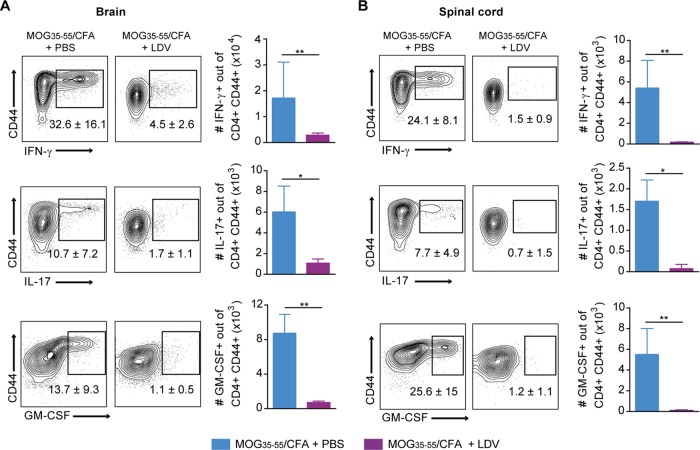
Coinfections shape immunity and influence the development of inflammatory diseases, resulting in detrimental or beneficial outcome. Coinfections with concurrent Plasmodium species can alter malaria clinical evolution, and malaria infection itself can modulate autoimmune reactions. Yet, the underlying mechanisms remain ill defined. Here, we demonstrate that the protective effects of some rodent malaria strains on T cell-mediated inflammatory pathologies are due to an RNA virus cohosted in malaria-parasitized blood. We show that live and extracts of blood parasitized by Plasmodium berghei K173 or Plasmodium yoelii 17X YM, protect against P. berghei ANKA-induced experimental cerebral malaria (ECM) and myelin oligodendrocyte glycoprotein (MOG)/complete Freund's adjuvant (CFA)-induced experimental autoimmune encephalomyelitis (EAE), and that protection is associated with a strong type I interferon (IFN-I) signature. We detected the presence of the RNA virus lactate dehydrogenase-elevating virus (LDV) in the protective Plasmodium stabilates and we established that LDV infection alone was necessary and sufficient to recapitulate the protective effects on ECM and EAE. In ECM, protection resulted from an IFN-I-mediated reduction in the abundance of splenic conventional dendritic cell and impairment of their ability to produce interleukin (IL)-12p70, leading to a decrease in pathogenic CD4+ Th1 responses. In EAE, LDV infection induced IFN-I-mediated abrogation of IL-23, thereby preventing the differentiation of granulocyte-macrophage colony-stimulating factor (GM-CSF)-producing encephalitogenic CD4+ T cells. Our work identifies a virus cohosted in several Plasmodium stabilates across the community and deciphers its major consequences on the host immune system. More generally, our data emphasize the importance of considering contemporaneous infections for the understanding of malaria-associated and autoimmune diseases.IMPORTANCE Any infection modifies the host immune status, potentially ameliorating or aggravating the pathophysiology of a simultaneous inflammatory condition. In the course of investigating how malaria infection modulates the severity of contemporaneous inflammatory diseases, we identified a nonpathogenic mouse virus in stabilates of two widely used rodent parasite lines: Plasmodium berghei K173 and Plasmodium yoelii 17X YM. We established that the protective effects of these Plasmodium lines on cerebral malaria and multiple sclerosis are exclusively due to this virus. The virus induces a massive type I interferon (IFN-I) response and causes quantitative and qualitative defects in the ability of dendritic cells to promote pathogenic T cell responses. Beyond revealing a possible confounding factor in rodent malaria models, our work uncovers some bases by which a seemingly innocuous viral (co)infection profoundly changes the immunopathophysiology of inflammatory diseases.

Keywords: CD4 T cell; RNA virus; autoimmunity; coinfection; dendritic cells; inflammation; malaria.


Figures

FIG 1
FIG 1
Reduced Th1 responses and absence of ECM pathology following P. berghei K173 infection. C57BL/6 mice infected i.v. by injection of 106 P. berghei ANKA (Pb ANKA) or P. berghei K173 (Pb K173) pRBC. Blood circulating parasitemia (A) and ECM development (B) monitored following infection. Brain edema was visualized by Evans blue coloration. (C) Total numbers of CD4+ or CD8+ T cells collected from brain at day 6 after infection. Cells collected from brain (D and E) and spleen (F and G) at day 6 after infection were restimulated in vitro with MutuDC preloaded or not with pRBC. IFN-γ production by CD4+ T cells (D and F) or CD8+ T cells (E and G) detected by intracellular staining. Percentages on the representative dot plots show the median percentages of IFN-γ+ cells of total CD4+ or CD8+ T cells ± IQRs. Bar graphs show the medians ± IQRs of absolute numbers. Data are representative of 2 independent experiments. N = 5 mice per group.
FIG 2
FIG 2
P. berghei K173 but not P. berghei ANKA induces an early systemic type I IFN response. (A) Serum cytokines measured by Luminex assay at different time points after P. berghei (Pb) ANKA or P. berghei K173 infection. Proportions of CD69+ of CD3+ T cells (B) and geometric mean fluorescence intensities of CD86 expressed by CD11c+ cells (C) in the spleen at day 2 after infection. Bars show the medians ± IQRs. WT and Ifnar1 KO mice were infected with P. berghei K173 and analyzed at day 2 postinfection. (D) Cytokine gene expression in whole spleen analyzed by real-time qPCR. Proportions of CD69+ of CD3+ T cells (E) and geometric mean fluorescence intensities of CD86 on CD11c+ cells (F) in the spleen. Bars show the medians ± IQRs. (A, D, E, and F) Data from 1 experiment with 5 to 7 mice/group. (B and C) Data representative of 4 independent experiments with N = 4 mice/group.
FIG 3
FIG 3
Plasmodium-parasitized blood protects against ECM and EAE independently from live parasites. (A) ECM development following infection with 106 P. berghei (Pb) ANKA pRBC administered with or without sonicated extracts of P. berghei ANKA or P. berghei K173. (B, C) Proportions of CD69+ out of CD3+ T cells (B) and geometric mean fluorescence intensities of CD86 on CD11c+ cells (C) in the spleen at day 2 postinfection. Bars show the medians ± IQRs. (D) Experimental protocol. C57BL/6 mice were injected with P. berghei ANKA or P. berghei K173 pRBC sonicated extracts and immunized with MOG35–55/CFA to induce EAE. (E) Clinical scores monitored up day 30 postimmunization. Dots show the medians ± IQRs. (F) ECM development following infection with 106 P. berghei ANKA pRBC administered with or without sonicated extracts of 106 P. yoelii 17X YM pRBC. (G, H) Proportions of CD69+ out of CD3+ T cells (G) and geometric mean fluorescence intensities of CD86 on CD11c+ cells (H) in the spleen at day 2 postinfection. Bars show the medians ± IQRs. (A, B, and C) Data representative of 3 independent experiments with N = 5 mice/group. (E) Data representative of 2 experiments. N = 6 mice/group. (F, G, and H) Data from 2 experiments with N = 5 mice per group.
FIG 4
FIG 4
LDV alone, but not LDV-free P. berghei K173, impedes Th1 responses and prevents ECM development. ECM development (A) and blood circulating parasitemia (B) after infection or coinfection of C57BL/6 mice with the indicated inocula: P. berghei (Pb) ANKA pRBC, P. berghei ANKA plus P. berghei K173 pRBC, P. berghei ANKA pRBC plus LDV, LDV-free P. berghei K173 pRBC, P. berghei ANKA pRBC plus LDV-free P. berghei K173 pRBC. (C) Proportions of activated CD11a+ CD49d+ of spleen CD4+ T cells collected 6 days after infection. Cytokine production by spleen CD4+ T cells restimulated in vitro with MutuDC loaded with ETRAMP272–288 peptide (D) or with anti-CD3 (E). (D) Proportions of double IFN-γ+ TNF-α+ cells of activated CD4+ T cells upon ETRAMP272–288 restimulation. (E) Proportions of IFN-γ+ cells out of activated CD4+ T cells upon anti-CD3 restimulation. Numbers on the dot plots and bar graphs show median percentages ± IQRs. Data are representative of 2 independent experiments with N = 5 mice/group.
FIG 5
FIG 5
LDV causes an IFNAR-dependent decrease in number and IL-12p70 production of splenic conventional DC. C57BL/6 WT and Ifnar1 KO mice were infected i.v. with 106 P. berghei (Pb) ANKA pRBC or 106 P. berghei ANKA pRBC plus LDV. (A) Gating strategy used for cDC analysis 2 days after infection. Proportions of CD11c+ MHC II+ cDC of non-T, non-B, non-NK cells (B) and absolute numbers of cDC (C). (D) Representative dot plots showing the median percentages ± IQRs of cDC1 and cDC2 subsets. Absolute numbers of splenic cDC1 (E) and cDC2 (F). Real-time qPCR analysis of IL-12p35 (G) and IL-12p40 (H) gene expression by sorted CD11c+ cDC at day 2 after infection. (I) Plasmatic level of IL-12p70 measured by ELISA at day 2 and 3 after infection. (A to H) Data representative of 4 independent experiments with N = 5 mice/group. (I) Data representative of 2 independent experiments with N= 5 mice/group.
FIG 6
FIG 6
cDC from P. berghei ANKA-infected Ifnar1 KO mice restore ECM upon transfer into P. berghei ANKA/LDV-coinfected mice. (A) Experimental protocol. WT or Ifnar1 KO donor mice were i.v. infected with 106 P. berghei (Pb) ANKA pRBC, with or without LDV. At days 2, 3, and 4 of infection, CD11c+ DC were magnetically sorted from spleen and transferred into P. berghei ANKA plus LDV coinfected WT mice. (B) ECM development. Data pooled from 2 independent experiments with N = 10 mice receiving WT DC and N = 5 mice receiving Ifnar1 KO DC.
FIG 7
FIG 7
LDV alone, but not LDV-free P. berghei K173, prevents EAE development. (A) Experimental protocol. C57BL/6 mice were injected with PBS, LDV-free P. berghei (Pb) K173 pRBC sonicated extracts or LDV-containing plasma, and immunized with MOG35–55/CFA to induce EAE. (B) Clinical scores up to day 30 postimmunization. Dots show the medians ± IQRs. Real-time qPCR analysis of IL-12p35 (C), IL-12p40 (D), and IL-12p19 (E) gene expression on CD11c+ DC magnetically sorted from dLN of C57BL/6 WT or Ifnar1 KO mice, injected with PBS or infected with LDV 1 day prior to MOG35–55/CFA immunization. Analysis at day 1 postimmunization. (B) Data representative of 3 independent experiments with N = 5 mice/group. (C to E) Data representative of 2 independent experiments with N = 5 mice/group.
FIG 8
FIG 8
LDV alone protects against EAE by blocking the encephalitogenic CD4+ T cell response. C57BL/6 mice were injected with PBS or LDV 1 day before MOG35–55/CFA immunization. Mononuclear cells from CNS and spinal cord harvested 15 days after MOG35–55/CFA immunization were restimulated with 100 μg MOG peptide for 24 h. Production of IFN-γ, IL-17, and GM-CSF visualized by intracellular staining in CD4+ T cells from brain (A) and spinal cord (B). Numbers on the representative dot plots show the median percentages of cytokine-positive cells of CD44+ CD4+ T cells ± IQRs. Histograms show the absolute numbers. Data representative of 2 independent experiments with N = 7 mice/group.

References

    1. Bach JF. 2018. The hygiene hypothesis in autoimmunity: the role of pathogens and commensals. Nat Rev Immunol 18:105–120. doi:10.1038/nri.2017.111. - DOI - PubMed
    1. Filyk HA, Osborne LC. 2016. The multibiome: the intestinal ecosystem’s influence on immune homeostasis, health, and disease. EBioMedicine 13:46–54. doi:10.1016/j.ebiom.2016.10.007. - DOI - PMC - PubMed
    1. Nogueira AR, Shoenfeld Y. 2019. Microbiome and autoimmune diseases: cause and effect relationship. Curr Opin Rheumatol 31:471–474. doi:10.1097/BOR.0000000000000628. - DOI - PubMed
    1. Tselis A. 2011. Evidence for viral etiology of multiple sclerosis. Semin Neurol 31:307–316. doi:10.1055/s-0031-1287656. - DOI - PubMed
    1. Correale J, Gaitan MI. 2015. Multiple sclerosis and environmental factors: the role of vitamin D, parasites, and Epstein-Barr virus infection. Acta Neurol Scand 132:46–55. doi:10.1111/ane.12431. - DOI - PubMed

Publication types

MeSH terms