. 2020 Apr 7;11(1):1723.
doi: 10.1038/s41467-020-15283-z.

Quantitative proteomic landscape of metaplastic breast carcinoma pathological subtypes and their relationship to triple-negative tumors

Affiliations

Quantitative proteomic landscape of metaplastic breast carcinoma pathological subtypes and their relationship to triple-negative tumors

Sabra I Djomehri et al. Nat Commun. .

Abstract

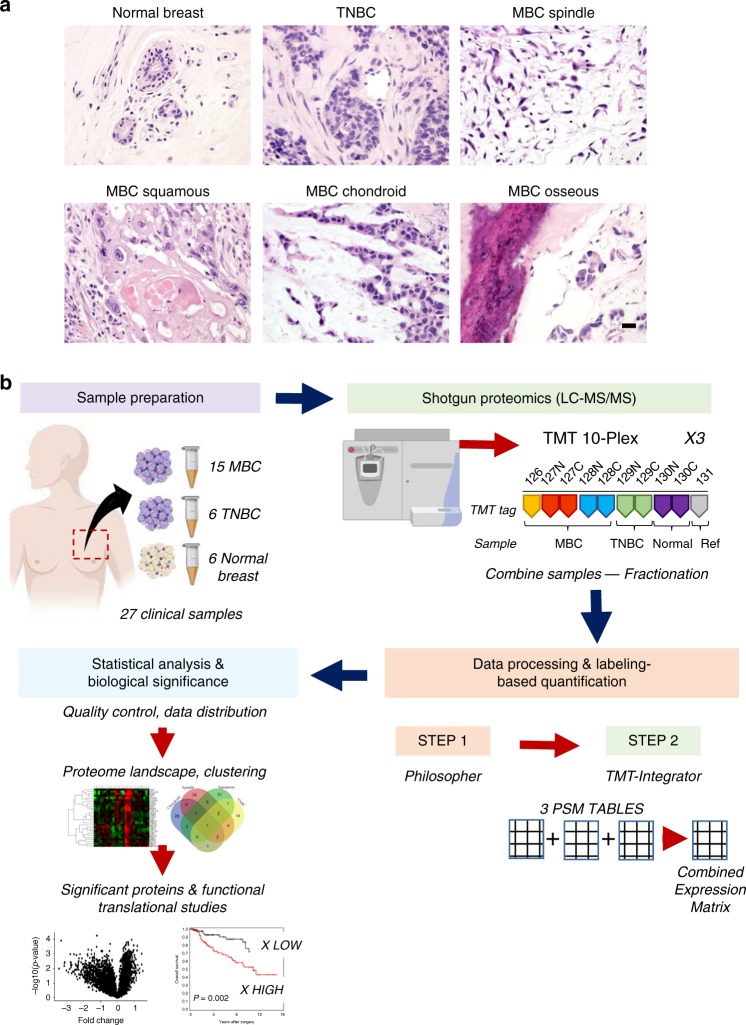
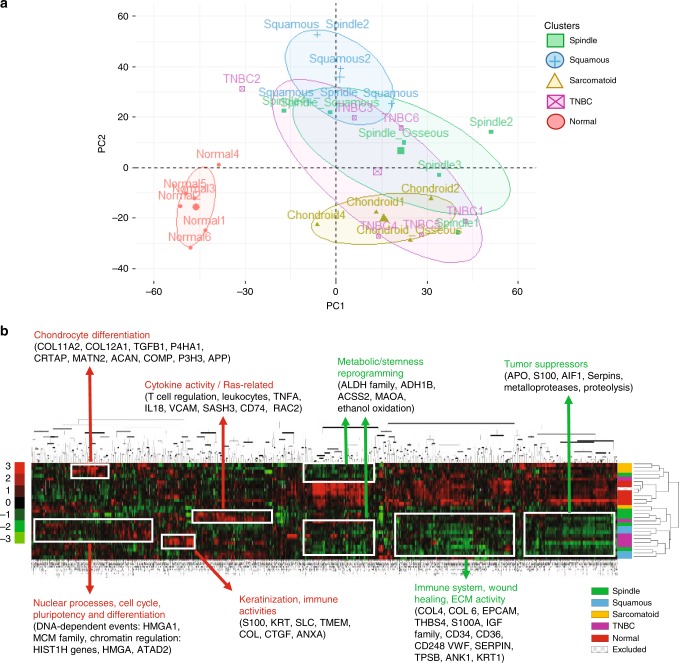
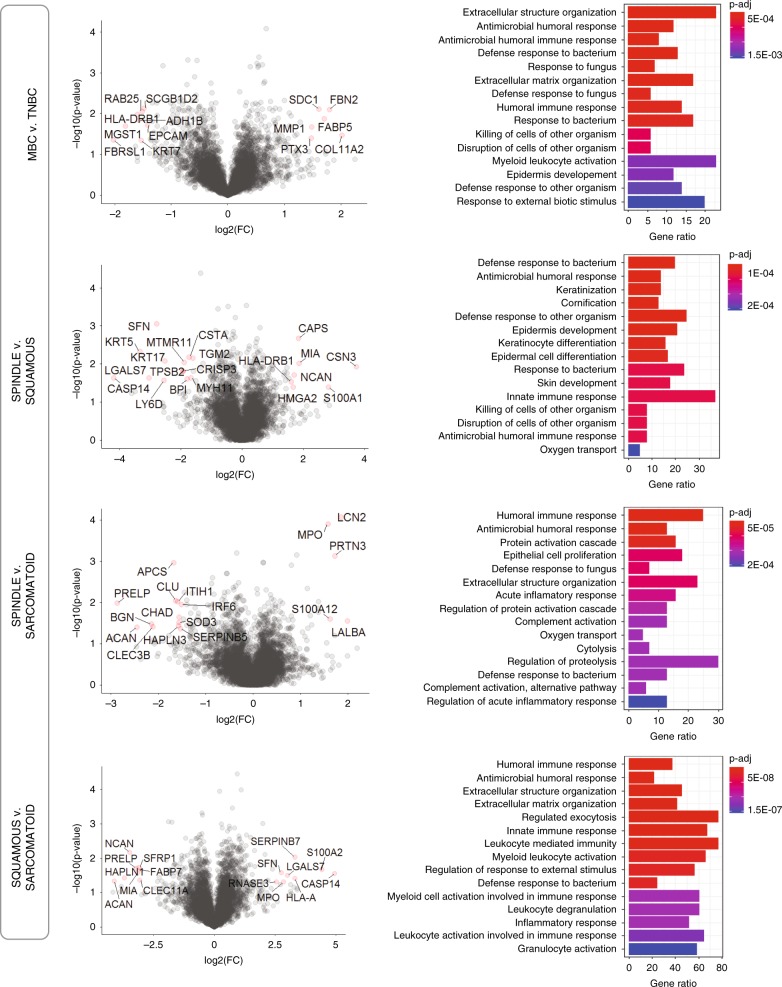
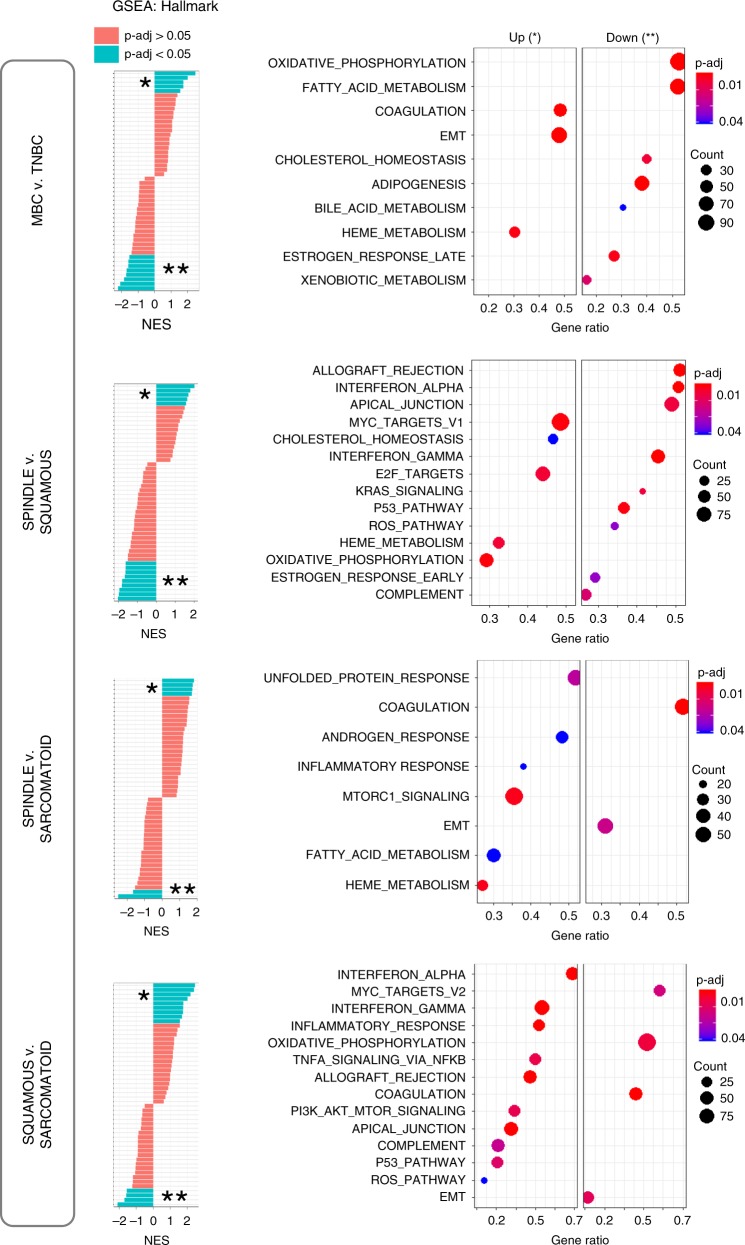
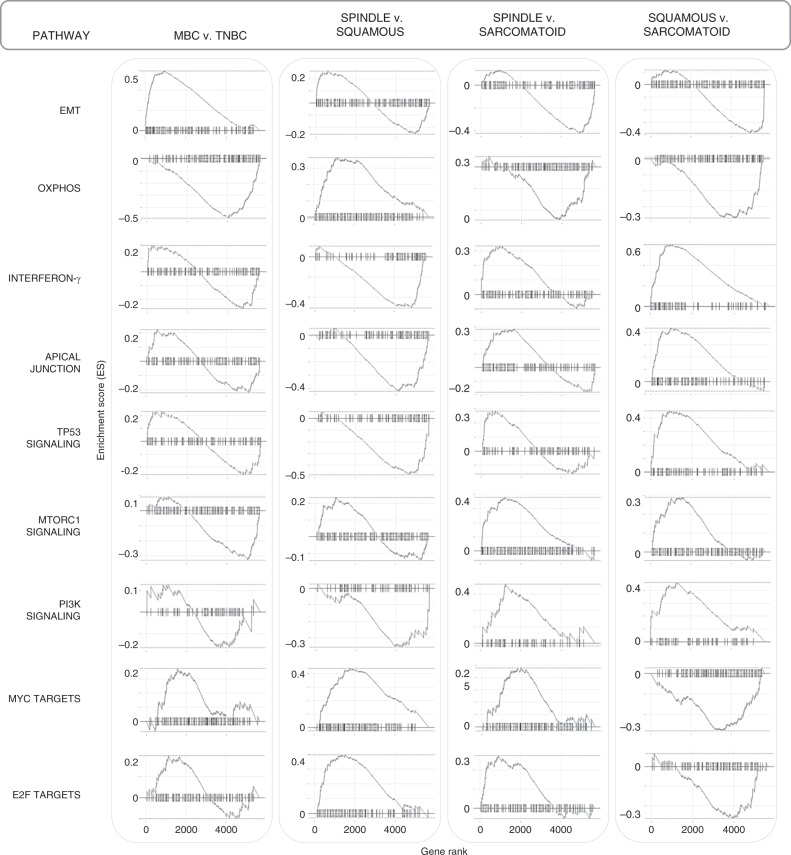
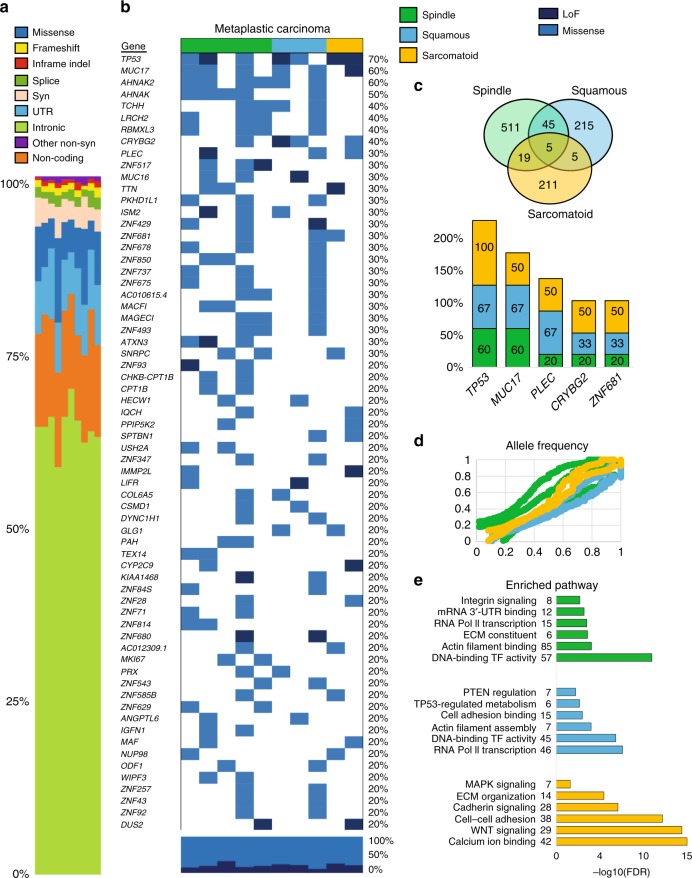
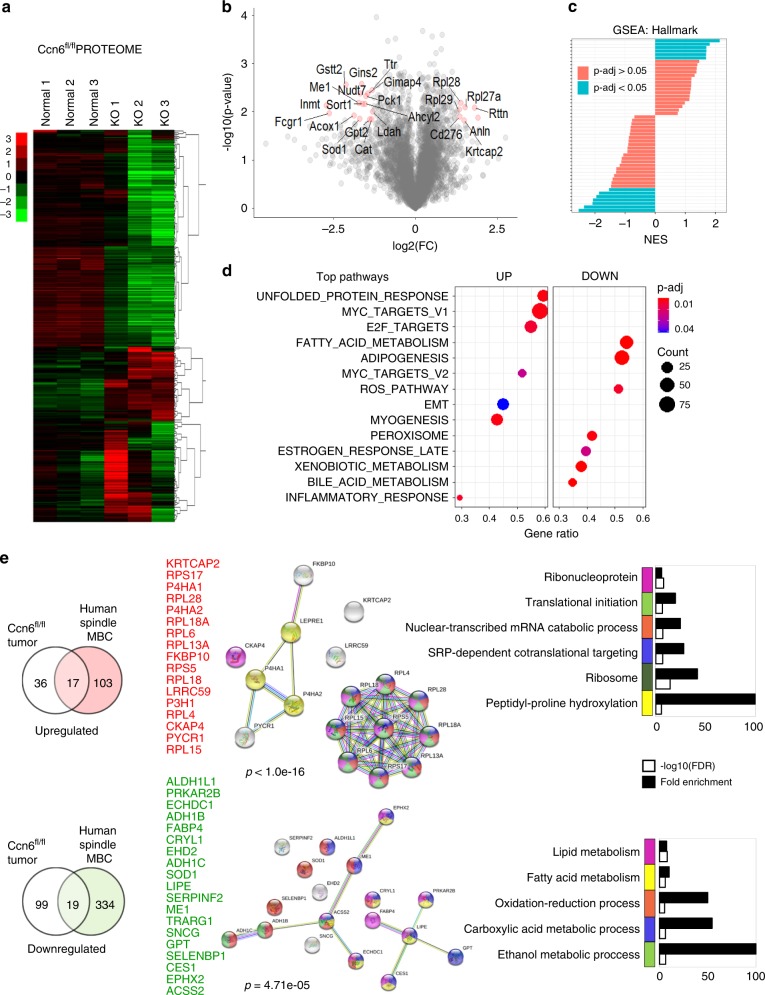
Metaplastic breast carcinoma (MBC) is a highly aggressive form of triple-negative cancer (TNBC), defined by the presence of metaplastic components of spindle, squamous, or sarcomatoid histology. The protein profiles underpinning the pathological subtypes and metastatic behavior of MBC are unknown. Using multiplex quantitative tandem mass tag-based proteomics we quantify 5798 proteins in MBC, TNBC, and normal breast from 27 patients. Comparing MBC and TNBC protein profiles we show MBC-specific increases related to epithelial-to-mesenchymal transition and extracellular matrix, and reduced metabolic pathways. MBC subtypes exhibit distinct upregulated profiles, including translation and ribosomal events in spindle, inflammation- and apical junction-related proteins in squamous, and extracellular matrix proteins in sarcomatoid subtypes. Comparison of the proteomes of human spindle MBC with mouse spindle (CCN6 knockout) MBC tumors reveals a shared spindle-specific signature of 17 upregulated proteins involved in translation and 19 downregulated proteins with roles in cell metabolism. These data identify potential subtype specific MBC biomarkers and therapeutic targets.


Conflict of interest statement

The authors declare no competing interests.

Figures

Fig. 1
Fig. 1. Human clinical samples and quantitative proteomics workflow.
a Representative images of hematoxylin and eosin stained tissues from our patient cohort, including 15 metaplastic carcinomas (MBC, 6 spindle, 4 squamous, and 4 sarcomatoid), 6 triple-negative (TNBC), and 6 normal breast. Scale bar = 50 μm. b Workflow of quantitative mass spectrometry profiling (cartoons created with BioRender.com). For data acquisition we assembled the 27 samples into 3 experimental groups for 10-plex LC-MS/MS tandem mass tag (TMT) isobaric labeling. For data processing and quantification, we used two computational pipelines, Philosopher/TMT-Integrator, and generated a combined protein expression matrix for the 3 experiments used for downstream analyses, including hierarchical clustering, differential expression tests, statistical analysis, and biological inference.
Fig. 2
Fig. 2. Quantitative proteomics of MBC, TNBC, and normal breast tissues.
a Principal component analysis (PCA) plot shows unsupervised clustering among the 27 samples, demonstrating a clear distinction between normal and all tumors (MBC subtypes and TNBC) and between MBC squamous and sarcomatoid, while there is an overlap between MBC subtypes and TNBC. b Heat map of the 5670 proteins that passed through quality filters in TMT-Integrator across all patients. Significantly enriched downregulated (green) and upregulated (red) GO biological processes (p < 0.05). Dendogram from hierarchical clustering analysis in Cluster 3.0 using median centering, uncentered correlation, and complete linkage, and visualized in Java TreeView 1.1.6r4. Scale bar shows expression level (color-coded as red for upregulated, green for downregulated, and black for unchanged.
Fig. 3
Fig. 3. Differential expression analysis of histological MBC subtypes.
Left: Volcano plots comparing MBC with TNBC and within MBC subtypes, as indicated. Significantly differentially expressed proteins are highlighted in red. log2-Fold change versus –log10(p-value), where cutoff values on plots show FC > 1 or FC < −1 (vertical lines) and p < 0.01 (horizontal line), n = 20 patients. Right: Enrichment analysis using gene ontology (GO) annotations showing the top GO terms based on biological process, molecular function, or cellular compartment. Significant proteins were considered using p-value < 0.05, q-value < 0.1, fold change (log2-FC) >1, Benjamini–Hochberg correction (BH), gene set size 5–500, and the total protein list (5670 proteins) as the background set. Barplot shows significant terms by the gradient legend as p-adjust < 0.001, the x-axis is gene ratio and the number of proteins belonging to given enriched terms.
Fig. 4
Fig. 4. GSEA reveals hallmark pathways within MBC and relative to TNBC.
GSEA analyses show differentially expressed protein pathways in MBC compared with TNBC, and within MBC subtypes. Left: normalized enrichment scores (NES) versus the total list of GSEA hallmark upregulated (*) and downregulated (**) categories, with significantly enriched terms (p-adjust < 0.05) among non-enriched (p-adjust > 0.05). Right: only the top hallmark up- and downregulated pathways labeled as UP (*) and DOWN (**), highlighting unique significantly expressed categories, where the x-axis is gene ratio. The GSEA analysis was performed using the clusterProfiler and fgsea package in R for the hallmark collection (H) (Broad Institute), with n = 1000 permutations, where p-adjust < 0.05 and FDR < 0.05 were considered significant.
Fig. 5
Fig. 5. Top enriched pathway profiles distinguish MBC subtypes and TNBC.
GSEA enrichment plots of the highest up- or downregulated pathways by carcinoma type, including epithelial-mesenchymal transition (EMT), oxidative phosphorylation, interferon-γ, apical junction, TP53, MTORC1, and PI3K signaling, and MYC and E2F target pathways. The GSEA analysis was performed using the fgsea package in R for the hallmark collection (H) (Broad Institute), with n = 1000 permutations, where p-adjust < 0.05 and FDR < 0.05 were considered significant.
Fig. 6
Fig. 6. WES analysis shows repertoire of somatic mutations within MBC.
a The landscape of somatic mutations common to MBC and within subtype-specific histopathologies of 10 patients with MBC including spindle (N = 5), squamous (N = 3) and sarcomatoid (N = 2) and matching normal breast tissues. The type of mutation is color-coded as indicated in the legend. Pathogenic mutational variants in MBC were defined as those of high complexity (980 of 11,652 total) were filtered in this analysis. Syn: synonymous, INDEL: inframe insertions and deletions. b Heat map shows the top mutated genes with 20% of greater frequency of missense (blue) or loss-of-function mutations, LoF (dark blue). c Venn diagram highlights the number common and distinct mutated genes in MBC subtypes. Bars show the frequency of the five commonly mutated genes (TP53, MUC17, PLEC, CRYBG2, ZNF681) in each subtype. d Scatterplot is average allele frequency (AF) for each tumor sample, and colors represent metaplastic subtype. We excluded the variants with population allele frequency >5% based on 1000 Genome Project data. e Top enriched GO and pathways (KEGG, Panther, or Reactome) of mutated genes in MBC subtypes. Enrichment analysis was performed using gene lists extracted for each MBC according to the gene-level variant and effect summary analysis using GeneRollupv0.3.2. Variants that fell in low complexity genomic regions, genomic super DUPS, and repeat masker regions were excluded.
Fig. 7
Fig. 7. Quantitative proteomics analysis of mouse MBC (MMTV-cre;Ccn6fl/fl).
a Heat map of the 4609 proteins that passed through quality filters in TMT-Integrator for all samples (3 MMTV-cre;Ccn6fl/fl mouse tumors (KO) and 3 normal mouse mammary glands). Scale bar shows expression level (red is upregulated and green is downregulated). b Volcano plot comparing Ccn6fl/fl tumors with normal mammary gland. Significantly differentially expressed proteins are highlighted in red. p < 0.05 and absolute value FC > 1 were considered significant. c Gene set enrichment analysis (GSEA) showing significant differentially expressed protein pathways in Ccn6fl/fl spindle MBCs compared with normal mammary glands. Normalized enrichment scores (NES) versus the total list of GSEA hallmark categories of up and downregulated hallmark pathways. d Top hallmark pathways highlighting significantly expressed up- and downregulated protein pathways (marked UP and DOWN, respectively). We used the molecular Signatures Database (MSigDB v7.0), hallmark gene sets with clusterProfiler and fgsea packages in R, with the biomaRT package in R to convert mouse gene IDs to human homolog associated gene symbols. e Venn diagrams demonstrate the overlap between the proteome of mouse MBC and human spindle MBC tumors, relative to their normal tissue counterparts, identifying a 17-protein upregulated and 19-protein downregulated protein set. Protein–protein interaction networks of up- and downregulated signatures highlight potential markers of interest, along with functional enrichment analysis using STRING v11.0. Color scheme of network proteins are matched by the legend of GO enrichment terms in barplots.

References

    1. Montagna E, et al. Heterogeneity of triple-negative breast cancer: histologic subtyping to inform the outcome. Clin. Breast Cancer. 2013;13:31–39. doi: 10.1016/j.clbc.2012.09.002. - DOI - PubMed
    1. Huvos AG, Lucas JC, Foote FWJ. Metaplastic breast carcinoma. Rare form of mammary cancer. N. Y State J. Med. 1973;73:1078–1082. - PubMed
    1. Oberman HA. Metaplastic carcinoma of the breast. A clinicopathologic study of 29 patients. Am. J. Surg. Pathol. 1987;11:918–929. doi: 10.1097/00000478-198712000-00002. - DOI - PubMed
    1. Cimino-Mathews A, et al. A clinicopathologic analysis of 45 patients with metaplastic breast carcinoma. Am. J. Clin. Pathol. 2016;145:365–372. doi: 10.1093/ajcp/aqv097. - DOI - PubMed
    1. Salemis NS. Metaplastic carcinoma of the breast with mesenchymal differentiation (carcinosarcoma). A unique presentation of an aggressive malignancy and literature review. Breast Dis. 2018;37:169–175. doi: 10.3233/BD-170313. - DOI - PubMed

Publication types

MeSH terms