. 2020 Apr 7;10(1):6007.
doi: 10.1038/s41598-020-62898-9.

Short Acquisition Time Super-Resolution Ultrasound Microvessel Imaging via Microbubble Separation

Affiliations

Short Acquisition Time Super-Resolution Ultrasound Microvessel Imaging via Microbubble Separation

Chengwu Huang et al. Sci Rep. .

Abstract

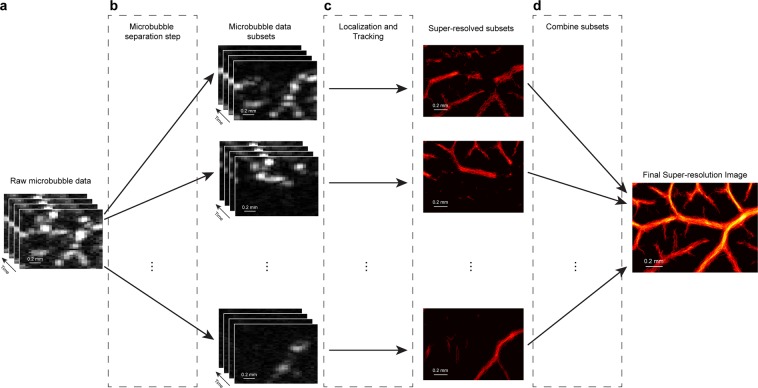
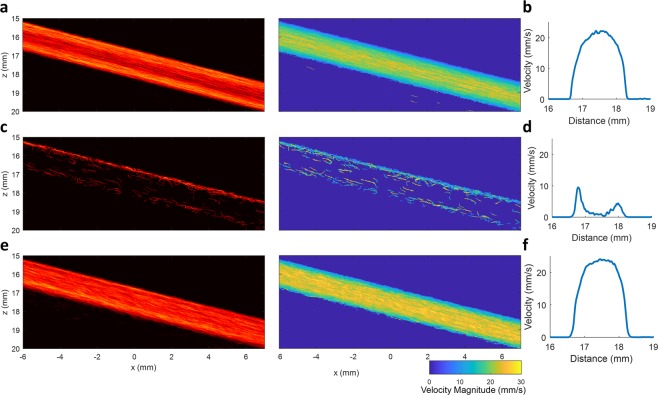
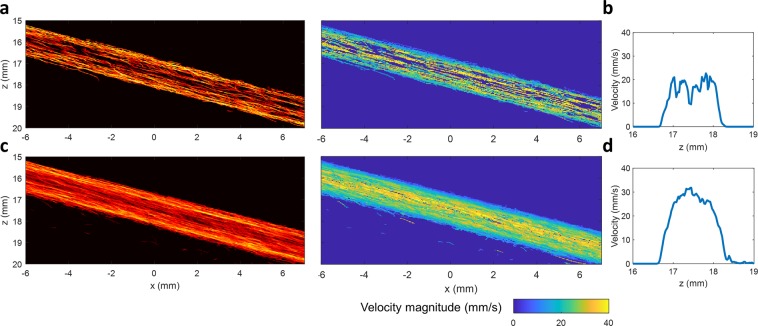
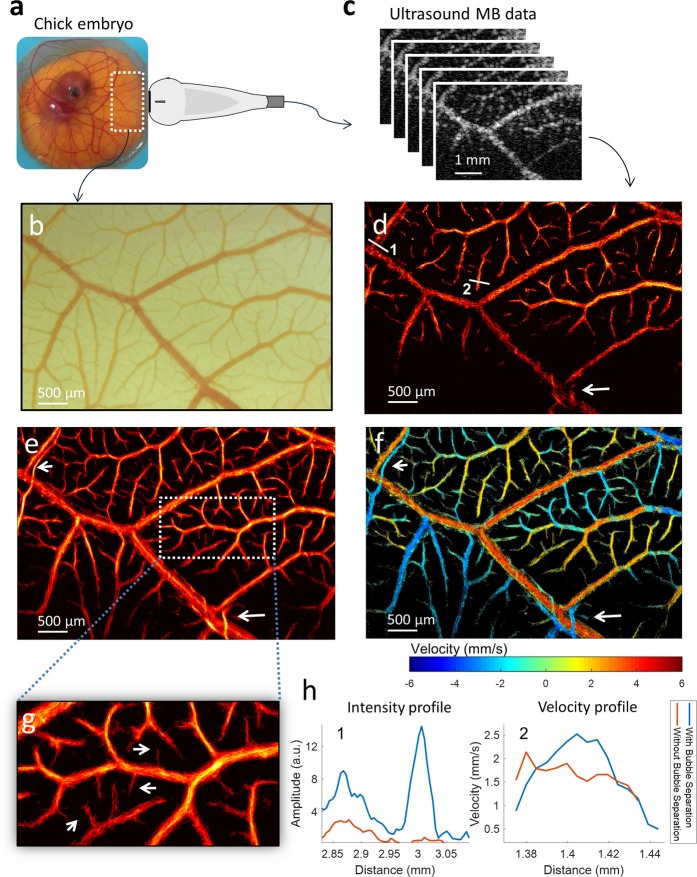
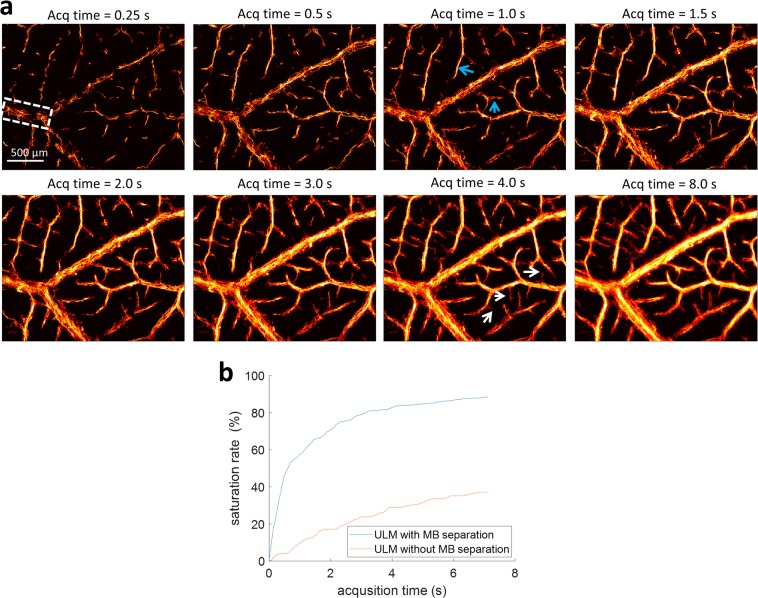
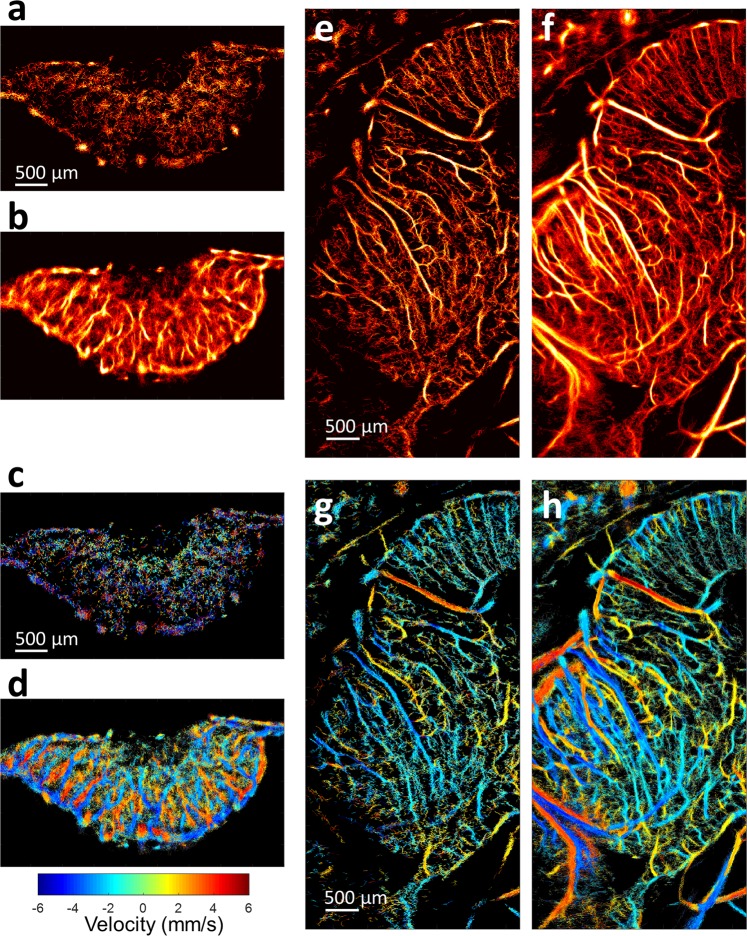
Super-resolution ultrasound localization microscopy (ULM), based on localization and tracking of individual microbubbles (MBs), offers unprecedented microvascular imaging resolution at clinically relevant penetration depths. However, ULM is currently limited by the requirement of dilute MB concentrations to ensure spatially sparse MB events for accurate localization and tracking. The corresponding long imaging acquisition times (tens of seconds or several minutes) to accumulate sufficient isolated MB events for full reconstruction of microvasculature preclude the clinical translation of the technique. To break this fundamental tradeoff between acquisition time and MB concentration, in this paper we propose to separate spatially overlapping MB events into sub-populations, each with sparser MB concentration, based on spatiotemporal differences in the flow dynamics (flow speeds and directions). MB localization and tracking are performed for each sub-population separately, permitting more robust ULM imaging of high-concentration MB injections. The superiority of the proposed MB separation technique over conventional ULM processing is demonstrated in flow channel phantom data, and in the chorioallantoic membrane of chicken embryos with optical imaging as an in vivo reference standard. Substantial improvement of ULM is further demonstrated on a chicken embryo tumor xenograft model and a chicken brain, showing both morphological and functional microvasculature details at super-resolution within a short acquisition time (several seconds). The proposed technique allows more robust MB localization and tracking at relatively high MB concentrations, alleviating the need for dilute MB injections, and thereby shortening the acquisition time of ULM imaging and showing great potential for clinical translation.


Conflict of interest statement

The authors declare no competing interests.

Figures

Figure 1
Figure 1
Principle of microbubble separation based super-resolution imaging. (a) The original spatiotemporal microbubble data after tissue clutter filtering. (b) A 3D Fourier transform separates microbubble subpopulations on the basis of their speed and flow direction, resulting in datasets with sparser microbubble concentration. (c) Each data-subset undergoes independent microbubble localization and tracking. (d) The final super-resolution ULM image is generated by combining signals from all of the subset data.
Figure 2
Figure 2
Flow channel phantom validates the proposed method. (a) Reference ULM intensity and velocity images of the flow channel phantom that were generated by combining eight individually processed ULM images from separate acquisitions at a low microbubble concentration (a total of four different flow speeds and two different flow directions). (b) The combined ULM flow channel image demonstrated a well-defined parabolic flow profile. (c) Conventional ULM image processing performed on a high microbubble concentration dataset did not result in an adequate number of high-confidence microbubble events to populate the vessel lumen and (d) did not produce a meaningful flow profile. (e) Performing microbubble separation on the high microbubble concentration dataset allowed for accurate reconstruction and filling of the vessel lumen and (f) could recover a parabolic flow profile.
Figure 3
Figure 3
ULM images obtained from one individual flow channel data. (a) ULM intensity and velocity images of the flow channel obtained without MB separation. (b) The flow speed profile obtained without MB separation. (c) ULM intensity and velocity images of the same flow channel data obtained with MB separation method. (d) Well-developed parabolic flow speed profile obtained with the MB separation method. For one individual flow channel data, different flow velocities inherently exist along the radial direction. A stack of 2000 frames was used to produce the ULM image for this figure. The proposed method provided a higher number of localized MBs, permitting a denser population of the lumen of the flow channel.
Figure 4
Figure 4
Chicken embryo CAM imaging with microscopic imaging validation. (a) An ex ovo chicken embryo imaged with a high-frequency transducer through an acoustic window in the side of container. (b) Co-registered optical imaging of the ultrasound field-of-view. (c) Ultrasound MB data was used to generate ULM super-resolution images. (d) Conventional ULM image reconstruction without microbubble separation. Lines 1 and 2 denote two manually selected vessel cross-sections of interest. (e) ULM intensity image with microbubble separation method. (f) ULM velocity map generated with microbubble separation. The arrows highlight adjacent vessels with opposing flow directions. (g) Magnified section of CAM with arrows pointing out microvasculature that was not detected by conventional ULM. (h) Intensity and velocity profiles of CAM vessels from manually selected line segments.
Figure 5
Figure 5
Influence of data acquisition time. (a) Super-resolved microbubble localization images of the CAM surface vasculature with incrementally increasing data acquisition lengths (accumulation time). Most of the microvessels, down to the ~10 µm diameter range, could be resolved within ~4 seconds using the MB separation technique. (b) The saturation rate of the vessel region indicated by the rectangle in Fig. 5a demonstrates that the vessel lumen was mostly populated within the first 2–3 seconds and plateaued beyond 4 s for the MB separation method, while for conventional ULM the saturation curve shows that the time to reach the plateau was much longer (>8 s).
Figure 6
Figure 6
Application of proposed method to chicken embryo tumor and brain. ULM images were generated for CAM tumor both (a) without microbubble separation and (b) with microbubble separation. The corresponding images depict ULM velocity maps (c) without microbubble separation and (d) with microbubble separation. Likewise, ULM images of chicken embryo brains were generated (e) without microbubble separation and (f) with microbubble separation. As with the tumor data, the velocity maps (g) without microbubble separation were less populated than the velocity maps (h) with microbubble separation.

References

    1. Betzig E, et al. Imaging intracellular fluorescent proteins at nanometer resolution. Science. 2006;313:1642–1645. doi: 10.1126/science.1127344. - DOI - PubMed
    1. Rust MJ, Bates M, Zhuang X. Sub-diffraction-limit imaging by stochastic optical reconstruction microscopy (STORM) Nat. Methods. 2006;3:793–795. doi: 10.1038/nmeth929. - DOI - PMC - PubMed
    1. Errico C, et al. Ultrafast ultrasound localization microscopy for deep super-resolution vascular imaging. Nature. 2015;527:499–502. doi: 10.1038/nature16066. - DOI - PubMed
    1. Opacic T, et al. Motion model ultrasound localization microscopy for preclinical and clinical multiparametric tumor characterization. Nat Commun. 2018;9:1527. doi: 10.1038/s41467-018-03973-8. - DOI - PMC - PubMed
    1. Couture O, Hingot V, Heiles B, Muleki-Seya P, Tanter M. Ultrasound Localization Microscopy and Super-Resolution: A State of the Art. IEEE Trans Ultrason Ferroelectr Freq Control. 2018;65:1304–1320. doi: 10.1109/TUFFC.2018.2850811. - DOI - PubMed

Publication types