. 2020 Apr 7;3(1):170.
doi: 10.1038/s42003-020-0889-1.

Trehalose metabolism confers developmental robustness and stability in Drosophila by regulating glucose homeostasis

Affiliations

Trehalose metabolism confers developmental robustness and stability in Drosophila by regulating glucose homeostasis

Ryota Matsushita et al. Commun Biol. .

Abstract

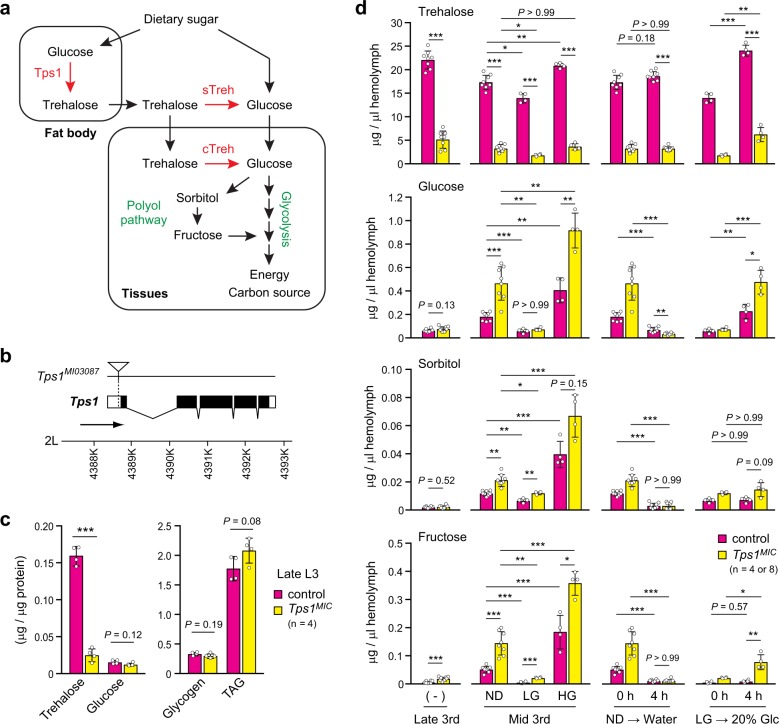
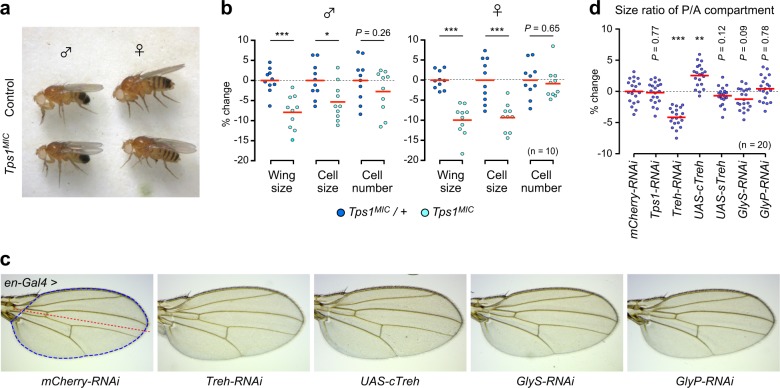
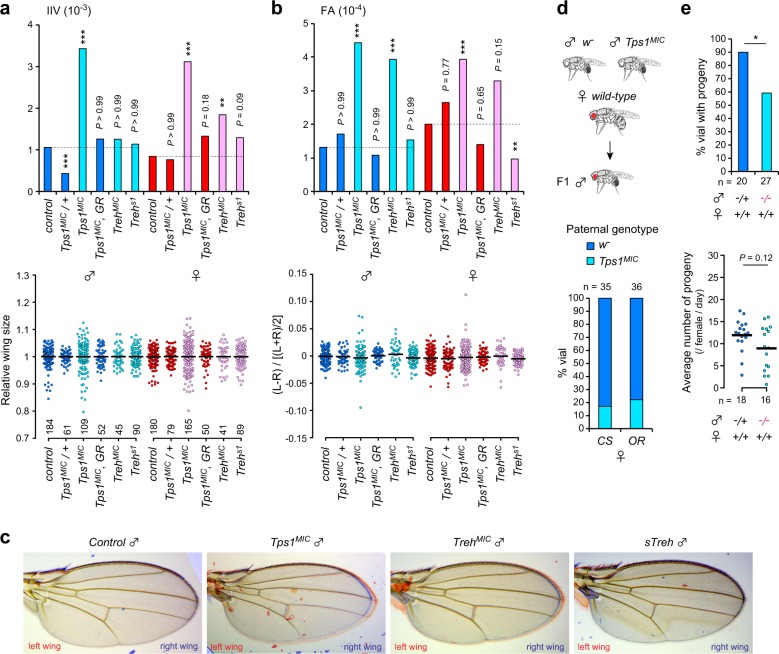
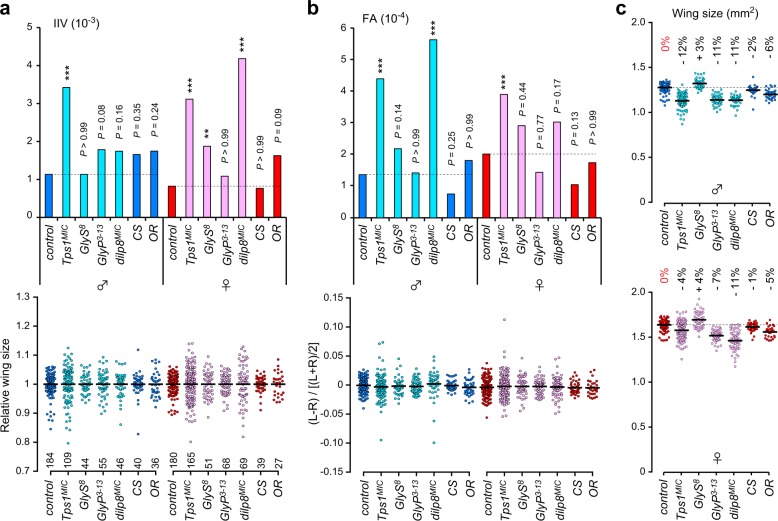
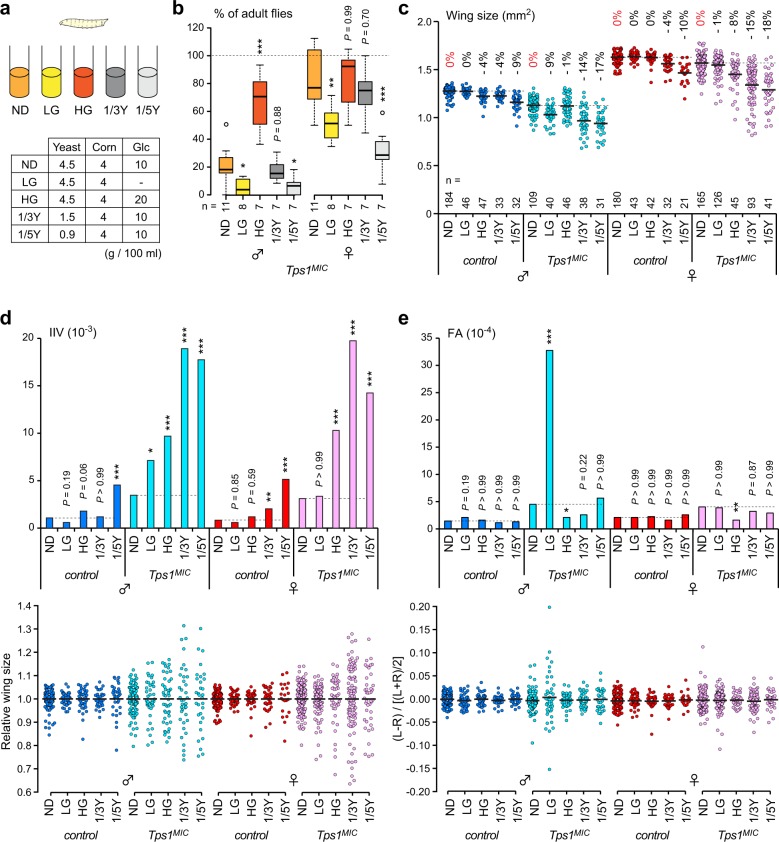
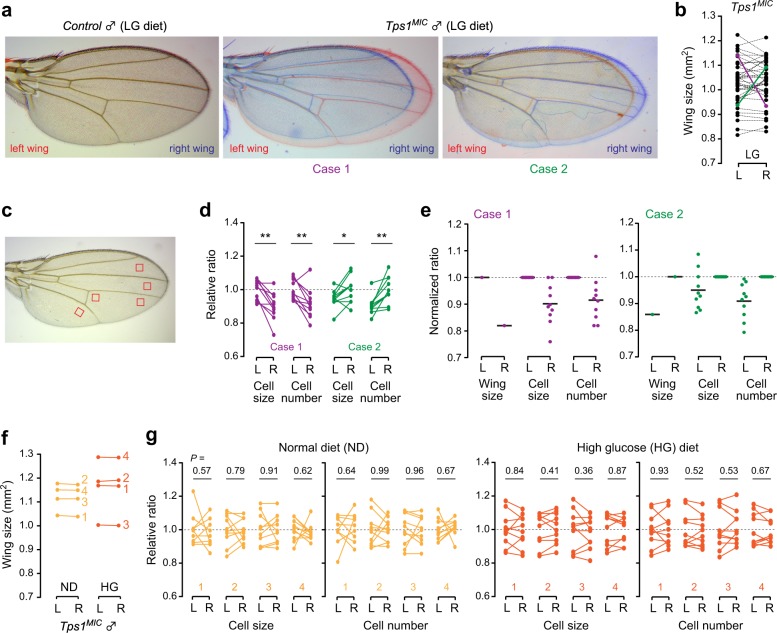
Organisms have evolved molecular mechanisms to ensure consistent and invariant phenotypes in the face of environmental fluctuations. Developmental homeostasis is determined by two factors: robustness, which buffers against environmental variations; and developmental stability, which buffers against intrinsic random variations. However, our understanding of these noise-buffering mechanisms remains incomplete. Here, we showed that appropriate glycemic control confers developmental homeostasis in the fruit fly Drosophila. We found that circulating glucose levels are buffered by trehalose metabolism, which acts as a glucose sink in circulation. Furthermore, mutations in trehalose synthesis enzyme (Tps1) increased the among-individual and within-individual variations in wing size. Whereas wild-type flies were largely resistant to changes in dietary carbohydrate and protein levels, Tps1 mutants experienced significant disruptions in developmental homeostasis in response to dietary stress. These results demonstrate that glucose homeostasis against dietary stress is crucial for developmental homeostasis.


Conflict of interest statement

The authors declare no competing interests.

Figures

Fig. 1
Fig. 1. Trehalose metabolism functions in glucose homeostasis.
a Overview of trehalose and glucose metabolism. Proteins that function in trehalose metabolism are shown in red. b Schematic representation of the Tps1 locus. Protein-coding regions and untranslated regions are represented by black boxes and white boxes, respectively. The Minos insertion site is marked with an inverted triangle. c Amounts of trehalose, glucose, glycogen, and TAG in Tps1MIC mutants at the wandering stage. d Circulating sugar levels under various dietary conditions. ND, normal diet; LG, low-glucose diet; HG, high-glucose diet; Glc, glucose. Composition of diets is shown in Fig. 5a. *p < 0.05, **p < 0.01, ***p < 0.001; unpaired two-tailed Student’s t-test (c), unpaired two-tailed Student’s t-test with Bonferroni correction (d). Results are presented as the mean ± SD. The numbers indicate the number of biological replicates.
Fig. 2
Fig. 2. Trehalose catabolism cell-autonomously regulates organ growth.
a Tps1MIC mutant adults are morphologically normal. b Fold changes in wing size, cell size, and cell number are shown relative to heterozygous mutants. c Representative images of adult wing. en-Gal4 was used to drive UAS transgenes in the posterior region of the wing. The red line indicates the boundary between the posterior and anterior compartments. The blue encircled region was measured to obtain the wing size. d The size ratio between the posterior/anterior (P/A) compartment areas in the adult wing. Fold changes are shown relative to control (en-Gal4 > mCherry-RNAi). *p < 0.05, **p < 0.01, ***p < 0.001; unpaired two-tailed Student’s t-test (b), one-way ANOVA with Dunnett’s post hoc test (d). The numbers of flies analyzed are indicated.
Fig. 3
Fig. 3. Defects in trehalose metabolism reduce developmental homeostasis and fitness.
a, b Inter-individual variation (IIV) (a) and fluctuating asymmetry (FA) (b) in wing size for each genotype and for each sex. The upper graphs indicate the variance of wing sizes (a) and size-corrected FA (b). The lower dot plots indicate the distributions of relative wing sizes normalized against the average size among individuals (a) and the distribution of wing size variations within each individual (b). L, left-wing size; R, right-wing size. GR indicates Tps1 genomic rescue construct. c Merged images of left (red) and right (blue) wings from control, Tps1, and Treh mutant males. d Tps1MIC mutant males show lower reproductive success rates compared with control males, as revealed by a mating competition assay. Paternal genotypes were checked in F1 males that derived from a female crossed with two males. CS, Canton S; OR, Oregon R. e Percentage of vials with progenies and the average number of progenies. More than half of the Tps1MIC mutant males are fertile and produce a normal number of progenies. −/−, Tps1MIC mutants; +/+, control w. *p < 0.05, **p < 0.01, ***p < 0.001; F-test with Bonferroni correction (a, b), Fisher’s exact test, Mann–Whitney U test (e). The numbers of flies analyzed are indicated.
Fig. 4
Fig. 4. Phenotypic specificity and severity on developmental homeostasis by perturbations of trehalose metabolism.
a, b Inter-individual variation (IIV) (a) and fluctuating asymmetry (FA) (b) in wing sizes for each genotype and for each sex. The upper graphs indicate the variance of wing sizes (a) and size-corrected FA (b). The lower dot plots indicate the distributions of relative wing sizes normalized against the average size among individuals (a) and the distribution of wing size variations within each individual (b). Control, w; CS, Canton S; OR, Oregon R. All mutants were assessed on a w background. c Wing size for each genotype and for each sex. Dotted lines indicate the average values for the control males and females. The percentage differences in the average values, relative to control values, are shown in the graph. **p < 0.01, ***p < 0.001; F-test with Bonferroni correction. The numbers of flies analyzed are indicated.
Fig. 5
Fig. 5. Dietary conditions influence developmental homeostasis in Tps1 mutants.
a Composition of diets used in this study. Corn, cornflour; Glc, glucose. b The survival rates of Tps1MIC mutants for each dietary condition. The percentage of adult flies was determined by the ratio of mutant flies to flies with a balancer chromosome in each vial. c Wing sizes for each dietary condition. The percentage differences for the average wing sizes relative to flies grown on a ND are shown above. d, e Inter-individual variation (IIV) (d) and fluctuating asymmetry (FA) (e) of wing sizes for each dietary condition. *p < 0.05, **p < 0.01, ***p < 0.001; one-way ANOVA with Dunnett’s post hoc test (b), F-test with Bonferroni correction (d, e). The numbers of vials (b) or flies (ce) analyzed are indicated.
Fig. 6
Fig. 6. Asymmetric size reduction in Tps1 mutants is caused by changes in both cell size and cell number.
a Merged images of left (red) and right (blue) wings from control and Tps1MIC mutant males. b The size differences between left (L) and right (R) wings for individual flies. The purple and green lines mark two extreme cases. c The red squares indicate the regions used for the measurement of cell size. Both dorsal and ventral sides for each region were analyzed: in total, 10 areas in each wing were analyzed. d Relative ratios for cell size and cell number between left and right wings in each area. The average values for the larger side (left wing for case 1 and right wing for case 2) were set to 1. e Normalized differences in wing size, cell size, and cell number, modified from the data shown in (d). f The size differences between left and right wings in individual flies. Four randomly selected samples for each dietary condition are shown. g Relative ratios for cell size and cell number between the left and right wings of individual flies. *p < 0.05, **p < 0.01; paired two-tailed Student’s t-test (d, g).

References

    1. Debat V, Debelle A, Dworkin I. Plasticity, canalization, and developmental stability of the Drosophila wing: joint effects of mutations and developmental temperature. Evolution. 2009;63:2864–2876. doi: 10.1111/j.1558-5646.2009.00774.x. - DOI - PubMed
    1. Waddington CH. Canalization of development and the inheritance of acquired characters. Nature. 1942;150:563–565. doi: 10.1038/150563a0. - DOI - PubMed
    1. Palmer AR, Strobeck C. Fluctuating asymmetry: measurement, analysis, patterns. Annu. Rev. Ecol. Syst. 1986;17:391–421. doi: 10.1146/annurev.es.17.110186.002135. - DOI
    1. Leamy LJL, Klingenberg CPK. The genetics and evolution of fluctuating asymmetry. Annu. Rev. Ecol. Evol. Syst. 2005;36:1–21. doi: 10.1146/annurev.ecolsys.36.102003.152640. - DOI
    1. Lens L, Van Dongen S, Kark S, Matthysen E. Fluctuating asymmetry as an indicator of fitness: can we bridge the gap between studies? Biol. Rev. Camb. Philos. Soc. 2002;77:27–38. doi: 10.1017/S1464793101005796. - DOI - PubMed

Publication types

LinkOut - more resources