

High-Frequency rTMS of the Motor Cortex Modulates Cerebellar and Widespread Activity as Revealed by SVM
- PMID: 32265624
- PMCID: PMC7096733
- DOI: 10.3389/fnins.2020.00186
High-Frequency rTMS of the Motor Cortex Modulates Cerebellar and Widespread Activity as Revealed by SVM
Abstract
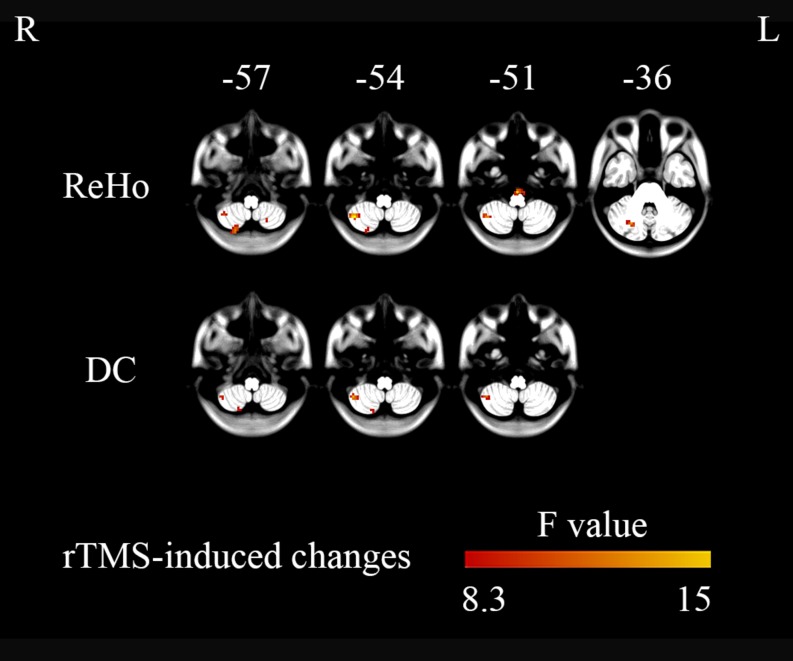
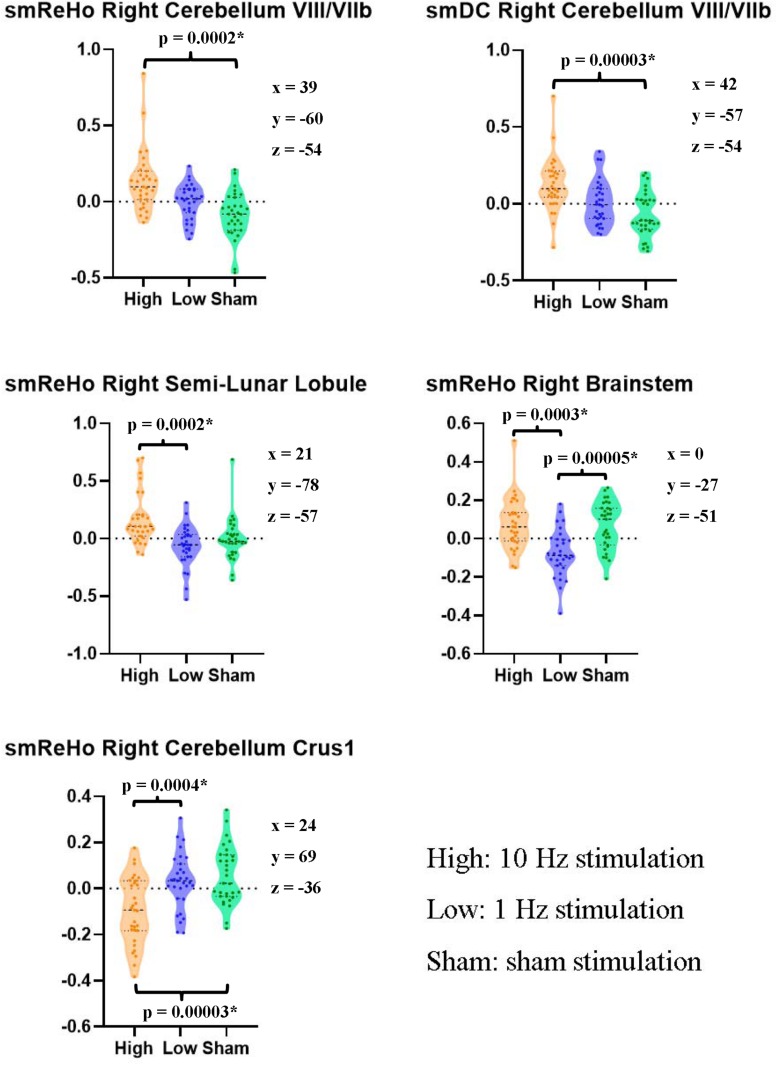
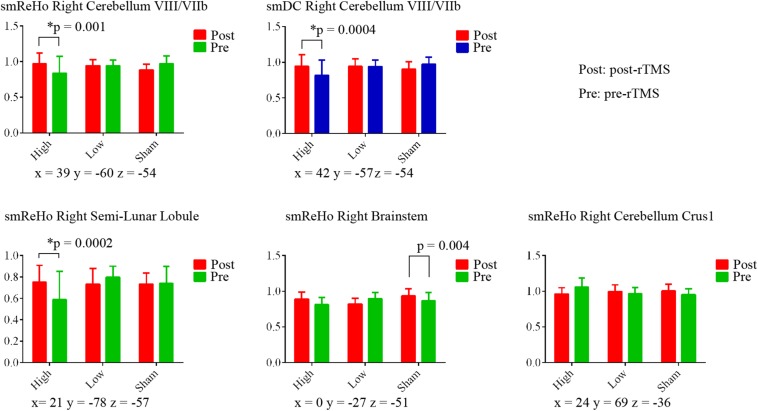
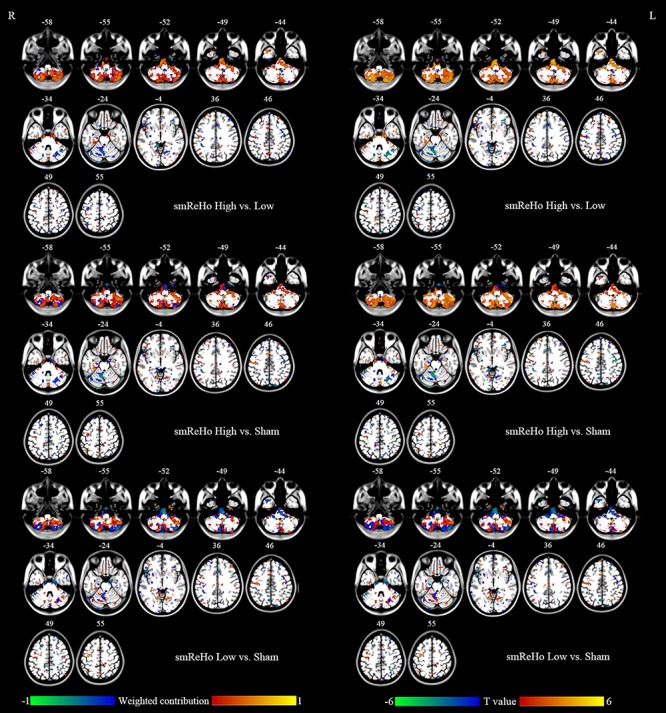
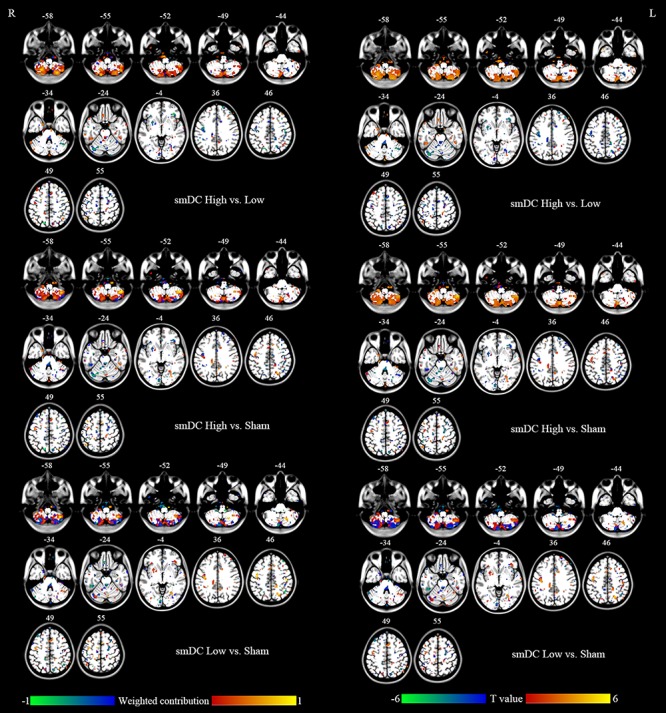
Functional magnetic resonance imaging (fMRI) studies have shown that the effect of repetitive transcranial magnetic stimulation (rTMS) can induce changes in remote brain regions. In the stimulated regions, low-frequency (≤1 Hz) rTMS induces inhibitory effects, while high-frequency (≥5 Hz) stimulation induces excitatory effects. However, these stereotypical effects arising from low- and high-frequency stimulation are based on measurements of motor evoked potentials (MEPs) induced by pulsed stimulation. To test the effects of rTMS on remote brain regions, the current study recruited 31 young healthy adults who participated in three rTMS sessions (10 Hz high frequency, 1 Hz low frequency, and sham) on three separate days. The stimulation target was based on individual fMRI activation in the motor cortex evoked by a finger movement task. Pre- and post-rTMS resting-state fMRI (RS-fMRI) were acquired. Regional homogeneity (ReHo) and degree centrality (DC) were calculated to measure the local and global connectivity, respectively. Compared with the sham session, high-frequency (10 Hz) rTMS significantly increased ReHo and DC in the right cerebellum, while low-frequency (1 Hz) stimulation did not significantly alter ReHo or DC. Then, using a newly developed PAIR support vector machine (SVM) method, we achieved accuracy of 93.18-97.24% by split-half validation for pairwise comparisons between conditions for ReHo or DC. While the univariate analyses suggest that high-frequency rTMS of the left motor cortex could affect distant brain activity in the right cerebellum, the multivariate SVM results suggest that both high- and low-frequency rTMS significantly modulated widespread brain activity. The current findings are useful for increasing the understanding of the mechanisms of rTMS, as well as guiding precise individualized rTMS treatment of movement disorders.
Keywords: cerebellum; fMRI-guided navigation; motor cortex; rTMS; resting-state fMRI.
Copyright © 2020 Wang, Deng, Wu, Li, Feng, Wang, Jing, Zhao, Zang and Zhang.
Figures

Similar articles
-
The Effect of Repetitive Transcranial Magnetic Stimulation of Cerebellar Swallowing Cortex on Brain Neural Activities: A Resting-State fMRI Study.Front Hum Neurosci. 2022 Apr 27;16:802996. doi: 10.3389/fnhum.2022.802996. eCollection 2022. Front Hum Neurosci. 2022. PMID: 35572005 Free PMC article.
-
Influence of Repetitive Transcranial Magnetic Stimulation on Human Neurochemistry and Functional Connectivity: A Pilot MRI/MRS Study at 7 T.Front Neurosci. 2019 Nov 27;13:1260. doi: 10.3389/fnins.2019.01260. eCollection 2019. Front Neurosci. 2019. PMID: 31827419 Free PMC article.
-
Repetitive transcranial magnetic stimulation modulates cortical-subcortical connectivity in sensorimotor network.Eur J Neurosci. 2022 Jan;55(1):227-243. doi: 10.1111/ejn.15571. Epub 2021 Dec 23. Eur J Neurosci. 2022. PMID: 34905661 Clinical Trial.
-
Increased cerebellar activation after repetitive transcranial magnetic stimulation over the primary motor cortex in patients with multiple system atrophy.Ann Transl Med. 2016 Mar;4(6):103. doi: 10.21037/atm.2016.03.24. Ann Transl Med. 2016. PMID: 27127756 Free PMC article. Review.
-
Intensity-dependent regional cerebral blood flow during 1-Hz repetitive transcranial magnetic stimulation (rTMS) in healthy volunteers studied with H215O positron emission tomography: I. Effects of primary motor cortex rTMS.Biol Psychiatry. 2003 Oct 15;54(8):818-25. doi: 10.1016/s0006-3223(03)00002-7. Biol Psychiatry. 2003. PMID: 14550681 Review.
Cited by
-
Pre-clinical indications of brain stimulation treatments for non-affective psychiatric disorders, a status update.Transl Psychiatry. 2023 Dec 14;13(1):390. doi: 10.1038/s41398-023-02673-2. Transl Psychiatry. 2023. PMID: 38097566 Free PMC article. Review.
-
Frequency-Dependent Effects of Cerebellar Repetitive Transcranial Magnetic Stimulation on Visuomotor Accuracy.Front Neurosci. 2022 Mar 18;16:804027. doi: 10.3389/fnins.2022.804027. eCollection 2022. Front Neurosci. 2022. PMID: 35368261 Free PMC article.
-
Theta Frequency Electromagnetic Stimulation Enhances Functional Recovery After Stroke.Transl Stroke Res. 2025 Apr;16(2):194-206. doi: 10.1007/s12975-023-01202-z. Epub 2023 Nov 14. Transl Stroke Res. 2025. PMID: 37962771 Free PMC article. Clinical Trial.
-
Magnetic Resonance Imaging Studies of Neurodegenerative Disease: From Methods to Translational Research.Neurosci Bull. 2023 Jan;39(1):99-112. doi: 10.1007/s12264-022-00905-x. Epub 2022 Jun 30. Neurosci Bull. 2023. PMID: 35771383 Free PMC article. Review.
-
Advancing Neuroscience and Therapy: Insights into Genetic and Non-Genetic Neuromodulation Approaches.Cells. 2025 Jan 15;14(2):122. doi: 10.3390/cells14020122. Cells. 2025. PMID: 39851550 Free PMC article. Review.
References
-
- Buckner R. L., Sepulcre J., Talukdar T., Krienen F. M., Liu H., Hedden T., et al. (2009). Cortical hubs revealed by intrinsic functional connectivity: mapping, assessment of stability, and relation to Alzheimer’s disease. J. Neurosci. 29 1860–1873. 10.1523/JNEUROSCI.5062-08.2009 - DOI - PMC - PubMed
LinkOut - more resources
Full Text Sources