. 2020 Mar 24:14:102.
doi: 10.3389/fnhum.2020.00102. eCollection 2020.

A Minimal Turing Test: Reciprocal Sensorimotor Contingencies for Interaction Detection

Affiliations

A Minimal Turing Test: Reciprocal Sensorimotor Contingencies for Interaction Detection

Pamela Barone et al. Front Hum Neurosci. .

Erratum in

Abstract

In the classical Turing test, participants are challenged to tell whether they are interacting with another human being or with a machine. The way the interaction takes place is not direct, but a distant conversation through computer screen messages. Basic forms of interaction are face-to-face and embodied, context-dependent and based on the detection of reciprocal sensorimotor contingencies. Our idea is that interaction detection requires the integration of proprioceptive and interoceptive patterns with sensorimotor patterns, within quite short time lapses, so that they appear as mutually contingent, as reciprocal. In other words, the experience of interaction takes place when sensorimotor patterns are contingent upon one's own movements, and vice versa. I react to your movement, you react to mine. When I notice both components, I come to experience an interaction. Therefore, we designed a "minimal" Turing test to investigate how much information is required to detect these reciprocal sensorimotor contingencies. Using a new version of the perceptual crossing paradigm, we tested whether participants resorted to interaction detection to tell apart human from machine agents in repeated encounters with these agents. In two studies, we presented participants with movements of a human agent, either online or offline, and movements of a computerized oscillatory agent in three different blocks. In each block, either auditory or audiovisual feedback was provided along each trial. Analysis of participants' explicit responses and of the implicit information subsumed in the dynamics of their series will reveal evidence that participants use the reciprocal sensorimotor contingencies within short time windows. For a machine to pass this minimal Turing test, it should be able to generate this sort of reciprocal contingencies.

Keywords: Turing test; interaction; perceptual crossing; reciprocity; sensorimotor contingencies.


Conflict of interest statement

The authors declare that the research was conducted in the absence of any commercial or financial relationships that could be construed as a potential conflict of interest.

Figures

FIGURE 1
FIGURE 1
Successes and crossings per type of agent and block in Study 1. (A) Probability of success in each block per type of agent. The horizontal dashed line represents chance level (50%). (B) Mean number of crossings in each block per type of agent. Error bars depict 95% confidence intervals.
FIGURE 2
FIGURE 2
Distribution of β in Study 1. On the top: distributions for the values of β (in black online agent, in blue offline agent, in red the oscillatory bot). On the bottom, representation of the means and variances as boxplots.
FIGURE 3
FIGURE 3
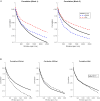
Distribution of the number of crossings according to the window span in Study 1. The distribution has a Gaussian shape. The x-axis (time) is shown on a logarithmic scale in order to see the relation between short times (milliseconds) and longer ones (dozens of seconds, which is the length of a round). On the top: number of crossings after one crossing of reference in relation to the time they are produced, for each block and type of agent. On the bottom: number of accumulated crossings as a function of time.
FIGURE 4
FIGURE 4
Distribution of the number of crossings as we increase the window span in Study 1. The graphs show how many crossings are produced in the window span from one crossing until a specific amount of time.
FIGURE 5
FIGURE 5
Correlation indices for different windows span and delay times in Study 1. Each row refers to a type of agent (human online, human offline and oscillatory bot) and each column refers to either block 1, block 2, or block 3. Inside each graph, the horizontal axis is the delay applied (from –1 s to 1 s), with the central column showing no delay at all. Vertical axis alludes to the window span, from 50 ms (at the top) to 2500 ms (at the bottom). Light colors indicate higher correlation and dark colors indicate lower correlation. All the graphs show the same scale of colors; then, colors can be compared among graphs.
FIGURE 6
FIGURE 6
Correlations in auditory blocks and per type of agent in Study 1. (A) Correlation indices in block 1 (left) and block 3 (right) per type of agent as a function of the window span. (B) Correlation indices per online agent (left), offline agent (medium) and oscillatory bot (right) in block 1 and block 3.
FIGURE 7
FIGURE 7
Successes and crossings per type of agent and block in Study 2. (A) Probability of success in each block per type of agent. The horizontal dashed line represents chance level (50%). (B) Mean number of crossings in each block per type of agent. Error bars depict 95% confidence intervals.
FIGURE 8
FIGURE 8
Distribution of β in Study 2. At the top: distributions for the values of β (in black online agent, in blue offline agent). At the bottom, representation of the means and variances as boxplots.
FIGURE 9
FIGURE 9
Distribution of the number of crossings according to the window span in Study 2. (A) The distribution has a Gaussian shape. The x-axis (time) is shown on a logarithmic scale in order to see the relation between short times (milliseconds) and longer ones (dozens of seconds, which is the length of a round). At the top: number of crossings after one crossing of reference in relation to the time they are produced, for each block and type of agent. At the bottom: the number of accumulated crossings as a function of time. (B) Distribution of the number of crossings as we increase the window span. The graphs show how many crossings are produced in the window span from one crossing until a specific amount of time.
FIGURE 10
FIGURE 10
Correlation indices for different windows span and delay times in Study 2. Each row refers to a type of agent (human online and human offline) and each column refers to either block 1, block 2, or block 3. Inside each graph, the horizontal axis is the delay applied (from –1 s to 1 s), with the central column showing no delay at all. Vertical axis alludes to the window span and it ranges from 50 ms (at the top) to 2500 ms (at the bottom). Light colors indicate higher correlation and dark colors indicate lower correlation. All the graphs show the same scale of colors; then, colors can be compared among graphs.
FIGURE 11
FIGURE 11
Correlations in auditory blocks and per type of agent in Study 2. (A) Correlation indices in block 1 (left) and block 3 (right) per type of agent as a function of the window span. (B) Correlation indices per online agent (left) and offline agent (right) in block 1 and block 3.
FIGURE 12
FIGURE 12
Successes and crossings per type of agent and block for the self-confident sample. (A) Probability of success in each block per type of agent. The horizontal dashed line represents chance level (50%). (B) Mean number of crossings in each block per type of agent. Error bars depict 95% confidence intervals.

References

    1. Auvray M., Lenay C., Stewart J. (2009). Perceptual interactions in a minimalist virtual environment. New Ideas Psychol. 27 32–47. 10.1016/j.newideapsych.2007.12.002 - DOI
    1. Auvray M., Rohde M. (2012). Perceptual crossing: the simplest online paradigm. Front. Hum. Neurosci. 6:181. 10.3389/fnhum.2012.00181 - DOI - PMC - PubMed
    1. Bahrick L. E., Lickliter R. (2012). “The role of intersensory redundacy in early perceptual, cognitive, and social development,” in Multisensory Development, eds Bremner A. J., Lewkowicz D. J., Spence C. (Oxford: Oxford University Press; ), 183–205.
    1. Bedia M. G., Aguilera M., Gómez T., Larrode D. G., Seron F. (2014). Quantifying long-range correlations and 1/f patterns in a minimal experiment of social interaction. Front. Psychol. 5:1281. 10.3389/fpsyg.2014.01281 - DOI - PMC - PubMed
    1. Berkovits I., Hancock G. R., Nevitt J. (2000). Bootstrap resampling approaches for repeated measure designs: relative robustness to sphericity and normality violations. Educ. Psychol. Meas. 60 877–892. 10.1177/00131640021970961 - DOI

LinkOut - more resources