

Effect of Protein Binding on Exposure of Unbound and Total Mycophenolic Acid: A Population Pharmacokinetic Analysis in Chinese Adult Kidney Transplant Recipients
- PMID: 32265712
- PMCID: PMC7100081
- DOI: 10.3389/fphar.2020.00340
Effect of Protein Binding on Exposure of Unbound and Total Mycophenolic Acid: A Population Pharmacokinetic Analysis in Chinese Adult Kidney Transplant Recipients
Abstract
Objectives: The population pharmacokinetic (popPK) characteristics of total mycophenolic acid (tMPA) have been investigated in various ethnic populations. However, investigations of popPK of unbound MPA (uMPA) are few. Thus, a popPK analysis was performed to: (1) characterize the PK of uMPA and tMPA and its 7-O-mycophenolic acid glucuronide (MPAG) metabolite in kidney transplant patients cotreated with cyclosporine (CsA), and (2) identify the clinically significant covariates that explain variability in the dose-exposure relationship.
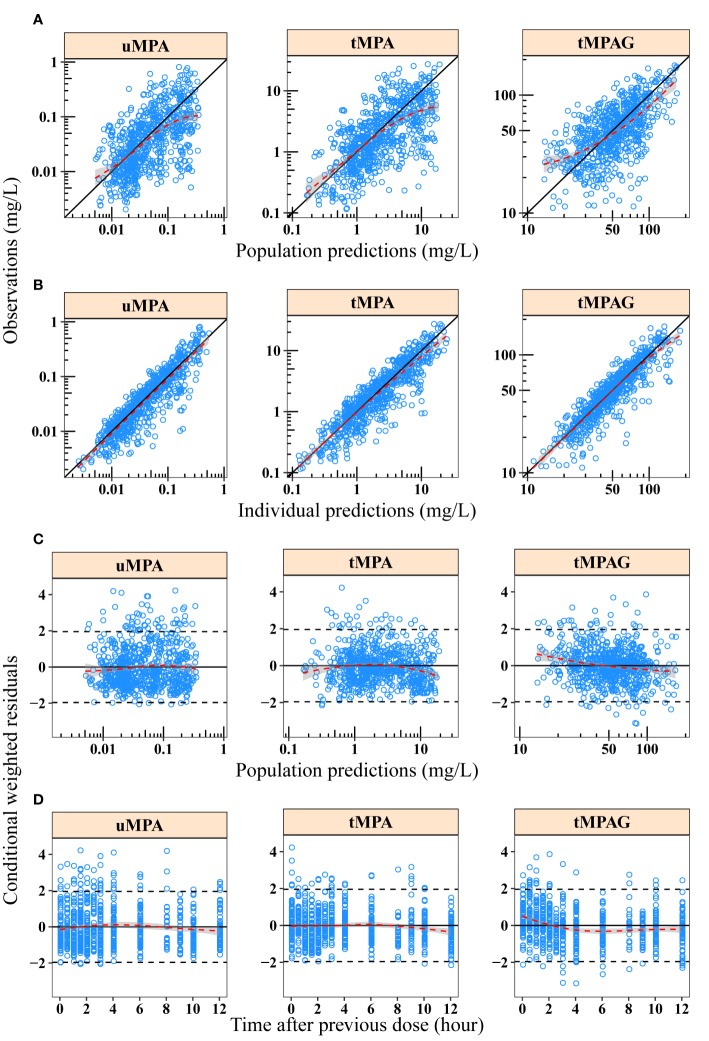
Methods: A total of 740 uMPA, 741 tMPA, and 734 total MPAG (tMPAG) concentration-time data from 58 Chinese kidney transplant patients receiving MPA in combination with CsA were analyzed using NONMEM® software with the stochastic approximation expectation maximization (SAEM) followed by the important sampling (IMP) method. The influence of covariates was tested using a stepwise procedure.
Results: The PK of uMPA and unbound MPAG (uMPAG) were characterized by a two- and one-compartment model with first-order elimination, respectively. A linear protein binding model was used to link uMPA and tMPA. Apparent clearance (CL/F) and central volume of distribution (VC/F) of uMPA (CLuMPA/F and VCuMPA/F, respectively) and protein binding rate constant (k B) were estimated to be 851 L/h [relative standard error (RSE), 7.1%], 718 L (18.5%) and 53.4/h (2.3%), respectively. For uMPAG, the population values (RSE) of CL/F (CLuMPAG) and VC/F (VCuMPAG/F) were 5.71 L/h (4.4%) and 29.9 L (7.7%), respectively. Between-subject variability (BSVs) on CLuMPA/F, VCuMPA/F, CLuMPAG/F, and VCuMPAG/F were 51.0, 80.0, 31.8 and 48.4%, respectively, whereas residual unexplained variability (RUVs) for uMPA, tMPA, and uMPAG were 47.0, 45.9, and 22.0%, respectively. Significant relationships were found between k B and serum albumin (ALB) and between CLuMPAG/F and glomerular filtration rate (GFR). Additionally, model-based simulation showed that changes in ALB concentrations substantially affected tMPA but not uMPA exposure.
Conclusions: The established model adequately described the popPK characteristics of the uMPA, tMPA, and MPAG. The estimated CLuMPA/F and unbound fraction of MPA (FUMPA) in Chinese kidney transplant recipients cotreated with CsA were comparable to those published previously in Caucasians. We recommend monitoring uMPA instead of tMPA to optimize mycophenolate mofetil (MMF) dosing for patients with lower ALB levels.
Keywords: adult kidney transplant recipients; linear protein binding; nonlinear mixed-effect modeling; population pharmacokinetics; unbound mycophenolic acid.
Copyright © 2020 Sheng, Zhao, Niu, Qiu, Zhang and Jiao.
Figures


Similar articles
-
Pharmacokinetic role of protein binding of mycophenolic acid and its glucuronide metabolite in renal transplant recipients.J Pharmacokinet Pharmacodyn. 2009 Dec;36(6):541-64. doi: 10.1007/s10928-009-9136-6. Epub 2009 Nov 11. J Pharmacokinet Pharmacodyn. 2009. PMID: 19904584 Free PMC article.
-
Genetic polymorphisms in metabolic enzymes and transporters have no impact on mycophenolic acid pharmacokinetics in adult kidney transplant patients co-treated with tacrolimus: A population analysis.J Clin Pharm Ther. 2021 Dec;46(6):1564-1575. doi: 10.1111/jcpt.13488. Epub 2021 Jul 26. J Clin Pharm Ther. 2021. PMID: 34312870
-
Clinical pharmacokinetics and pharmacodynamics of mycophenolate in solid organ transplant recipients.Clin Pharmacokinet. 2007;46(1):13-58. doi: 10.2165/00003088-200746010-00002. Clin Pharmacokinet. 2007. PMID: 17201457 Review.
-
Population pharmacokinetics of mycophenolic acid and its main glucuronide metabolite: a comparison between healthy Chinese and Caucasian subjects receiving mycophenolate mofetil.Eur J Clin Pharmacol. 2015 Jan;71(1):95-106. doi: 10.1007/s00228-014-1771-1. Epub 2014 Oct 21. Eur J Clin Pharmacol. 2015. PMID: 25327506 Clinical Trial.
-
Clinical pharmacokinetics of mycophenolate mofetil.Clin Pharmacokinet. 1998 Jun;34(6):429-55. doi: 10.2165/00003088-199834060-00002. Clin Pharmacokinet. 1998. PMID: 9646007 Review.
Cited by
-
Impact of body weight on mycophenolic acid population pharmacokinetics in paediatric lupus nephritis: a pharmacogenomic integration study.Lupus Sci Med. 2025 Jul 1;12(2):e001535. doi: 10.1136/lupus-2025-001535. Lupus Sci Med. 2025. PMID: 40592714 Free PMC article.
-
Population pharmacokinetics and limited sampling strategy for therapeutic drug monitoring of mycophenolate mofetil in Japanese patients with lupus nephritis.J Pharm Health Care Sci. 2023 Jan 9;9(1):1. doi: 10.1186/s40780-022-00271-w. J Pharm Health Care Sci. 2023. PMID: 36624529 Free PMC article.
-
Utility of salivary mycophenolic acid concentration monitoring: Modeling and Monte Carlo validation approach.Pharmacol Res Perspect. 2022 Dec;10(6):e01034. doi: 10.1002/prp2.1034. Pharmacol Res Perspect. 2022. PMID: 36440680 Free PMC article.
-
Population pharmacokinetic analysis identifies an absorption process model for mycophenolic acid in patients with renal transplant.Clin Transl Sci. 2024 Dec;17(12):e70097. doi: 10.1111/cts.70097. Clin Transl Sci. 2024. PMID: 39629510 Free PMC article.
-
In vitro screening of UGT2B10 in silico prioritized putative ligands from drugs used in the pediatric hematopoietic stem cell transplantation setting.Pharmacol Res Perspect. 2024 Dec;12(6):e70011. doi: 10.1002/prp2.70011. Pharmacol Res Perspect. 2024. PMID: 39611692 Free PMC article.
References
-
- Bauer R. J. (2017). NONMEM Users Guide: Introduction to NONMEM 7.4.1, (Gaithersburg, MD: ICON Plc), Available at: https://nonmem.iconplc.com/nonmem741 [Accessed September 12, 2018].
LinkOut - more resources
Full Text Sources
Miscellaneous