. 2020 Mar 20:11:126.
doi: 10.3389/fendo.2020.00126. eCollection 2020.

Evidence for a More Disrupted Immune-Endocrine Relation and Cortisol Immunologic Influences in the Context of Tuberculosis and Type 2 Diabetes Comorbidity

Affiliations

Evidence for a More Disrupted Immune-Endocrine Relation and Cortisol Immunologic Influences in the Context of Tuberculosis and Type 2 Diabetes Comorbidity

Rocío D V Fernández et al. Front Endocrinol (Lausanne). .

Abstract

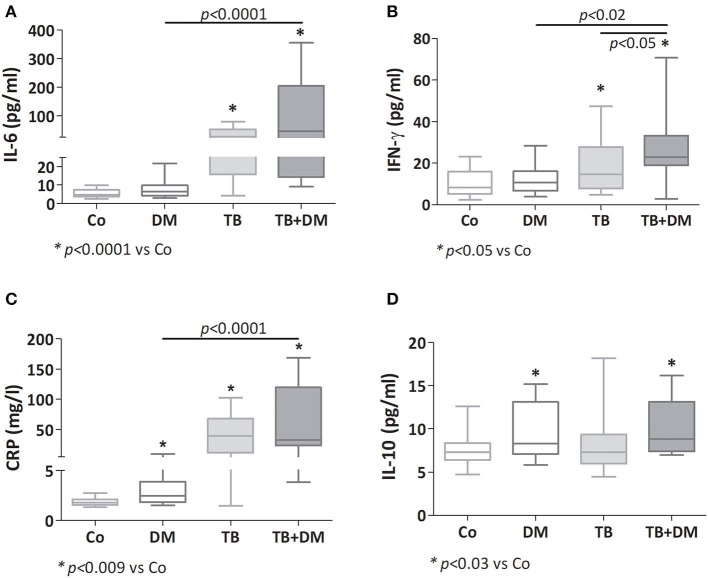
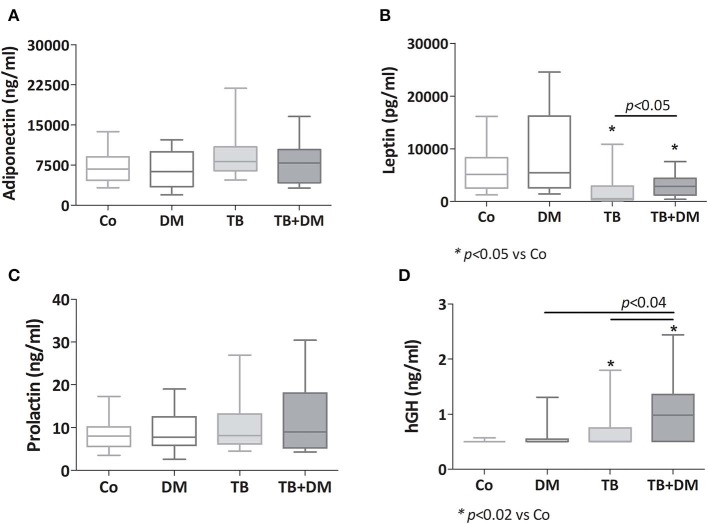
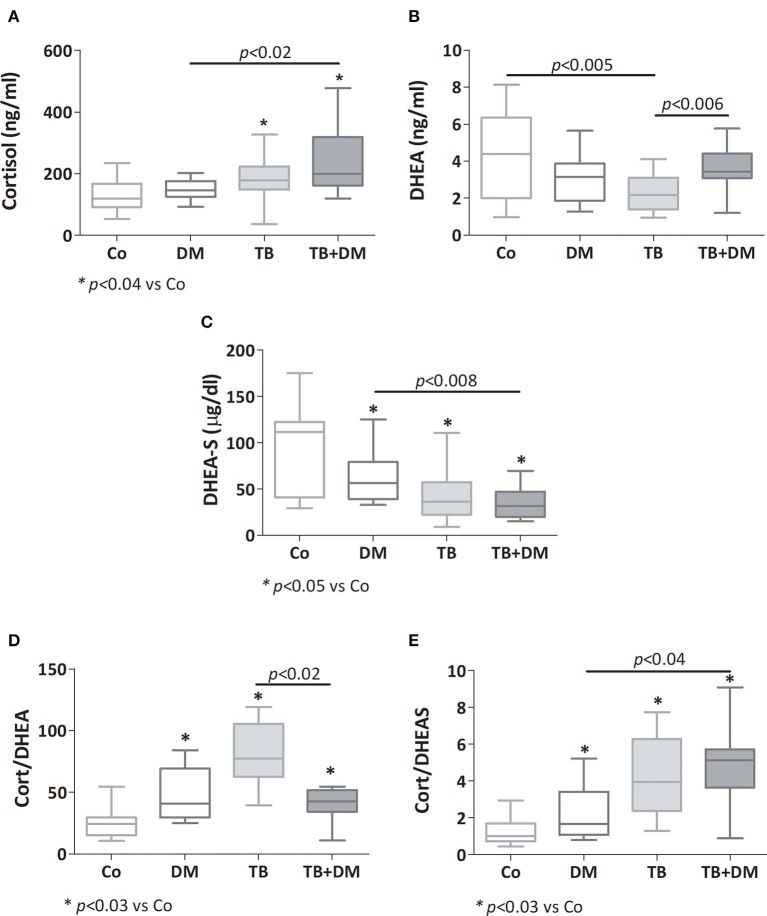
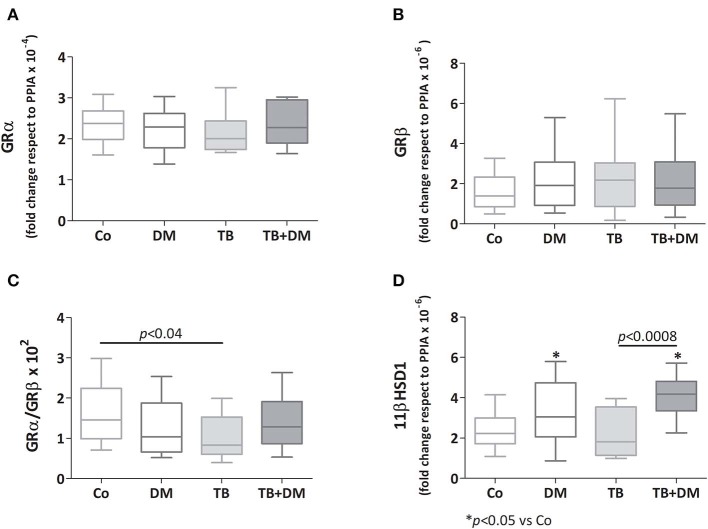
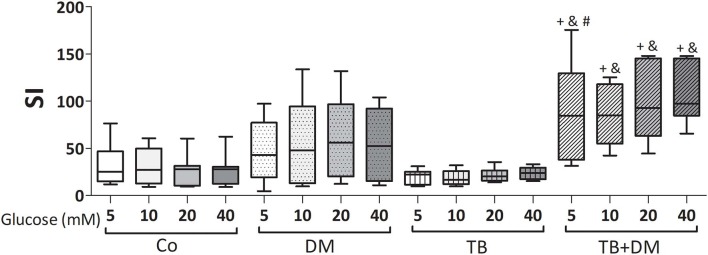
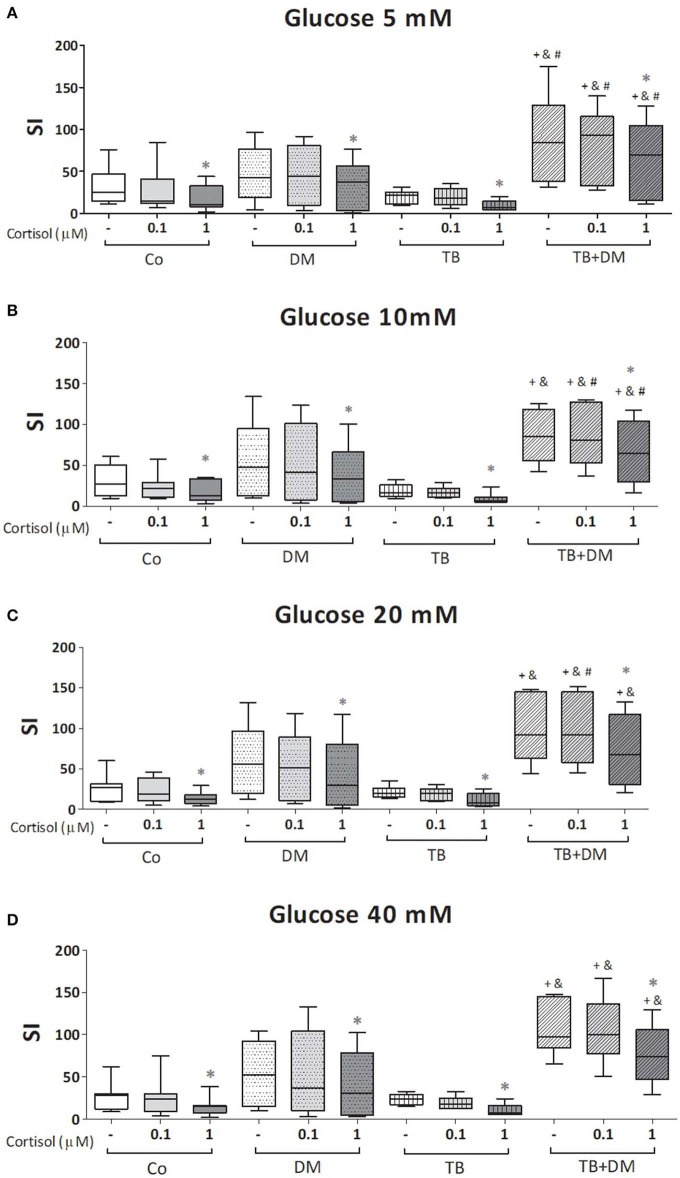
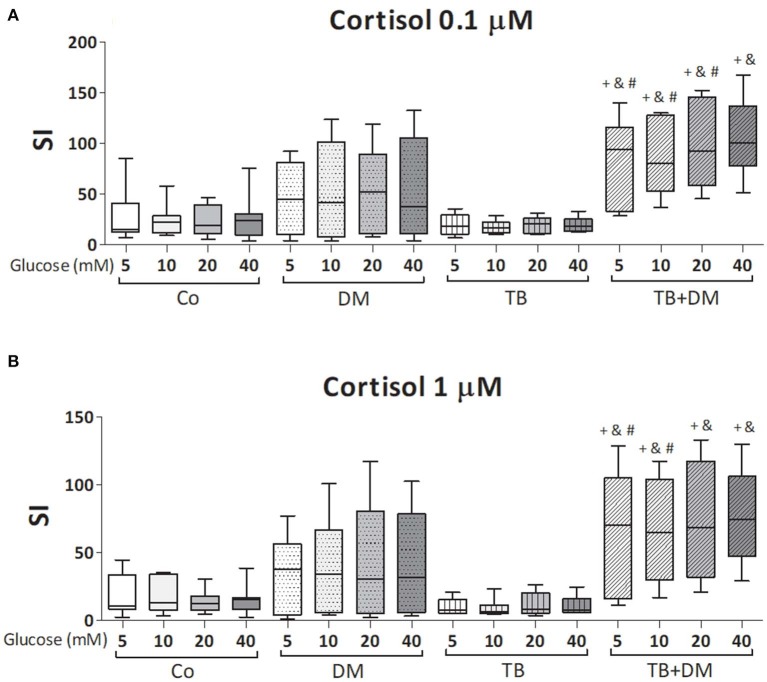
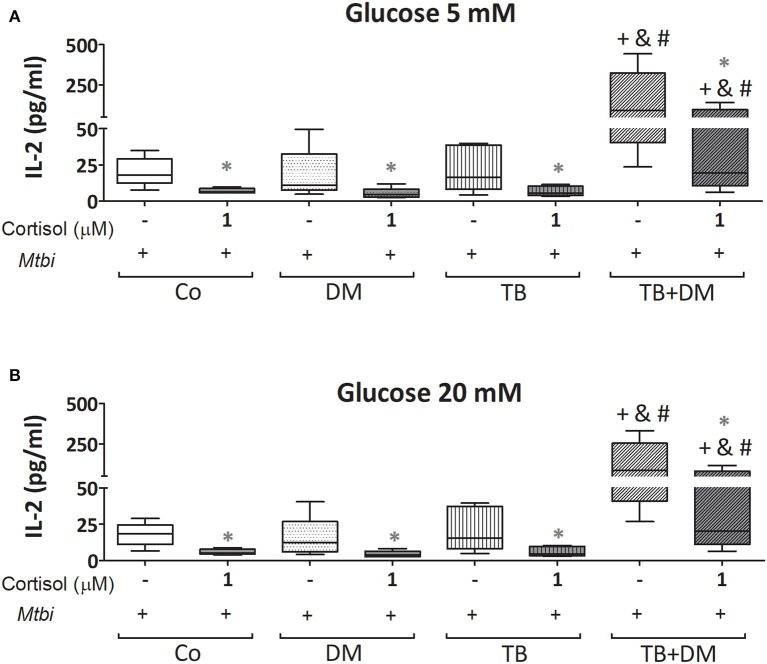
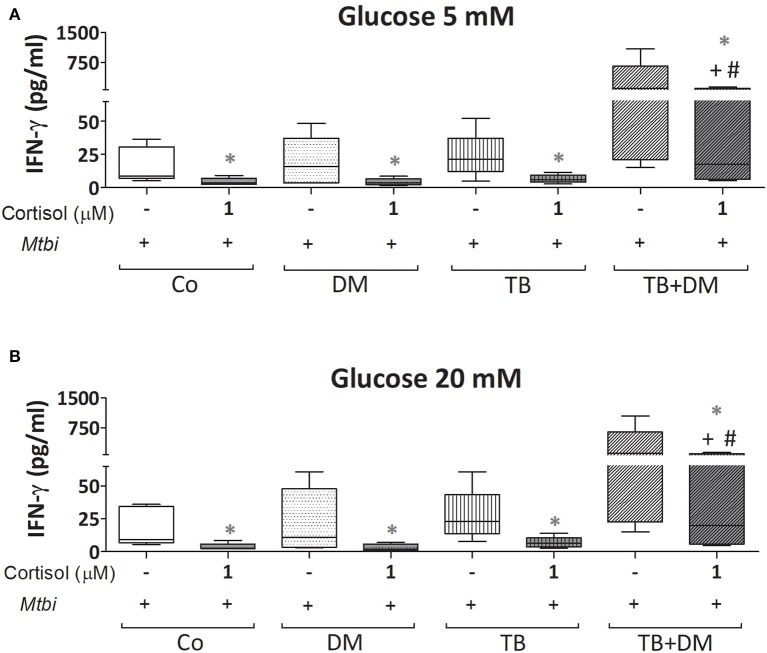
Pulmonary tuberculosis (PTB), caused by Mycobacterium tuberculosis (Mtb), is a major health problem worldwide, further aggravated by the convergence of type 2 diabetes mellitus (DM) which constitutes an important risk factor for TB development. The worse scenario of patients with PTB and DM may be partly related to a more unbalanced defensive response. As such, newly diagnosed PTB patients with DM (TB+DM, n = 11) or not (TB, n = 21), as well as DM (n = 18) patients and pair matched controls (Co, n = 22), were investigated for the circulating immuno-endocrine-metabolic profile (ELISA), along with studies in peripheral blood mononuclear cells (PBMC) analyzing transcript expression (RT-qPCR) of mediators involved in glucocorticoid functionality. Given the hyperglycemic/hypercortisolemic scenario of TB+DM patients, PBMC were also exposed to stress-related cortisol concentrations (0.1 and 1 μM) and supraphysiologic glucose doses (10, 20, and 40 mM) and assessed for the specific response against Mtb stimulation (lymphoproliferation, -thymidine incorporation-, and cytokine production -bead-cytometry). All TB patients displayed increased plasma amounts of cortisol, growth hormone -hGH-, and proinflammatory mediators. In turn, TB+DM showed even higher levels of interferon gamma -IFN-γ- and hGH (vs. TB), or IL-6, C reactive protein, cortisol and hGH (vs. DM). Both DM groups had equally augmented values of IL-10. All TB patients showed decreased dehydroepiandrosterone- sulfate concentrations, even more in TB+DM cases. Leptin was also decreased in both TB cases, particularly in the TB group, revealing a lower body mass index, as well. Unlike PBMC from TB cases showing a decreased relationship between the glucocorticoids receptor (GR) isoforms (GRα/GRβ; functional isoform/negative isoform), cells from TB+DM patients had no changes in this regard, along with an increased expression of 11-beta hydroxysteroid dehydrogenase type-1, the enzyme facilitating intracellular cortisone to cortisol conversion. TB+DM patients also showed an increased Mtb antigen-driven lymphoproliferation. Compared to TB, DM and HCo counterparts, PBMC from TB+DM patients had a biased Th1 response to Mtb stimulation (increased IL-2 and IFN-γ production), even when exposed to inhibitory cortisol doses. TB+DM patients show a more unbalanced immuno-endocrine relationship, respect the non-diabetic counterparts, with a relative deficiency of cortisol immunomodulatory influences, despite their more favorable microenvironment for cortisol-mediated immune effects.

Keywords: cortisol; diabetes mellitus type 2; glucose; immune-endocrine alterations; pulmonary tuberculosis.


Figures

Figure 1
Figure 1
Plasma levels of IL-6 (A), IFN-γ (B), C reactive protein (CRP; C) and IL-10 (D) in controls (Co), patients with type 2 diabetes (DM), with pulmonary tuberculosis (TB) or with TB and DM (TB-DM). Box plots show median values, 25–75 percentiles from data in each group with maximum and minimum values.
Figure 2
Figure 2
Plasma levels of adiponectin (A), leptin (B), prolactin (C) and human growth hormone (hGH, D) in controls (Co), patients with type 2 diabetes (DM), with pulmonary tuberculosis (TB) or with TB and DM (TB-DM). Box plots show median values, 25–75 percentiles from data in each group with maximum and minimum values.
Figure 3
Figure 3
Plasma levels of cortisol (A), dehydroepiandrosterone (DHEA, B), dehydroepiandrosterone-sulfate (DHEA-S, C), cortisol/DHEA ratio (D) and cortisol/DHEA-S ratio (E) in controls (Co), patients with type 2 diabetes (DM), with pulmonary tuberculosis (TB) or with TB and DM (TB-DM). Box plots show median values, 25–75 percentiles from data in each group with maximum and minimum values.
Figure 4
Figure 4
Relative expression of mRNA glucocorticoids receptor (GR) isoforms α (GR α, A) and β (GRβ, B), 11βHSD1 enzyme (D), and the GRα/GRβ ratio (C) in peripheral blood mononuclear cells (PBMC) from controls (Co), patients with type 2 diabetes (DM), with pulmonary tuberculosis (TB) or with TB and DM (TB-DM). Data are expressed as fold change respect to PPIA. Box plots show median values, 25–75 percentiles from data in each group with maximum and minimum values.
Figure 5
Figure 5
Effects of supraphysiological glucose doses on Mtbi-induced proliferation of peripheral blood mononuclear cells (PBMC) from controls (Co), patients with type 2 diabetes (DM), with pulmonary tuberculosis (TB) or with TB and DM (TB-DM). Mtbi: γ-irradiated H37Rv M. tuberculosis strain. Results are shown as Stimulation index (SI: average of counts per minute -cpm- in Mtbi stimulated cultures/average of cpm in unstimulated cultures). Box plots show median values, 25–75 percentiles from data in each group with maximum and minimum values. +different from HCo, p < 0.02; &different from TB, p < 0.003; #different from DM, p < 0.05; in each case when comparing with the same glucose dose.
Figure 6
Figure 6
Effects of glucose doses (5 mM, A; 10 mM, B; 20 mM, C; 40 mM, D) on cortisol-induced inhibition of Mtbi-blastogenesis by peripheral blood mononuclear cells (PBMC) from controls (Co), patients with type 2 diabetes (DM), with pulmonary tuberculosis (TB) or with TB and DM (TB-DM). Mtbi: γ-irradiated H37Rv M. tuberculosis strain. Results are shown as Stimulation index (SI: average of counts per minute -cpm- in Mtbi stimulated cultures/average of cpm in unstimulated cultures). Box plots show median values, 25–75 percentiles from data in each group with maximum and minimum values. +different from Co, p < 0.04; &different from TB, p < 0.02; #different from DM, in each case when comparing the same treatment between groups, p < 0.05; *different from cultures without cortisol and from those treated with 0.1 uM cortisol within the same group, p < 0.05.
Figure 7
Figure 7
Effects of glucose doses on Mtbi-blastogenesis of peripheral blood mononuclear cells (PBMC) from in controls (Co), patients with type 2 diabetes (DM), with pulmonary tuberculosis (TB) or with TB and DM (TB-DM) treated with cortisol 0.1 μM (A) or 1 μM (B). Mtbi: γ-irradiated H37Rv M. tuberculosis strain. Results are shown as Stimulation index (SI: average of counts per minute -cpm- in Mtbi stimulated cultures/average of cpm in unstimulated cultures). Box plots show median values, 25–75 percentiles from data in each group with maximum and minimum values. +different from Co, p < 0.04; &different from TB, p < 0.02; #different from DM, p < 0.05; in each case when comparing with the same glucose dose.
Figure 8
Figure 8
IL-2 production by cultures of peripheral blood mononuclear cells (PBMC) from in controls (Co), patients with type 2 diabetes (DM), with pulmonary tuberculosis (TB) or with TB and DM (TB-DM), stimulated with Mtbi and treated with glucose 5 mM (A) and 20 mM (B) with or without cortisol (1 μM). Mtbi: γ-irradiated H37Rv M. tuberculosis strain. Box plots show median values, 25–75 percentiles from data in each group with maximum and minimum values. +different from Co, p < 0.03; &different from TB, p < 0.04; #different from DM, p < 0.04; in each case when performing between-group comparisons for the same treatment; *different from cultures without cortisol within the same group. p < 0.03.
Figure 9
Figure 9
IFN-γ production by cultures of peripheral blood mononuclear cells (PBMC) from controls (Co), patients with type 2 diabetes (DM), with pulmonary tuberculosis (TB) or with TB and DM (TB-DM), stimulated with Mtbi and treated with glucose 5 mM (A) and 20 mM (B) with or without cortisol (1 μM). Mtbi: γ-irradiated H37Rv M. tuberculosis strain. Box plots show median values, 25–75 percentiles from data in each group with maximum and minimum values. +different from Co, p < 0.04; #different from DM, p < 0.05; in each case when performing between-group comparisons for the same treatment; *different from cultures without cortisol within the same group p < 0.03.

References

    1. Global Tuberculosis Report (2018). Geneva: World Health Organization. Licence: CC BY-NC-SA 3.0 IGO. Available online at: https://apps.who.int/medicinedocs/documents/s23553en/s23553en.pdf (accessed March 9, 2020).
    1. Ernst JD. The immunological life cycle of tuberculosis. Nat Rev Immunol. (2012) 12:581–91. 10.1038/nri3259 - DOI - PubMed
    1. Dooley KE, Chaisson RE. Tuberculosis and diabetes mellitus: convergence of two epidemics. Lancet Infect Dis. (2009) 9:737–46. 10.1016/S1473-3099(09)70282-8 - DOI - PMC - PubMed
    1. Stevenson CR, Forouhi NG, Roglic G, Williams BG, Lauer JA, Dye C, et al. Diabetes and tuberculosis: the impact of the diabetes epidemic on tuberculosis incidence. BMC Public Health. (2007) 7:234. 10.1186/1471-2458-7-234 - DOI - PMC - PubMed
    1. Jeon CY, Murray MB. Diabetes mellitus increases the risk of active tuberculosis: a systematic review of 13 observational studies. PLoS Med. (2008) 5:1091–101. 10.1371/journal.pmed.0050152 - DOI - PMC - PubMed

Publication types

MeSH terms