. 2020 Mar 20:11:395.
doi: 10.3389/fimmu.2020.00395. eCollection 2020.

In Human Autoimmunity, a Substantial Component of the B Cell Repertoire Consists of Polyclonal, Barely Mutated IgG+ve B Cells

Affiliations

In Human Autoimmunity, a Substantial Component of the B Cell Repertoire Consists of Polyclonal, Barely Mutated IgG+ve B Cells

Graeme J M Cowan et al. Front Immunol. .

Abstract

B cells are critical for promoting autoimmunity and the success of B cell depletion therapy in rheumatoid arthritis (RA) confirms their importance in driving chronic inflammation. Whilst disease specific autoantibodies are useful diagnostically, our understanding of the pathogenic B cell repertoire remains unclear. Defining it would lead to novel insights and curative treatments. To address this, we have undertaken the largest study to date of over 150 RA patients, utilizing next generation sequencing (NGS) to analyze up to 200,000 BCR sequences per patient. The full-length antigen-binding variable region of the heavy chain (IgGHV) of the IgG B cell receptor (BCR) were sequenced. Surprisingly, RA patients do not express particular clonal expansions of B cells at diagnosis. Rather they express a polyclonal IgG repertoire with a significant increase in BCRs that have barely mutated away from the germline sequence. This pattern remains even after commencing disease modifying therapy. These hypomutated BCRs are expressed by TNF-alpha secreting IgG+veCD27-ve B cells, that are expanded in RA peripheral blood and enriched in the rheumatoid synovium. A similar B cell repertoire is expressed by patients with Sjögren's syndrome. A rate limiting step in the initiation of autoimmunity is the activation of B cells and this data reveals that a sizeable component of the human autoimmune B cell repertoire consists of polyclonal, hypomutated IgG+ve B cells, that may play a critical role in driving chronic inflammation.

Keywords: B cells; BCR; TNF; autoimmunity; rheumatoid arthritis.


Figures

Figure 1
Figure 1
(A) Distribution of the number of IgG-Vh mismatches per sequencing read for DMARD naïve early RA patients (ERA) (n = 14) and healthy control donors (n = 16). Individual density plots are stacked to indicate the overall distribution across all samples in each group. Maximum cumulative density values for each group are normalized to the mode to facilitate inter-group comparison. (B) Skewness of IgG mutation distributions from RA patients (n = 14) and healthy control groups (n = 16). Horizontal lines denote the arithmetic mean skewness for each group. P-value shown was calculated using Mann-Whitney U-test. (C) Distribution of the number of V segment mismatches per sequencing read for ERA patients [cohort 2, n = 113]. Individual density plots are stacked to indicate the overall distribution across all samples in each group. (D) Mean IgG-Vh mismatches for control donors (n = 16), ERA donors from cohorts 1 and 2 (n = 14 and n = 113, respectively), ESRA donors from cohort 3 (n = 16), and Sjögren's syndrome patients (n = 15). P-values are generated by Kruskal-Wallis test with Dunn's post-test to compare the means for each RA group with the control donor group. (E) Percentage of IgG reads with fewer than 5 mutations for control donors (n = 16), ERA donors from cohorts 1 and 2 (n = 14 and n = 113, respectively), ESRA donors from cohort 3 (n = 16), and Sjögren's syndrome patients (n = 15). P-values are generated by Kruskal-Wallis test with Dunn's post-test to compare the median values for each RA group with the control donor group.
Figure 2
Figure 2
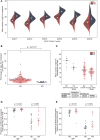
(A) The mean number of IgG-Vh V segment mismatches per read for each individual in the ERA (cohort 2, n = 113) and healthy control groups (cohort 1, n = 16). Data are split by germline IGHV family group. White circles denote group means, vertical white lines show the 95% confidence interval for the mean. (B) Percentage of IgG reads that use the IGHV4-34 allele in ERA patients (cohort 2, n = 113) and control donors (cohort 1, n = 16). Horizontal bars denote group means, and p-values calculated by Mann Whitney U-test. (C) Mean number of IgG-Vh mismatches per read for ERA donors (n = 113, cohort 2) and healthy control donors (n = 16). For each donor, the mean number of mutations for all reads mapping to IGHV4-34, or to other IGHV alleles, were calculated and plotted independently, with horizontal bars plotted to indicate the group mean. P-values calculated using Kruskal Wallis with Dunn's post-hoc pairwise test, and with Holm-Šídák correction for multiple comparisons of group means. (D) Proportion of IGHV4-34 reads of IgM and IgG isotype sequences where the carbohydrate binding AVY motif within framework region 1 (IMGT numbering 24–26) is present. P-value calculated using Mann-Whitney test to compare the group means. (E) Proportion of IGHV4-34 IgM and IgG isotype sequences where the NHS glycosylation motif within CDR2 (amino acid residues 57–59, IMGT numbering scheme) is present. P-value calculated using Mann-Whitney test to compare the group means.
Figure 3
Figure 3
(A) Gini coefficients of IgG sequences for each RA donor from cohort 2 (n = 113). Gini coefficients are a measure of inequality of distribution, where a value of 0 indicates perfect equality (all IgG clonotypes of equal proportion). The Gini coefficient was calculated independently for hypomutated (fewer than 5 mismatches) or hypermutated (5 or more mismatches) sequences to compare the degree of clonal expansion in each category. (B) Percentage of the IgG-Vh repertoire composed of unique clonotypes from ERA patients and healthy controls (cohort 1, n = 14 + 16, respectively), with sequences split into hypermutated (5 mismatches or more) and hypomutated (fewer than 5 mismatches). For this analysis, clones were defined as having identical CDR3 sequences, sharing predicted V segment identity and having the same number of V segment mutations. (C) Scatterplots showing the percentage of the repertoire against the hypermutation rate for each clone for the three individual RA donors with the greatest frequencies of hypomutated B-cells (in cohort 1). Clone definition is the same as that used for (B).
Figure 4
Figure 4
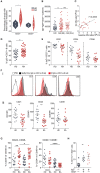
(A) Prevalence of hypomutated V segment sequences in CD27+ve and CD27−ve IgG+ve B-cells from RA and control donors. White spots indicate individual data points for each donor (n = 4 donors per group). P-value calculated using Mann-Whitney test. (B) Whole blood was stained for flow cytometry to determine cell number. IgD−veIgM−veCD27−ve B cells were gated and cells/ml calculated. n = 35 HD donors, n = 39 RA (0 m) donors, n = 38 RA (6 m) donors. P-value calculated using Mann-Whitney test. (C) Scatterplot of the frequencies of DN (IgD−veIgM−veCD27−ve) B cells from paired baseline and 6-month data from (B), to determine if the frequency of DN B cells was correlated in the same patient 6 months following DMARD therapy. n = 27 patients. R2 value calculated using Pearson's correlation. (D) Cell frequencies of CD20+veCD19+veIgG+veCD27−ve B cells from PBMCs from control donors and RA patients assessed by flow cytometry. Cells were gated for CD20+veCD19+veIgG+ve B cells then the proportion of CD27−ve cells determined. n = 22 HD donors and 42 RA donors. P-value calculated using unpaired T-test. (E) Cell surface markers of IgG+veCD27−ve B cell population were analyzed by flow cytometry. Gating strategy is detailed in Supplementary Figure 8. n = 13 HD donors and 16 RA donors. P-values calculated using Mann-Whitney test. Further surface markers are shown in Supplementary Figure 8. (F) (i) Representative histogram plots of relevant fluorescence minus one (FMO) shown with open black line, healthy donor IgG+veCD27−ve (shaded black line) and RA IgG+veCD27−ve (shaded red line). (ii) Mean Fluorescence Intensity (MFI) data for individual samples was plotted for HD (gray) and RA (red) IgG+ve CD27−ve B cells. P-values were calculated using the Mann-Whitney test. n = 13 HD donors and 16 RA donors. (G) IgG+veCD27−ve B cells were also analyzed for dual staining of CD24 and CD38 by flow cytometry. Percentage was plotted for HD (gray) and RA (red) for both IgG+veCD27−ve (filled symbol) and IgG+veCD27+ve (open symbol) populations. For comparison of HD and RA IgG+ve CD27−ve populations P-values were obtained using Mann-Whitney test. For comparison of RA IgG+veCD27−ve to RA IgG+ve CD27+ve populations, P-values were obtained using Wilcoxon paired test. (H) Percentage of CD20+veCD19+ve CD11c+ T-Bet+ve B cells within RA PBMC IgG−veCD27−ve, IgG+veCD27+ve and IgG+veCD27−ve B cells. IgG+ve B cell populations had a higher percentage of CD11c+ T-Bet+ve B cells than IgG−veCD27−ve, but there was no significant difference in the percentages of CD11c+ T-Bet+ve B cells within IgG+ve B cells. n = 8 RA donors. P-value calculated using Wilcoxon matched-pair test. *p < 0.05, **p < 0.01, ***p < 0.001, ****p < 0.0001.
Figure 5
Figure 5
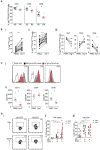
(A) Flow cytometry plots of peripheral blood IgG+veCD27−ve B cells stained for CD21, CD24, and CD38, taken from RA patients at the time of undergoing arthroplasty and compared to healthy donor PBMC. (B) (i) Flow cytometry of paired peripheral blood (PBMC) and synovial tissue (SynT) B cells from RA patients taken at the time of undergoing arthroplasty. The graph shows the percentage of IgG+ve B cells within the CD20+veCD19+ve B cell population. (ii) Percentage of CD20+veCD19+veIgG+veCD27−ve B cells within the IgG+veCD20+veCD19+ve B cell population. For (i) and (ii) n = 24 RA donors. P-value calculated using paired t-test. (iii) Paired RA PBMC and synovial tissue B cells within the IgG+veCD27−ve B cells stained for CD21, CD24 and CD38. n = 6 donors. P-value calculated using Wilcoxon matched-pair T-test. (C) Representative histogram plots of isotype control shown with open black line, PBMC IgG+veCD27−ve (shaded black line) and synovial Tissue IgG+veCD27−ve (shaded red line) (i). (ii) Mean Fluorescence Intensity (MFI) data for individual samples was plotted (ii) for PBMC (gray) and SynT (red) for IgG+ve CD27−ve B cells. n = 6 donors. P-values were calculated using the Wilcoxon paired test. Further surface marker data is shown in Supplementary Figure 9. (D) PBMC and synovial tissue cells were stimulated for 4.5 h with PMA, Ionomycin and Brefeldin A, then stained for intracellular cytokines. Representative flow cytometry plots showing the intracellular cytokine staining of synovial tissue IgG+veCD27−ve and IgG+veCD27+ve B cell subsets for TNF-alpha and GM-CSF (i). Pooled data for PBMC and Synovial tissue (ii) TNF-alpha and (iii) GM-CSF. Each point represents an individual patient sample. n = 9 donors. P-values calculated using Wilcoxon matched-pair test between tissue type or cell type. *p < 0.05, **p < 0.01, ***p < 0.001, ****p < 0.0001.
Figure 6
Figure 6
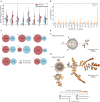
(A) Distributions of mutation counts from paired peripheral blood (blue) and synovial (red) IgG sequence repertoires from each of 8 RA patients with ESRA undergoing arthroplasty. The central horizontal line indicates the median of each distribution, with the upper and lower dashed lines representing the upper and lower quartiles, respectively. (B) Percentage of the repertoire composed of each CDR3 clonotype for paired synovial (S) and peripheral blood (P) samples from each of the 8 RA patients shown in (A) (cohort 4). (C) Repertoire overlap of synovial (red) and peripheral blood (blue) IgG repertoires of the RA patients. Each Venn diagram represents a single patient. The number of unique, non-singleton IgG sequences in the repertoire from each compartment is depicted at the center of each circle, and shared sequences are enumerated at the intersection between the two circles. Two shared sequences are considered identical if they possessed the same CDR3 nucleotide sequence and used the same V and J gene segments. (D) Lineage trees of B cell clones that show evidence of egression from the synovium into the periphery of RA patients, inferred for (i) clone 36 from patient B and (ii) clone 282 from patient K. Each node represents a unique non-singleton IgG sequence with the size of the node scales non-linearly in proportion to the number of sequence duplicated observed. The label at the center of each node represents the tissue origin of the sequence, and node color indicates the number of somatic mutations present in the clone sequence. Red arrows mark egression events from the synovium to the periphery. Lineage trees were inferred using PHYLIP v3.6 and plotted in Gephi v0.92.

References

    1. McInnes IB, Schett G. The pathogenesis of rheumatoid arthritis. N Engl J Med. (2011) 365:2205–19. 10.1056/NEJMra1004965 - DOI - PubMed
    1. Edwards JC, Szczepanski L, Szechinski J, Filipowicz-Sosnowska A, Emery P, Close DR, et al. . Efficacy of B-cell-targeted therapy with rituximab in patients with rheumatoid arthritis. N Engl J Med. (2004) 350:2572–81. 10.1056/NEJMoa032534 - DOI - PubMed
    1. Keystone E, Emery P, Peterfy CG, Tak PP, Cohen S, Genovese MC, et al. . Rituximab inhibits structural joint damage in patients with rheumatoid arthritis with an inadequate response to tumour necrosis factor inhibitor therapies. Ann Rheum Dis. (2009) 68:216–21. 10.1136/ard.2007.085787 - DOI - PubMed
    1. Porter D, van Melckebeke J, Dale J, Messow CM, McConnachie A, Walker A, et al. . Tumour necrosis factor inhibition versus rituximab for patients with rheumatoid arthritis who require biological treatment (ORBIT): an open-label, randomised controlled, non-inferiority, trial. Lancet. (2016) 388:239–47. 10.1016/S0140-6736(16)00380-9 - DOI - PubMed
    1. Nielen MM, van Schaardenburg D, Reesink HW, van de Stadt RJ, van der Horst-Bruinsma IE, de Koning MH, et al. . Specific autoantibodies precede the symptoms of rheumatoid arthritis: a study of serial measurements in blood donors. Arthritis Rheum. (2004) 50:380–6. 10.1002/art.20018 - DOI - PubMed

Publication types

MeSH terms

Substances