. 2020 Mar 19:11:468.
doi: 10.3389/fimmu.2020.00468. eCollection 2020.

Fungal Dysbiosis and Intestinal Inflammation in Children With Beta-Cell Autoimmunity

Affiliations

Fungal Dysbiosis and Intestinal Inflammation in Children With Beta-Cell Autoimmunity

Jarno Honkanen et al. Front Immunol. .

Abstract

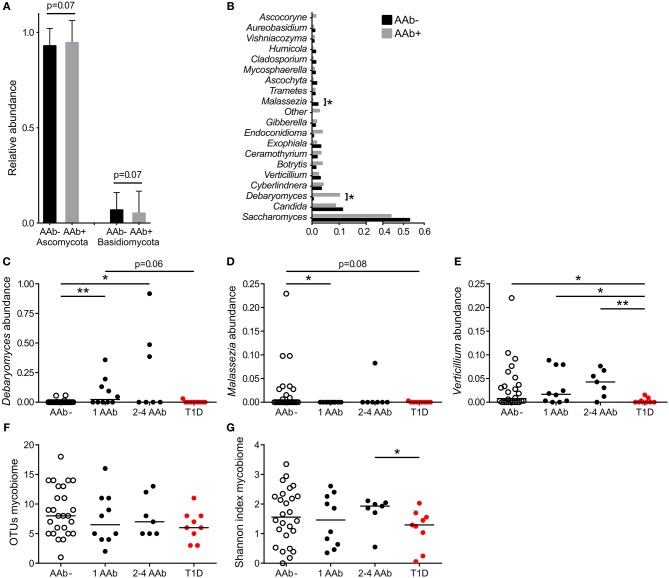
Although gut bacterial dysbiosis is recognized as a regulator of beta-cell autoimmunity, no data is available on fungal dysbiosis in the children at the risk of type 1 diabetes (T1D). We hypothesized that the co-occurrence of fungal and bacterial dysbiosis contributes to the intestinal inflammation and autoimmune destruction of insulin-producing beta-cells in T1D. Fecal and blood samples were collected from 26 children tested positive for at least one diabetes-associated autoantibody (IAA, GADA, IA-2A or ICA) and matched autoantibody-negative children with HLA-conferred susceptibility to T1D (matched for HLA-DQB1 haplotype, age, gender and early childhood nutrition). Bacterial 16S and fungal ITS2 sequencing, and analyses of the markers of intestinal inflammation, namely fecal human beta-defensin-2 (HBD2), calprotectin and secretory total IgA, were performed. Anti-Saccharomyces cerevisiae antibodies (ASCA) and circulating cytokines, IFNG, IL-17 and IL-22, were studied. After these analyses, the children were followed for development of clinical T1D (median 8 years and 8 months). Nine autoantibody positive children were diagnosed with T1D, whereas none of the autoantibody negative children developed T1D during the follow-up. Fungal dysbiosis, characterized by high abundance of fecal Saccharomyces and Candida, was found in the progressors, i.e., children with beta-cell autoimmunity who during the follow-up progressed to clinical T1D. These children showed also bacterial dysbiosis, i.e., increased Bacteroidales and Clostridiales ratio, which was, however, found also in the non-progressors, and is thus a common nominator in the children with beta-cell autoimmunity. Furthermore, the progressors showed markers of intestinal inflammation detected as increased levels of fecal HBD2 and ASCA IgG to fungal antigens. We conclude that the fungal and bacterial dysbiosis, and intestinal inflammation are associated with the development of T1D in children with beta-cell autoimmunity.

Keywords: Candida; Saccharomyces; dysbiosis; gut; inflammation; mycobiome; type 1 diabetes.


Figures

Figure 1
Figure 1
Study design: Microbiome composition, intestinal inflammation and the development of clinical type 1 diabetes (T1D) during the follow-up. Fecal and blood samples were collected from 26 children tested positive for at least one diabetes-associated autoantibody (IAA, GADA, IA-2A, or ICA) and matched autoantibody-negative children with HLA-conferred susceptibility to T1D. Case-control pairs were matched for HLA-DQB1 haplotype, age, gender, and early childhood nutrition. Bacterial 16S and fungal ITS2 sequencing and analyses of the markers of intestinal inflammation, namely HBD2, calprotectin, and secretory total IgA, were performed using fecal samples. Blood samples were analyzed for the levels of ASCA IgA/IgG and circulating cytokines IFNG, IL-17, and IL-22. After the analyses, the children were followed for development of clinical T1D (median 8 years and 8 months). During the follow-up nine autoantibody-positive children were diagnosed with T1D, whereas none of the autoantibody-negative children developed T1D.
Figure 2
Figure 2
Fungal community characteristics in children with or without T1D-associated autoantibodies. (A) Relative abundance of fungal phyla Ascomycota (left columns) and Basidiomycota (right columns). Children without autoantibodies: black columns and children with autoantibodies: gray columns. (B) Relative abundance of 20 most abundant fungal genera in children with (gray bars) and without autoantibodies (black bars). (C–E) The relative abundances of Debaryomyces (C), Malessezia (D), and Verticillium (E) in healthy children without autoantibodies, in children with a different number of autoantibodies and in children who have progressed from autoantibody-positive state to clinical T1D. (F,G) Number of OTUs and Shannon diversity index in healthy children without autoantibodies, in children with a different number of autoantibodies and in children who have progressed from autoantibody-positive state to clinical T1D. Healthy children without autoantibodies are marked with open circles, children with 1–4 autoantibodies with black circles and children who have progressed to clinical disease with red circle. p-values were calculated with the Mann–Whitney U-test. *p < 0.05, **p < 0.01.
Figure 3
Figure 3
Hierarchical clustering over bacterial and fungal taxa and PCoA plots of fungal and bacterial communities. (A) Heatmap showing the clustering of the relative abundances. The clustering resulted in three major clusters (Clusters 1, 4, and 5) defined by differential abundance of fungi belonging to the phylum Ascomycota and the bacterial phyla Firmicutes and Bacteroidetes. Clusters 1, 4, and 5 are encircled with black borders. In the heatmap children with autoantibodies are denoted with AAb+ (red font) and autoantibody-negative children with AAb (blue font). Children who have progressed from autoantibody-positive state to clinical disease are denoted with T1D and a red circle in the heatmap. Color intensity of the heatmap increases with the taxa relative abundance from low (blue) to high (red). (B,C) Principal coordinate analysis (PCoA) biplots (incorporate taxonomy information) on weighted UniFrac distances between the fungal (B) and bacterial (C) gut microbial communities profiles of children at risk of the type 1 diabetes development. Each point represent a single sample and is colored according to the major taxa clusters (Clusters 1, 4, 5, and other), as defined by the hierarchical clustering analysis. Order and genus-level taxonomy displayed by biplot arrows illustrates that the abundance of (B) the Saccharomyces and Candida contribute to the separation of Cluster 1 and Cluster 4, and (C) Clostridiales and Bacteroidales contribute to the distinct clustering patterns of Cluster 1 in comparison to Clusters 4 and 5. p-values were calculated with the Mann–Whitney U-test. *p < 0.05, **p < 0.01. Grouping significance was determined using the PERMANOVA (999 permutations) with the adonis function in the vegan R package (p < 0.001).
Figure 4
Figure 4
Inflammatory markers in different clusters and in children with or without beta-cell autoimmunity. (A) Fecal concentrations of HBD2 in the Clusters 1, 4, and 5. HBD2 levels were higher in the species Cluster 4 compared to Clusters 1 and 5. (B) Children with autoantibodies had elevated levels of fecal HBD2 compared to autoantibody-negative children. (C) Children with only one autoantibody had elevated levels of fecal HBD2 compared to autoantibody-negative children. (D) Serum ASCA IgG concentrations were significantly higher in the Clusters 1 and 4 compared to the Cluster 5. (E) Serum ASCA IgG concentrations in AAb- and in AAb+ children. (F) The autoantibody-positive children who have progressed to clinical disease had elevated serum ASCA IgG antibodies compared to autoantibody-negative children. (G) The relationship between serum ASCA IgA levels and seropositivity duration in the species Cluster 4. (H) The relationship between fecal total IgA and relative abundance of Saccharomycetes in the Cluster 4. (I) The relationship between fecal total IgA and relative abundance of Saccharomyces in the Cluster 4. Healthy children without autoantibodies are marked with open circles, children with 1–4 autoantibodies with black circles and children who have progressed to clinical disease with red circle. Horizontal lines represent median values. p-values were calculated with the Mann–Whitney U-test. Correlations were calculated with the Spearman rank correlation test.*p < 0.05, **p < 0.01.
Figure 5
Figure 5
Serum cytokine concentration in different clusters. (A,B) The relationships between serum IFNG and relative abundance of fecal Bacteroidetes and Firmicutes in the Cluster 1. (D,E) The relationships between serum IL-17A and relative abundance of fecal Bacteroidetes and Firmicutes in the Cluster 1. (C,F) IFNG and IL-17A levels were significantly higher in the Cluster 5 compared to the Clusters 1 and 4. (G,H) The relationships between serum IFNG and relative abundance of fecal Bacteroidetes and Firmicutes in the Cluster 1. Horizontal lines represent median values. p-values were calculated with the Mann–Whitney U-test. Correlations were calculated with the Spearman rank correlation test.*p < 0.05, **p < 0.01.

References

    1. Bendelac A, Carnaud C, Boitard C, Bach JF. Syngeneic transfer of autoimmune diabetes from diabetic NOD mice to healthy neonates. requirement for both L3T4+ and Lyt-2+ T cells. J Exp Med. (1987) 166:823–32. 10.1084/jem.166.4.823 - DOI - PMC - PubMed
    1. Bottazzo GF, Florin-Christensen A, Doniach D. Islet-cell antibodies in diabetes mellitus with autoimmune polyendocrine deficiencies. Lancet. (1974) 2:1279–83. 10.1016/S0140-6736(74)90140-8 - DOI - PubMed
    1. MacCuish AC, Irvine WJ, Barnes EW, Duncan LJ. Antibodies to pancreatic islet cells in insulin-dependent diabetics with coexistent autoimmune disease. Lancet. (1974) 2:1529–31. 10.1016/S0140-6736(74)90281-5 - DOI - PubMed
    1. Morgan NG, Leete P, Foulis AK, Richardson SJ. Islet inflammation in human type 1 diabetes mellitus. IUBMB Life. (2014) 66:723–34. 10.1002/iub.1330 - DOI - PubMed
    1. Ferreira RC, Guo H, Coulson RM, Smyth DJ, Pekalski ML, Burren OS, et al. . A type I interferon transcriptional signature precedes autoimmunity in children genetically at risk for type 1 diabetes. Diabetes. (2014) 63:2538–50. 10.2337/db13-1777 - DOI - PMC - PubMed

Publication types

MeSH terms