. 2020 Mar 20:8:220.
doi: 10.3389/fbioe.2020.00220. eCollection 2020.

Comparative Study of Transcriptomics-Based Scoring Metrics for the Epithelial-Hybrid-Mesenchymal Spectrum

Affiliations

Comparative Study of Transcriptomics-Based Scoring Metrics for the Epithelial-Hybrid-Mesenchymal Spectrum

Priyanka Chakraborty et al. Front Bioeng Biotechnol. .

Abstract

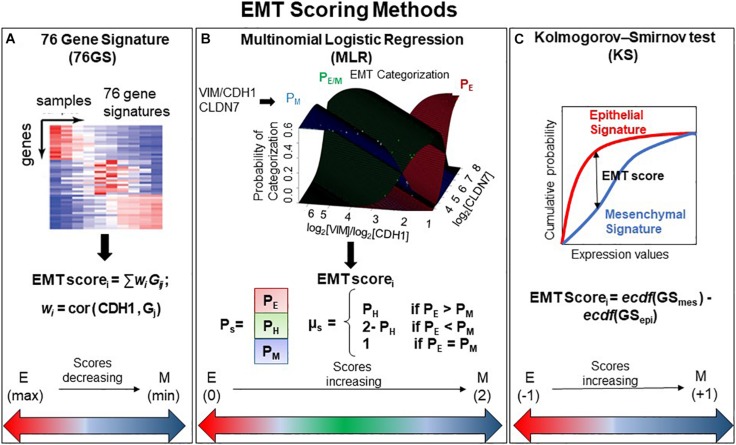
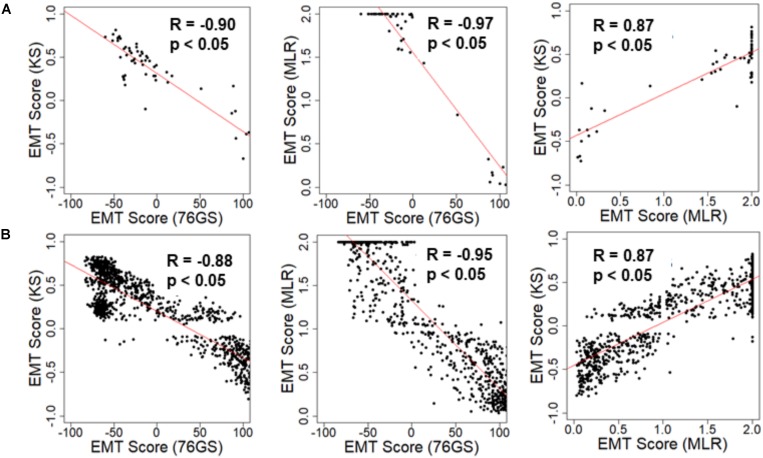
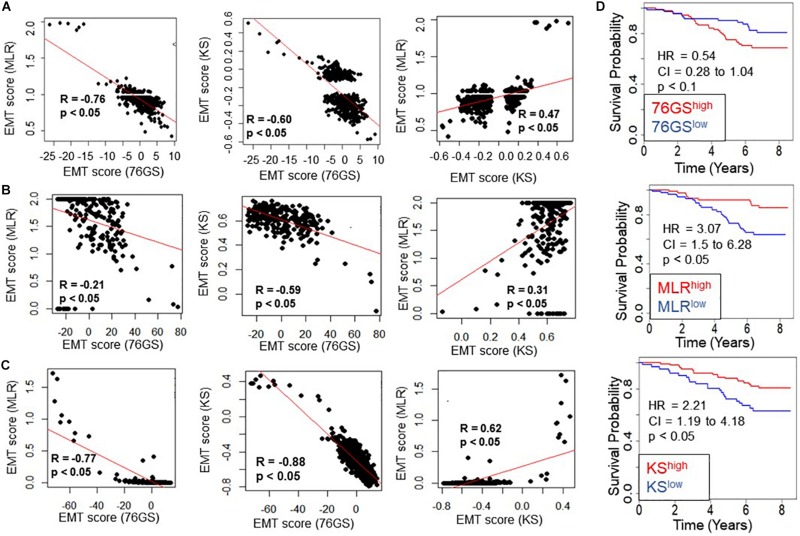
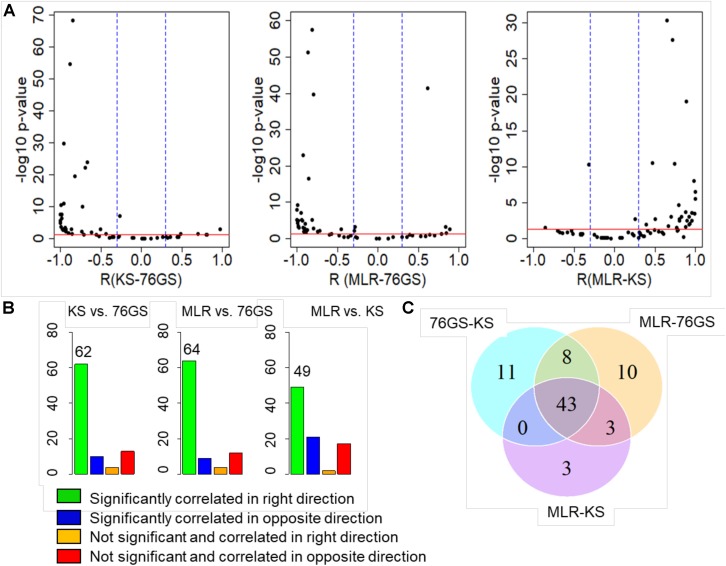
The Epithelial-mesenchymal transition (EMT) is a cellular process implicated in embryonic development, wound healing, and pathological conditions such as cancer metastasis and fibrosis. Cancer cells undergoing EMT exhibit enhanced aggressive behavior characterized by drug resistance, tumor-initiation potential, and the ability to evade the immune system. Recent in silico, in vitro, and in vivo evidence indicates that EMT is not an all-or-none process; instead, cells can stably acquire one or more hybrid epithelial/mesenchymal (E/M) phenotypes which often can be more aggressive than purely E or M cell populations. Thus, the EMT status of cancer cells can prove to be a critical estimate of patient prognosis. Recent attempts have employed different transcriptomics signatures to quantify EMT status in cell lines and patient tumors. However, a comprehensive comparison of these methods, including their accuracy in identifying cells in the hybrid E/M phenotype(s), is lacking. Here, we compare three distinct metrics that score EMT on a continuum, based on the transcriptomics signature of individual samples. Our results demonstrate that these methods exhibit good concordance among themselves in quantifying the extent of EMT in a given sample. Moreover, scoring EMT using any of the three methods discerned that cells can undergo varying extents of EMT across tumor types. Separately, our analysis also identified tumor types with maximum variability in terms of EMT and associated an enrichment of hybrid E/M signatures in these samples. Moreover, we also found that the multinomial logistic regression (MLR)-based metric was capable of distinguishing between "pure" individual hybrid E/M vs. mixtures of E and M cells. Our results, thus, suggest that while any of the three methods can indicate a generic trend in the EMT status of a given cell, the MLR method has two additional advantages: (a) it uses a small number of predictors to calculate the EMT score and (b) it can predict from the transcriptomic signature of a population whether it is comprised of "pure" hybrid E/M cells at the single-cell level or is instead an ensemble of E and M cell subpopulations.

Keywords: EMT; EMT quantification; EMT score; MET; hybrid epithelial/mesenchymal; tumor heterogeneity.


Figures

FIGURE 1
FIGURE 1
General outline of all three EMT scoring methods. (A) 76GS score is calculated by weighted sum of 76 genes, where EMT scorei is score for ith sample, wj is correlation of jth gene (Gj) with CDH1 gene in that dataset to which the sample i belongs, Gij is the jth gene’s normalized expression in ith sample. (B) MLR utilizes log2(VIM)/log2(CDH1) and log2(CLDN7) space to predict categorization of a sample into E, E/M, or M category. Where PE, PH, and PM are the probabilities of a sample falling into each phenotype. EMT scorei is the score for ith sample, which is defined in relation to PE, PH, and PM. Figure adapted from George et al. (2017) with permission. (C) KS score is estimated by the empirical cumulative distributions of epithelial and mesenchymal gene set, denoted by ecdf (GSmes) and ecdf (GSepi), respectively. EMT scorei is the maximum vertical distance between the ecdf (GSmes) and ecdf (GSepi) (given by Eq. 1 in the section “Materials and Methods”) for a given sample i.
FIGURE 2
FIGURE 2
Scatter plot depicting the correlation between the EMT scores of cancer cell line samples calculated via three methods. Each pairwise relation is estimated by a linear regression line (red), Pearson’s correlation coefficient (R), and p-value (p) reported in each plot. (A) NCI60 dataset and (B) CCLE dataset.
FIGURE 3
FIGURE 3
Concordance across all three EMT scoring methods in quantification of EMT and survival prediction of tumor patients. Each pairwise relation is estimated by linear regression (red), Pearson’s correlation coefficient (R), and p-value (p), reported in each plot. (A) TCGA ovarian cancer dataset, (B) TCGA sarcoma dataset, (C) TCGA breast cancer dataset. (D) Correlation between EMT score (high vs. low) and overall survival (OS) in breast cancer patients. Kaplan–Meier survival analysis is performed to estimate differences in survival of 76GShigh, MLRhigh, KShigh and 76GSlow, MLRlow, KSlow groups, respectively, in GSE1456. p-values (p) reported are based on the log rank test. HR (hazard ratio) and confidence interval (95% CI) reported are estimated using cox regression.
FIGURE 4
FIGURE 4
Plots depicting pairwise comparisons of all three EMT scores. (A) Volcano plots showing the correlation of different EMT scoring methods across 85 different GEO microarray datasets along with the p-values for the respective correlation coefficient values. In each case, –log10(p-value) is plotted as a function of Pearson’s correlation coefficient. Thresholds for correlation (R < –0.3 or R > 0.3; vertical blue lines) and p-values (p < 0.05; horizontal red line) are denoted. (B) Bar plots for different categories based on the correlation sign and statistical significance of all three pairwise comparisons across 85 datasets. p < 0.05 and R < −0.3 or R > 0.3. (C) Venn diagram showing the common GEO datasets across all pairwise comparisons that are significantly correlated in the expected direction.
FIGURE 5
FIGURE 5
Bar plots showing EMT scores of different cell lines calculated using the three EMT scoring methods. (A) EMT induction is shown in three cell lines – A549, HCC87, and NCIH358 (GSE49664). (B) EMT induction in MCF7 cell line (GSE58252). (C) EMT induction in EpRas cells (GSE59922). (D) EMT induction by different EMT-inducing transcription factors. “a” denotes statistical significant difference (p < 0.05, n = 3, two-tailed Student’s t-test) for pairwise comparison of a given set with untreated (first column), “b” denotes the same when compared with empty vector (EV; second column) (GSE43495). (E) MET induction by GRHL2 in MDA-MB-231 cell line (GSE36081). (F) Two cell lines of hepatocellular carcinoma with varying EMT status (GSE26391). Each control case has been compared to EMT/MET induced case (*p < 0.05, n = 3, two-tailed Student’s t-test; error bars represent standard deviation).
FIGURE 6
FIGURE 6
Variance and mean of EMT scores in CCLE samples grouped by tumor subtype, highlighting the most variable tumor types (circled). (A) 76GS EMT scores, (B) MLR EMT scores, and (C) KS EMT scores. (D) Venn diagram showing the overlap between each tumor type based on the abundance of hybrid samples as defined by the MLR method, where #EM > 10 denote the cases where the absolute number of hybrid E/M samples in a tumor subtype is >10; %EM > 20 denote the cases where the percentage of cell lines identified as hybrid E/M in a given tumor subtype is >20%.
FIGURE 7
FIGURE 7
Distinguishing between hybrid E/M cells vs. mixtures of E and M cells. (A) Scatter plot showing CCLE cell lines that display a hybrid E/M phenotype (red) on the mixture curve (dotted curve) determined by the mean of 35 pure E (orange) and pure M (blue) reference samples in CCLE dataset. (B) Scatter plot showing the 100 farthest (purple) and 100 closest (green) samples based on the distance from the mixture curve. (C) Bar plots showing EMT scores of N (10, 20, 50, and 100) closest and farthest hybrid E/M samples from mixture curve. (D) Mesenchymal proportion (%M) distribution of the 100 closest and farthest hybrid samples from mixture curve. *p < 0.05, N = 10, 20, 50 and 100, two-tailed Student’s t-test; error bars represent standard deviation.

References

    1. Aiello N. M., Maddipati R., Norgard R. J., Balli D., Li J., Yuan S., et al. (2018). EMT subtype influences epithelial plasticity and mode of cell migration. Dev. Cell 45 681.e4–695.e4. 10.1016/J.DEVCEL.2018.05.027 - DOI - PMC - PubMed
    1. Andriani F., Bertolini G., Facchinetti F., Baldoli E., Moro M., Casalini P., et al. (2016). Conversion to stem-cell state in response to microenvironmental cues is regulated by balance between epithelial and mesenchymal features in lung cancer cells. Mol. Oncol. 10 253–271. 10.1016/j.molonc.2015.10.002 - DOI - PMC - PubMed
    1. Armstrong A. J., Marengo M. S., Oltean S., Kemeny G., Bitting R. L., Turnbull J. D., et al. (2011). Circulating tumor cells from patients with advanced prostate and breast cancer display both epithelial and mesenchymal markers. Mol. Cancer Res. 9 997–1007. 10.1158/1541-7786.MCR-10-0490 - DOI - PMC - PubMed
    1. Barretina J., Caponigro G., Stransky N., Venkatesan K., Margolin A. A., Kim S., et al. (2012). The Cancer Cell Line Encyclopedia enables predictive modelling of anticancer drug sensitivity. Nature 483 603–607. 10.1038/nature11003 - DOI - PMC - PubMed
    1. Biddle A., Gammon L., Liang X., Costea D. E., Mackenzie I. C. (2016). Phenotypic plasticity determines cancer stem cell therapeutic resistance in oral squamous cell carcinoma. EBioMedicine 4 138–145. 10.1016/j.ebiom.2016.01.007 - DOI - PMC - PubMed