Review
. 2020 Dec 1;41(6):775-820.
doi: 10.1210/endrev/bnaa008.

Adrenal Incidentaloma

Affiliations
Review

Adrenal Incidentaloma

Mark Sherlock et al. Endocr Rev. .

Abstract

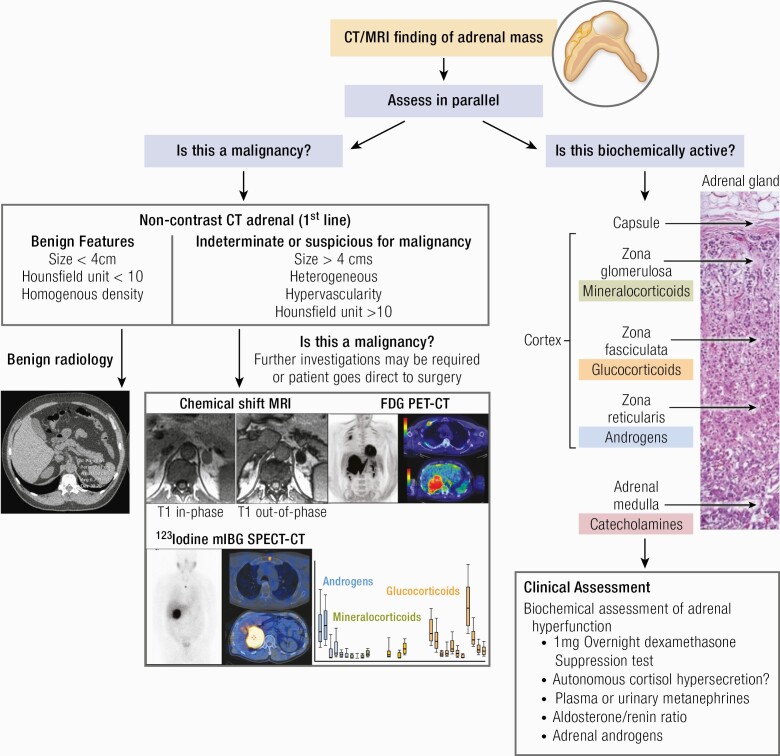
An adrenal incidentaloma is now established as a common endocrine diagnosis that requires a multidisciplinary approach for effective management. The majority of patients can be reassured and discharged, but a personalized approach based upon image analysis, endocrine workup, and clinical symptoms and signs are required in every case. Adrenocortical carcinoma remains a real concern but is restricted to <2% of all cases. Functional adrenal incidentaloma lesions are commoner (but still probably <10% of total) and the greatest challenge remains the diagnosis and optimum management of autonomous cortisol secretion. Modern-day surgery has improved outcomes and novel radiological and urinary biomarkers will improve early detection and patient stratification in future years to come.

Keywords: adrenal adenoma; adrenal computed tomography; adrenal cortical carcinoma; adrenal incidentaloma; autonomous cortisol secretion.


Figures

Graphical Abstract
Graphical Abstract
Figure 1.
Figure 1.
Schematic diagram of the structure of the human adrenal cortex (92). Adapted from PM Stewart, Chapter 14 The Adrenal Cortex. In Williams Textbook of Endocrinology, 10th ed. , Copyright © 2003 Elsevier Reproduced from Williams RH, Larsen PR. Williams Textbook of Endocrinology. 10th ed./ P. Reed Larsen….[et al.] ed. United States: Philadelphia : Saunders, ©2003. Copyright © 2003 Elsevier.
Figure 2.
Figure 2.
Anatomy of the adrenal gland. (i) Eustachio’s original drawing from Tabulae anatomicae published by Johannes Maria Lancisi in 1714 (99). (ii) The left adrenal–renal venous complex. The right adrenal vein (AV) drains directly into the IVC (100).
Figure 3.
Figure 3.
Adrenal steroidogenesis. After the steroidogenic acute regulatory (StAR) protein-mediated uptake of cholesterol into mitochondria within adrenocortical cells, aldosterone, cortisol, and adrenal androgens are synthesized through the coordinated action of a series of steroidogenic enzymes in a zone-specific fashion. A'dione, androstenedione; DHEA, dehydroepiandrosterone; DOC, deoxycorticosterone. PM Stewart, Chapter 14 The Adrenal Cortex. In Williams Textbook of Endocrinology, 10th ed. , Copyright © 2003 Elsevier Reproduced from van Berkel A, Lenders JW, Timmers HJ. Diagnosis of endocrine disease: Biochemical diagnosis of phaeochromocytoma and paraganglioma. Eur J Endocrinol 2014; 170:R109-119.
Figure 4.
Figure 4.
Biosynthesis of catecholamines in (A) chromaffin cells of adrenal medulla and (B) sympathetic nerve cells. TH, tyrosine hydroxylase; L-AADC, aromatic L-amino-acid decarboxylase; DBH, dopamine- β -hydroxylase; PNMT, phenylethanolamine-N-methyltransferase (108). Reproduced from van Berkel A, Lenders JW, Timmers HJ. Diagnosis of endocrine disease: Biochemical diagnosis of phaeochromocytoma and paraganglioma. Eur J Endocrinol 2014; 170:R109-119.
Figure 5.
Figure 5.
Metabolism of catecholamines. ADH, alcohol dehydrogenase; MAO, monoamine oxidase; COMT, catechol-O-methyltransferase; SULT1A3, sulfotransferase 1 A3. Adrenaline, epinephrine; noradrenaline, norepinephrine. (108). Reproduced from van Berkel A, Lenders JW, Timmers HJ. Diagnosis of endocrine disease: Biochemical diagnosis of phaeochromocytoma and paraganglioma. Eur J Endocrinol 2014; 170:R109-119.
Figure 6.
Figure 6.
Characterization of AI by CT. Axial images obtained pre and post-IV contrast at the portal-venous (60-70 seconds) and delayed (10-15 minutes) phases post injection. Calculation of adrenal lesion attenuation value showing benign pattern washout in a lipid-rich left adrenal adenoma.
Figure 7.
Figure 7.
Chemical shift MRI. Paired axial T1-weighted MRI images showing loss of signal within a left adrenal nodule on out-of-phase imaging consistent with lipid-content within a lipid-rich adrenal adenoma.
Figure 8.
Figure 8.
18F-fluorodeoxyglucose PET-CT. Coronal PET maximum intensity projection and axial fused PET-CT images in a patient with a locally advanced right adrenocortical carcinoma and an unsuspected tracer-avid right-sided rib metastasis.
Figure 9.
Figure 9.
(A) Schematic representation of steroidogenesis depicting the major products of adrenocortical steroid synthesis, the mineralocorticoid aldosterone (dark green), and its precursors (light green), glucocorticoid precursors (yellow), the active glucocorticoid cortisol (orange) and its metabolite cortisone, and the adrenal androgens and their precursors (light blue). Synthesis of active androgens (dark blue) mainly takes place in the gonads. (B0. The 24-hour urinary steroid metabolite excretion in healthy controls (n=88). Box plots represent median and interquartile ranges; the whiskers represent 5th and 95th percentile, respectively. Color coding of steroid metabolites mirrors that used for depicting the major adrenal corticosteroid classes in (A). CYP, cytochrome P450; HSD, hydroxysteroid dehydrogenase; DHT, 5 α -dihydrotestosterone (342). From Arlt W, Biehl M, Taylor AE, Hahner S, Libe R, Hughes BA, Schneider P, Smith DJ, Stiekema H, Krone N, Porfiri E, Opocher G, Bertherat J, Mantero F, Allolio B, Terzolo M, Nightingale P, Shackleton CH, Bertagna X, Fassnacht M, Stewart PM. Urine steroid metabolomics as a biomarker tool for detecting malignancy in adrenal tumors. J Clin Endocrinol Metab 2011; 96:3775-3784 (Under Open Access License).
Figure 10.
Figure 10.
Steroid metabolite excretion in ACA (n = 102) and ACC (n = 45) according to steroid classes. (A) Metabolites of adrenal androgen precursors and active androgens; (B) metabolites of mineralocorticoids and their precursors; (C) metabolites of glucocorticoid precursors; (D) cortisol and cortisone metabolites. Box plots represent median and interquartile ranges; the whiskers represent 5th and 95th percentile, respectively.*P < .05; **P < .01; ***P < .001 comparing ACA with ACC. (342) From Arlt W, Biehl M, Taylor AE, Hahner S, Libe R, Hughes BA, Schneider P, Smith DJ, Stiekema H, Krone N, Porfiri E, Opocher G, Bertherat J, Mantero F, Allolio B, Terzolo M, Nightingale P, Shackleton CH, Bertagna X, Fassnacht M, Stewart PM. Urine steroid metabolomics as a biomarker tool for detecting malignancy in adrenal tumors. J Clin Endocrinol Metab 2011; 96:3775-3784 (Under Open Access License).
Figure 11.
Figure 11.
Carbon-11 metomidate PET-CT: Coronal PET maximum intensity projection and axial fused PET-CT images in a patient with a left adrenocortical carcinoma and an unsuspected tracer-avid right sided liver metastasis. Prominent physiological tracer uptake is present in the gastric wall and left renal collecting system. Images courtesy of Professor Anders Sundin, Consultant Radiologist, Uppsala University Hospital, Sweden.
Figure 12.
Figure 12.
Iodine-123 metaiodobenzylguanidine SPECT-CT. Anterior half-body planar view and axial fused SPECT-CT images in a patient with a large MIBG-avid right adrenal pheochromocytoma with an unsuspected tracer-avid bone metastasis within the manubrium.
Figure 13.
Figure 13.
Carbon-11 hydroxyephedrine PET-CT. Coronal PET maximum intensity projection and axial fused PET-CT images in a patient with a left adrenal pheochromocytoma and an unsuspected tracer-avid subcentimeter right paratracheal node which was biopsied and confirmed to represent a nodal metastasis. Images courtesy of Professor Anders Sundin, Consultant Radiologist, Uppsala University Hospital, Sweden.
Figure 14.
Figure 14.
CT textural analysis. Axial CT image showing left adrenal lesion segmentation (blue contours, top left) and adrenal lesion textural features displayed using fine (top right), medium (bottom left) and coarse (bottom right) filters using TexRADTM software. First-order textural parameters extracted from the lesion are tabulated below. SSF, spacial scaling factor; SD, standard deviation; MPP, mean of positive pixels.

References

    1. Papanicolas I, Woskie LR, Jha AK. Health care spending in the united states and other high-income countries. JAMA. 2018;319(10):1024-1039. - PubMed
    1. Smith-Bindman R, Miglioretti DL, Johnson E, et al. Use of diagnostic imaging studies and associated radiation exposure for patients enrolled in large integrated health care systems, 1996-2010. JAMA. 2012;307(22):2400-2409. - PMC - PubMed
    1. Operational Information for Commissioning NE . Diagnostic Imaging Dataset Statistical Release: Provisional monthly statistics, November 2017 to November 2018. 2019.. https://www.england.nhs.uk/statistics/wp-content/uploads/sites/2/2019/12....
    1. Fassnacht M, Arlt W, Bancos I, et al. Management of adrenal incidentalomas: European Society of Endocrinology Clinical Practice Guideline in collaboration with the European Network for the Study of Adrenal Tumors. Eur J Endocrinol. 2016;175(2):G1-G34. - PubMed
    1. Geelhoed GW, Druy EM. Management of the adrenal “incidentaloma”. Surgery. 1982;92(5):866-874. - PubMed

Publication types

MeSH terms

Supplementary concepts