. 2020 Apr 7;10(1):39.
doi: 10.1186/s13613-020-00654-y.

Occurrence of pendelluft under pressure support ventilation in patients who failed a spontaneous breathing trial: an observational study

Affiliations

Occurrence of pendelluft under pressure support ventilation in patients who failed a spontaneous breathing trial: an observational study

Andrea Coppadoro et al. Ann Intensive Care. .

Abstract

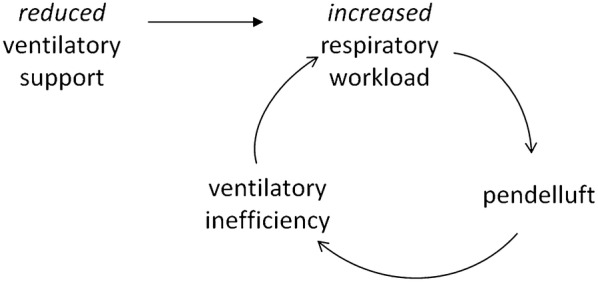
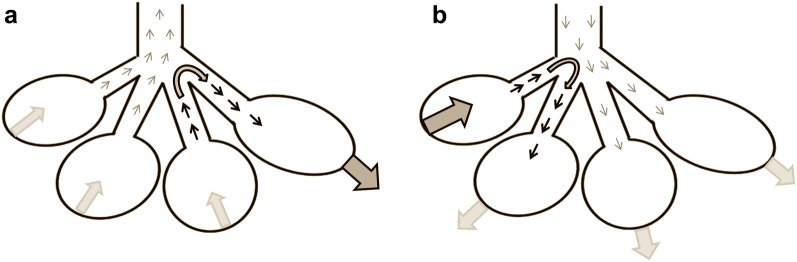
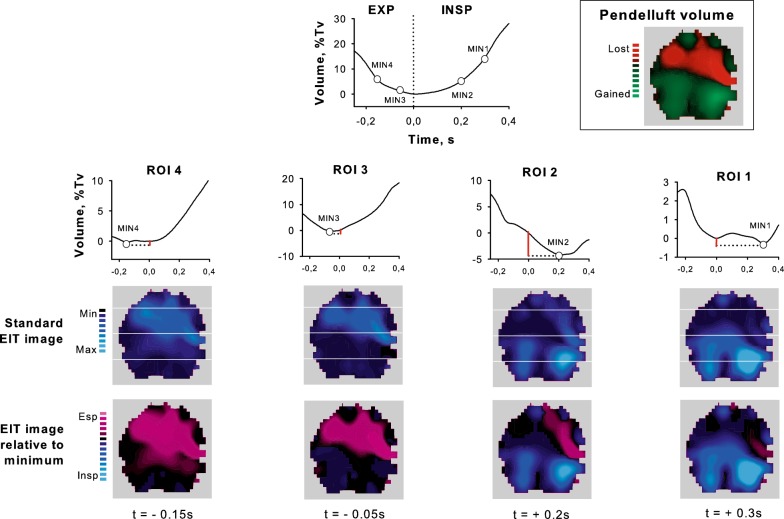
Background: Pendelluft, the movement of gas within different lung regions, is present in animal models of assisted mechanical ventilation and associated with lung overstretching. Due to rebreathing of CO2 as compared to fresh gas, pendelluft might reduce ventilatory efficiency possibly exacerbating patient's respiratory workload during weaning. Our aim was to measure pendelluft by electrical impedance tomography (EIT) in patients who failed a spontaneous breathing trial (SBT).

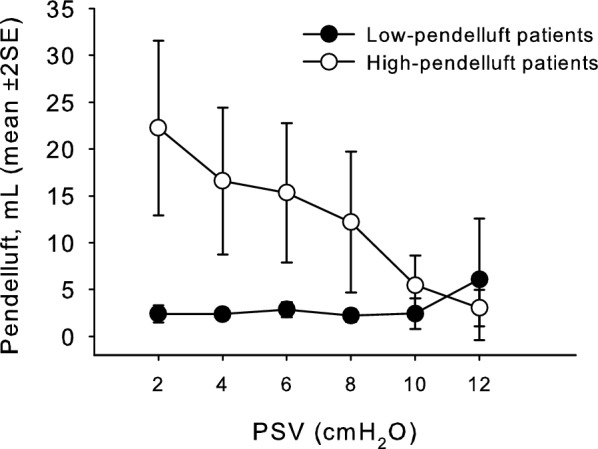
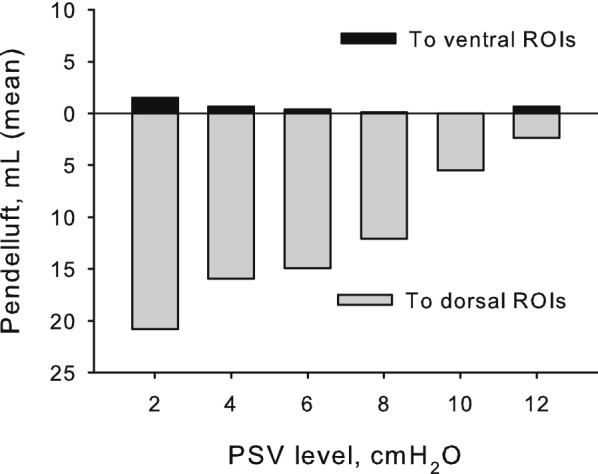
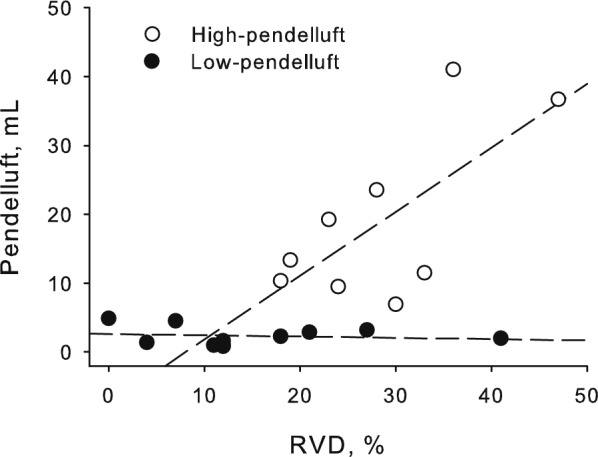
Methods: This is an observational study conducted in a general intensive care unit of a tertiary-level teaching hospital. EIT signal was recorded in 20 patients while pressure support (PS) ventilation was progressively reduced from clinical level (baseline) to 2 cmH2O, as in an SBT; four ventral-to-dorsal lung regions of interest were identified for pendelluft measurement. A regional gas movement (> 6 mL) occurring in a direction opposite to the global EIT signal was considered diagnostic for high pendelluft.

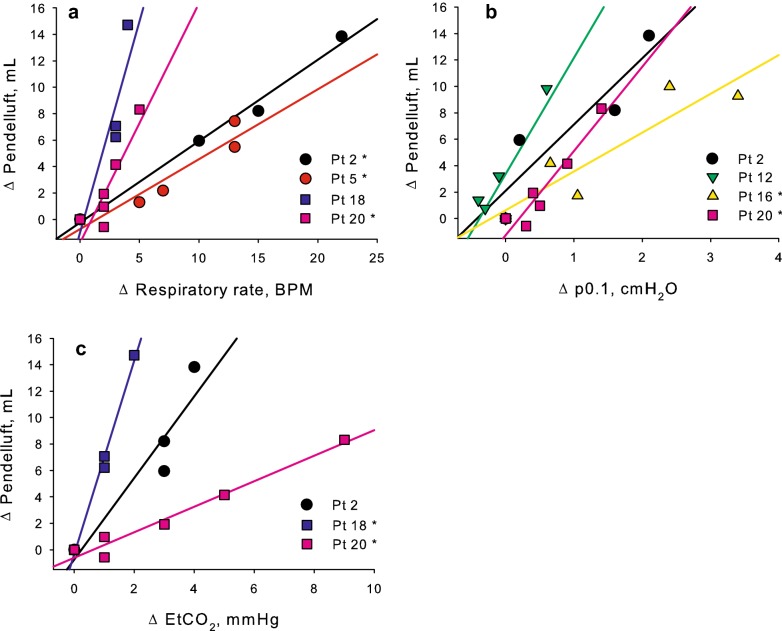
Results: Eight patients out of 20 (40%) were classified as high-pendelluft; baseline clinical characteristics did not differ between high- and low-pendelluft patients. At PS reduction, pendelluft and EtCO2 increased more in the high-pendelluft group (p < .001 and .011, respectively). The volume of gas subject to pendelluft moved almost completely from the ventral towards the dorsal lung regions, while the opposite movement was minimal (16.3 [10:32.8] vs. 0 [0:1.8] mL, p = .001). In a subgroup of patients, increased pendelluft volumes positively correlated with markers of respiratory distress such as increased respiratory rate, p0.1, and EtCO2.

Conclusions: Occult pendelluft can be measured by EIT, and is frequently present in patients failing an SBT. When present, pendelluft increases with the reduction of ventilator support and is associated with increased EtCO2, suggesting a reduction of the ability to eliminate CO2.

Keywords: Assisted mechanical ventilation; Difficult ventilator weaning; Electrical impedance tomography; Pendelluft; Spontaneous assisted breathing; Spontaneous breathing trial.


Conflict of interest statement

GB, AB and GF received lecturing fees from Draeger Medical.

Figures

Fig. 1
Fig. 1
Vicious cycle due to pendelluft during the weaning phase. Illustration of the vicious cycle related with reduction of ventilator support in patients affected by the presence of pendelluft
Fig. 2
Fig. 2
Schematic representation of the pendelluft phenomenon occurring during assisted mechanical ventilation. Pendelluft (black arrows) was defined as the sum of the gas moving into early-inflating regions of interest during expiration (before the global electrical impedance tomography value reached its minimum value, T0 in the text, panel a) and the gas lost by late-deflating regions of interest during inspiration (after T0, panel b)
Fig. 3
Fig. 3
Pendelluft volumes at the reduction of ventilator support. Mean pendelluft volume remained low at the reduction of pressure support ventilation (PSV) level in the low-pendelluft group (filled circles), while increased in the high-pendelluft group (empty circles)
Fig. 4
Fig. 4
Pendelluft gas movement direction in the high-pendelluft group. In the high-pendelluft group, the movement of gas subject to pendelluft was almost entirely directed towards the dorsal regions of interest, while the amount directed towards the ventral ones was minimal (PSV, pressure support ventilation)
Fig. 5
Fig. 5
Pendelluft measurement and distribution in patient of the high-pendelluft group (single breath, unfiltered signal) due to early inflation of the dorsal regions and late deflation of the ventral ones. Minimum impedance values of the dorsal regions of interest (ROI 3 and 4) occurred during expiration (EXP), while in the ventral ones (ROI 1 and 2) occurred during inspiration (INSP). Total pendelluft volume was calculated as the sum of the volumes (red bars) inflated during expiration (ROI 3 and 4) and deflated during inspiration (ROI 1 and 2). Processed EIT imaging (relative to minimum) indicated that inspiration in the dorsal ROIs started when ventral ones were still expiring (expiration in purple color); the phenomenon was not immediately evident with standard EIT imaging. Pendelluft gas moved from the ventral towards the dorsal lung regions (boxed image)
Fig. 6
Fig. 6
Association between pendelluft volume change during the study and markers of increased inspiratory effort in exemplary patients of the high-pendelluft group. In some patients of the high-pendelluft group, pendelluft volume increase from baseline was associated with markers of increased inspiratory effort such as increased respiratory rate (panel a) or increased mouth occlusion pressure at 100 ms (p0.1, panel b), or ventilatory inefficiency such as increased end-tidal carbon dioxide (EtCO2, panel c). Significant correlations are marked with asterisks (*)
Fig. 7
Fig. 7
Correlation between pendelluft volume and regional ventilation delay. At the lowest pressure support ventilation (PSV) level, pendelluft volume positively correlated with the percentage of lung zones affected by ventilation delay (RVD) in the high-pendelluft group (p = .04, r = .69, empty circles), but not in the low-pendelluft group (p = .65, filled circles). While in the high-pendelluft group a high regional ventilation delay value was associated with the presence of pendelluft, some patients in the low-pendelluft group showed high regional ventilation delay values but low pendelluft volumes

References

    1. Yoshida T, Nakahashi S, Nakamura MAM, Koyama Y, Roldan R, Torsani V, et al. Volume-controlled ventilation does not prevent injurious inflation during spontaneous effort. Am J Respir Crit Care Med. 2017;196:590–601. doi: 10.1164/rccm.201610-1972OC. - DOI - PubMed
    1. Brochard L, Slutsky A, Pesenti A. Mechanical ventilation to minimize progression of lung injury in acute respiratory failure. Am J Respir Crit Care Med. 2017;195:438–442. doi: 10.1164/rccm.201605-1081CP. - DOI - PubMed
    1. Bellani G, Pesenti A. Assessing effort and work of breathing. Curr Opin Crit Care. 2014;20:352–358. doi: 10.1097/MCC.0000000000000089. - DOI - PubMed
    1. Greenblatt EE, Butler JP, Venegas JG, Winkler T. Pendelluft in the bronchial tree. J Appl Physiol. 1985;2014(117):979–988. - PMC - PubMed
    1. Lumb A. Nunn’s Applied Respiratory Physiology. Amsterdam: Elsevier; 2016. Causes of time dependence of pulmonary elastic behaviour; p. 24.