

Correlating nuclear morphology and external force with combined atomic force microscopy and light sheet imaging separates roles of chromatin and lamin A/C in nuclear mechanics
- PMID: 32267206
- PMCID: PMC7521857
- DOI: 10.1091/mbc.E20-01-0073
Correlating nuclear morphology and external force with combined atomic force microscopy and light sheet imaging separates roles of chromatin and lamin A/C in nuclear mechanics
Abstract
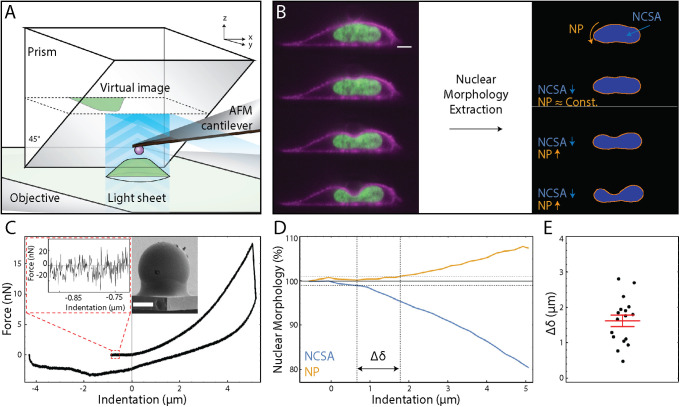
Nuclei are often under external stress, be it during migration through tight constrictions or compressive pressure by the actin cap, and the mechanical properties of nuclei govern their subsequent deformations. Both altered mechanical properties of nuclei and abnormal nuclear morphologies are hallmarks of a variety of disease states. Little work, however, has been done to link specific changes in nuclear shape to external forces. Here, we utilize a combined atomic force microscope and light sheet microscope to show SKOV3 nuclei exhibit a two-regime force response that correlates with changes in nuclear volume and surface area, allowing us to develop an empirical model of nuclear deformation. Our technique further decouples the roles of chromatin and lamin A/C in compression, showing they separately resist changes in nuclear volume and surface area, respectively; this insight was not previously accessible by Hertzian analysis. A two-material finite element model supports our conclusions. We also observed that chromatin decompaction leads to lower nuclear curvature under compression, which is important for maintaining nuclear compartmentalization and function. The demonstrated link between specific types of nuclear morphological change and applied force will allow researchers to better understand the stress on nuclei throughout various biological processes.
Figures
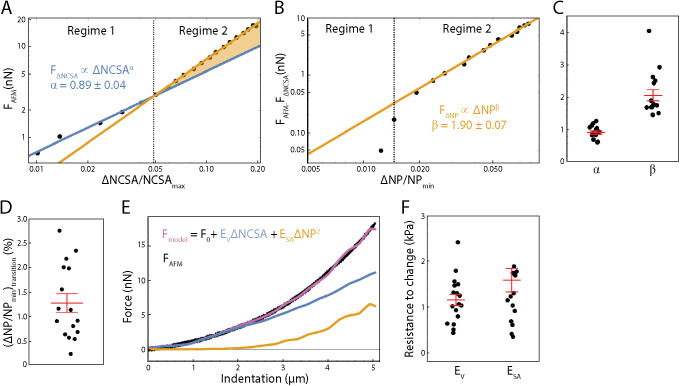
 , and β, the exponent for
  , as determined for n = 16 cells. Red bars represent mean and SEM. (D) The strain in NP at the transition point between regime 1 and regime 2 as determined for n = 16 cells. Red bars represent mean and SEM. (E) An emperical model for nuclear deformation as shown over force vs. indentation. We display our full emperical model (magenta), the individual contributions required to deform the nuclear volume and surface area (blue and orange, respectively), and the AFM data over the full indentaiton. (F) Resistance to nuclear volume change,
  , and resistance to nuclear surface area change,
  , as determined for n = 17 cells. Red bars represent mean and SEM.
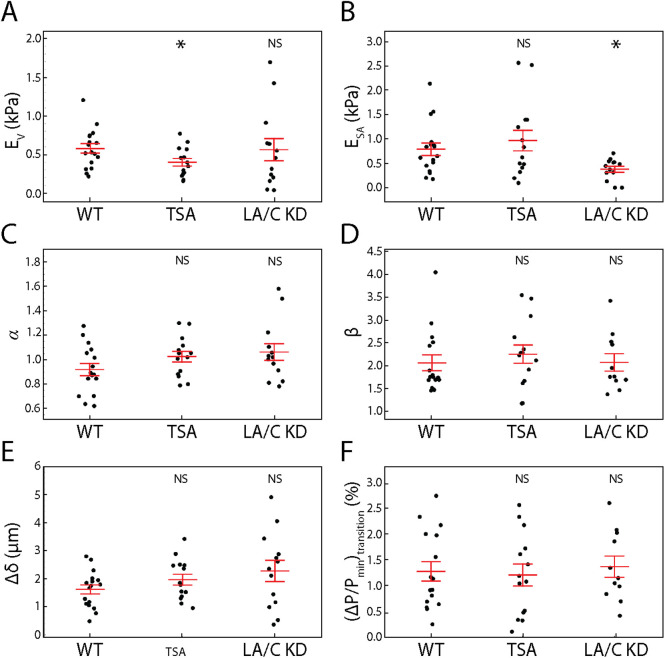
 , is decreased by TSA but unchanged by LA/C KD. n = 17, 14, and 13 for WT, TSA, and LA/C KD, respectively. (B) Resistance to nuclear surface area change,
  , is unchanged by TSA but decreased by LA/C KD. n = 17, 14, and 13 for WT, TSA, and LA/C KD, respectively. (C) α, the exponent for
  , is unchanged by TSA and LA/C KD. n = 16, 14, and 13 for WT, TSA, and LA/C KD, respectively. (D) β, the exponent for
  , is unchanged by TSA and LA/C KD. n = 16, 14, and 11 for WT, TSA, and LA/C KD, respectively. (E) The difference in indentation at the onset of change in NP and NCSA is unchanged by TSA and LA/C KD. n = 17, 14, and 13 for WT, TSA, and LA/C KD, respectively. (F) The strain in NP at the transition point between regime 1 and regime 2 is unchanged by TSA and LA/C KD. n = 16, 14, and 11 for WT, TSA, and LA/C KD, respectively. Red bars represent mean and SEM. NS, not significant. *, p < 0.05.
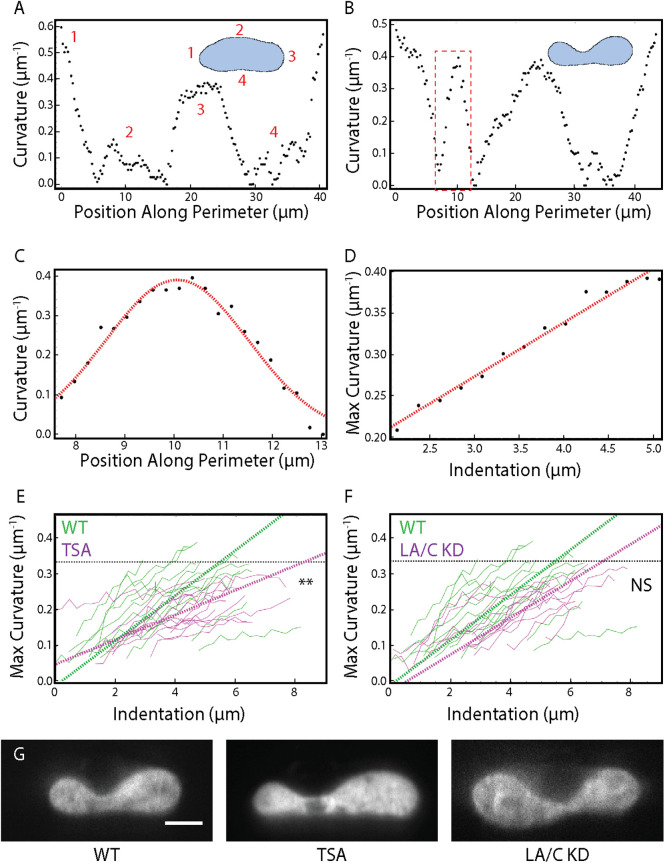
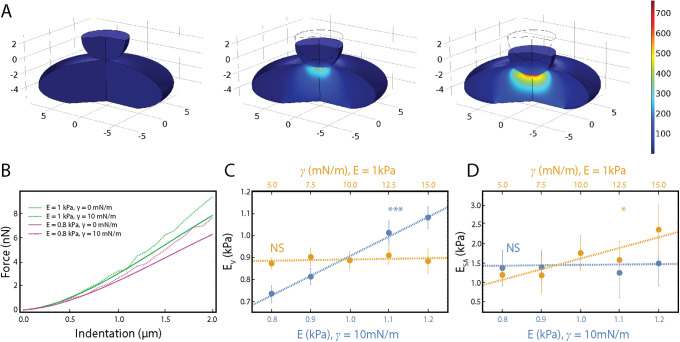
 , plotted against variations in both E and γ. A significant correlation (p < 0.001) is seen between
  and E, but no significant correlation is seen between
  and E. (D). Resistance to nuclear surface area change, ESA, plotted against variations in both E and γ. A significant correlation (p < 0.05) between
  and γ is seen, but no significant correlation is seen between
  and E.
Comment in
-
Editorial introduction.Mol Biol Cell. 2020 Jul 21;31(16):1651-1653. doi: 10.1091/mbc.E20-06-0414. Mol Biol Cell. 2020. PMID: 32692641 Free PMC article.
-
Caveats on modeling of nuclear biomechanics.Mol Biol Cell. 2020 Oct 15;31(22):2421-2422. doi: 10.1091/mbc.E20-05-0281. Mol Biol Cell. 2020. PMID: 33054638 Free PMC article. No abstract available.
References
Publication types
MeSH terms
Substances
Grants and funding
LinkOut - more resources
Full Text Sources
Research Materials
Miscellaneous
