. 2020 May 26;14(5):5711-5727.
doi: 10.1021/acsnano.0c00326. Epub 2020 Apr 20.

Big Is Beautiful: Enhanced saRNA Delivery and Immunogenicity by a Higher Molecular Weight, Bioreducible, Cationic Polymer

Affiliations

Big Is Beautiful: Enhanced saRNA Delivery and Immunogenicity by a Higher Molecular Weight, Bioreducible, Cationic Polymer

Anna K Blakney et al. ACS Nano. .

Abstract

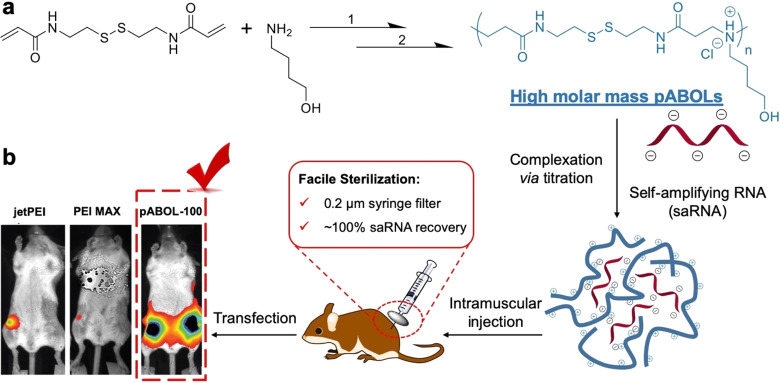
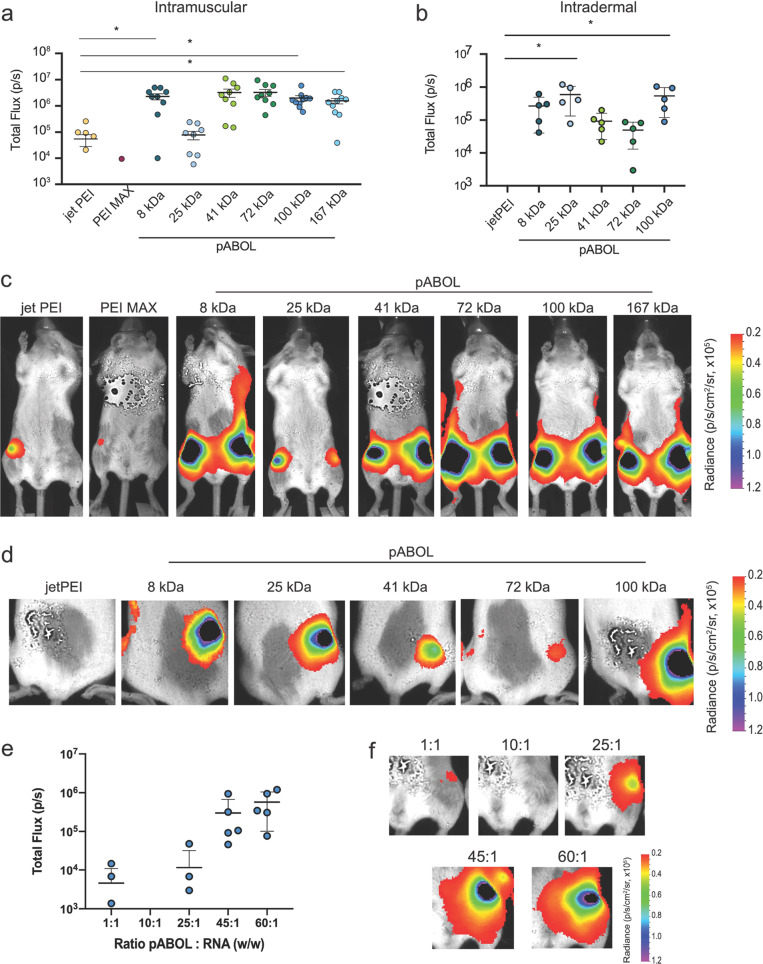
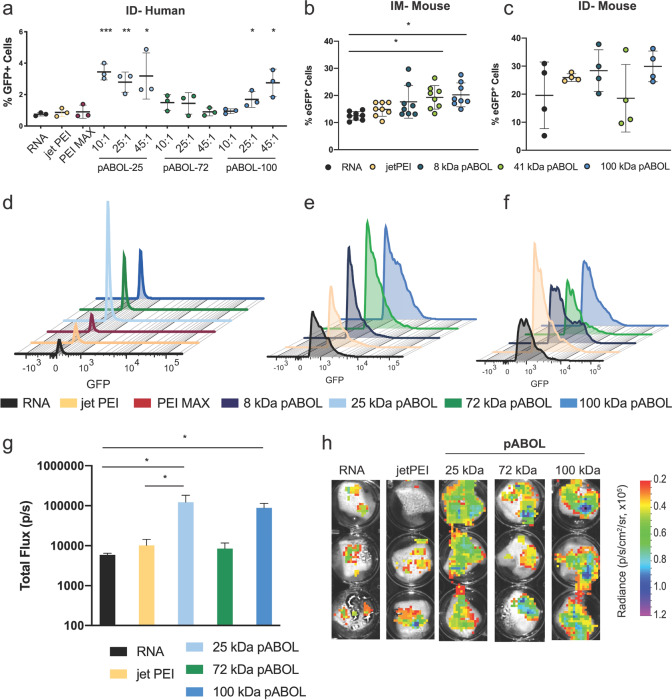
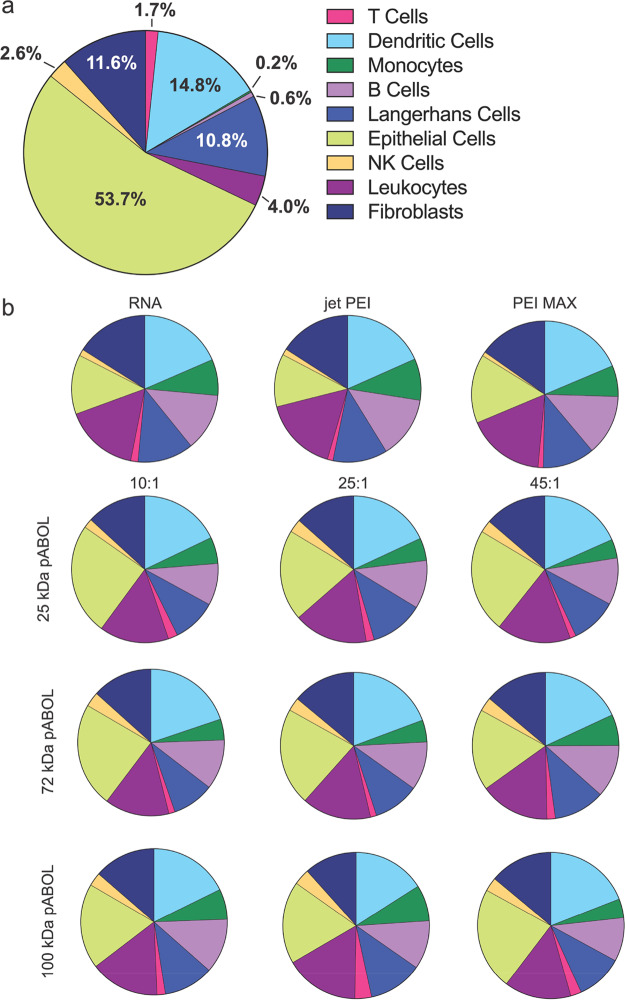
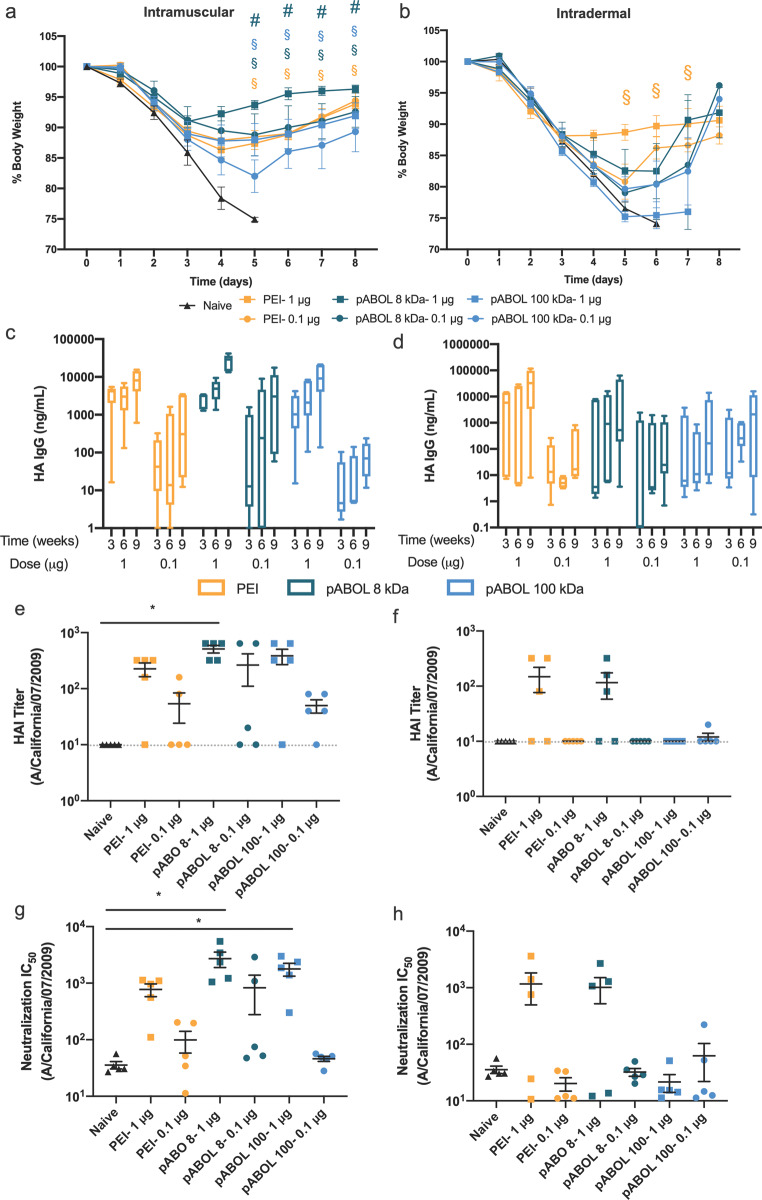
Self-amplifying RNA (saRNA) vaccines are highly advantageous, as they result in enhanced protein expression compared to mRNA (mRNA), thus minimizing the required dose. However, previous delivery strategies were optimized for siRNA or mRNA and do not necessarily deliver saRNA efficiently due to structural differences of these RNAs, thus motivating the development of saRNA delivery platforms. Here, we engineer a bioreducible, linear, cationic polymer called "pABOL" for saRNA delivery and show that increasing its molecular weight enhances delivery both in vitro and in vivo. We demonstrate that pABOL enhances protein expression and cellular uptake via both intramuscular and intradermal injection compared to commercially available polymers in vivo and that intramuscular injection confers complete protection against influenza challenge. Due to the scalability of polymer synthesis and ease of formulation preparation, we anticipate that this polymer is highly clinically translatable as a delivery vehicle for saRNA for both vaccines and therapeutics.

Keywords: RNA; influenza; nucleic acid; polymer; replicon; vaccine.


Conflict of interest statement

The authors declare the following competing financial interest(s): A.K.B., Y.Z., R.J.S., and M.M.S. are co-inventors on a patent resulting from this work.

Figures

Scheme 1
Scheme 1. Schematic illustration of (a) improved aza-Michael addition to afford high molecular weight poly(amido amine)s, pABOLs (see Methods for details of 1 and 2) with molecular weights up to 167 kDa. (b) Complexation with self-amplifying RNA (saRNA) via a titration method and transfection efficacy of the pABOL-100 polyplexes, compared to jetPEI and PEI MAX.
Figure 1
Figure 1
Synthesis of high MW pABOL and characterization of resulting saRNA polyplexes. (a) Polymerization kinetics of ABOL with CBA under different reaction conditions with varying monomer concentration, with and without triethylamine (TEA). The conversion values were calculated from the NMR integrals of double-bond signals at 5.60–6.23 ppm, using the methylene signals at 1.36–1.47 ppm as the internal reference. These methylene signals are assigned to g and h in Figure S2, which remain constant during the polyaddition (see Figure S4 for details). (b and c) Particle diameter and zeta potential of polyplexes formed via the direct mixing method between pABOLs and saRNA at polymer to saRNA weight ratios ranging from 1 to 45. PEI-44 [poly(ethylene imine), linear, 44 kDa] at a weight ratio of 5:1 was used as the reference. Bar represents mean ± SD for n = 3 with the weight ratio of polymer:saRNA indicated above the bars. (d) Typical TEM of polyplexes (pABOL-100/saRNA = 45:1, w/w) stained with 2 wt % uranyl acetate (scale bar: 100 nm; more images in Figure S6).
Figure 2
Figure 2
In vitro transfection efficiency and cytotoxicity of pABOL polyplexes 24 h post-transfection. (a) Quantification of fLuc expression in relative light units (RLU) of polyplexes formed by PEI-44 and pABOLs with saRNA, 24 h after transfection at mass ratios of polymer:saRNA ranging from 1:1 to 45:1 (w/w) for n = 3. (b) Quantification of fLuc expression in RLU of polyplexes formed by all pABOLs in Table 1 at a mass ratio of 45:1 (see Figure S11 for other mass ratios) with n = 3. (c) Cytotoxicity studies of polyplexes formed at mass ratios ranging from 10:1 to 450:1 (saRNA loading = 100 ng), 24 h after initial transfection for n = 3. (d) Quantification of fLuc expression in RLU of polyplexes, using untreated cells (−) and cells (+) treated with glutathione (GSH) inhibitor, buthionine sulphoximine (BSO). Bar/dots represents mean ± SD, n = 3. (e) Confocal microscopy images of PEI and pABOL polyplexes after 1 h. Blue indicates nucleus (Hoescht), yellow indicates cell membrane (wheat germ agglutinin (WGA), Alexa Fluor 555 conjugate), and green indicates polymer (FITC). Scale bars = 20 μm.
Figure 3
Figure 3
Functional characterization of polyplexes prepared using either the direct addition or titration methods in vitro and in vivo. (a) Hydrodynamic diameter (black squares), polydispersity (red circles), and zeta potential (blue triangles) of polyplexes formed via the titration method (adding saRNA to polymer) at various titration flow rates (from 10 to 160 μL min–1), using pABOL-100 (polymer/RNA = 45:1, w/w). Data from the direct mixing method is included for reference. (b) Absorbance curves of polyplexes measured by Nanodrop before (black) and after (red) passing through a 0.2 μm syringe filter (pink curve: absorbance of pABOL-100 in buffer with the same concentration as in the obtained polyplex solution). (c) Hydrodynamic diameter of polyplexes measured by DLS before (black) and after (red) passing through a 0.2 μm syringe filter. (d and e) Quantification of fLuc expression in RLU, using filtered (+) and nonfiltered (−) polyplexes formed via the direct mixing and titration method, respectively. Bar represents mean ± SD, n = 3. (f) Quantification of fLuc expression of filtered or nonfiltered pABOL polyplexes formed by direct addition and titration methods, 7 d after injection. Mice were injected with 5 μg of saRNA in each leg and a ratio of polymer to RNA of 45:1 (w/w) for pABOL. Each circle represents one leg of one animal, and bar represents mean ± SEM, n = 10. (g) Representative images of each group, corresponding to (f).
Figure 4
Figure 4
Effect of molecular weight, route of administration, and ratio of pABOL to RNA on in vivo expression of fLuciferase-encoding saRNA polyplexes. (a, b) Quantification of fLuc expression of PEI (jetPEI and PEI MAX) and pABOL polyplexes in total flux (p/s), 7 d after injection. Mice were injected with 5 μg of saRNA either intramuscularly (a) or intradermally (b), and a polymer to RNA ratio of 45:1 (w/w) for pABOL, 1:1 for PEI MAX, and an N:P of 8 for jetPEI. Each circle represents one leg of one animal, and bar represents mean ± SD, n = 5. (c, d) Representative images of each group after IM (c) and ID (d) injection. (e) Quantification of fLuc expression in vivo 7 d after IM injection of 5 μg of saRNA with varying ratios of pABOL to RNA. Each circle represents one leg of one animal, and bar represents mean ± SD, n = 5. (f) Representative images of each group, corresponding to (e). *Indicates significance based on a one-way ANOVA with p < 0.05.
Figure 5
Figure 5
Cellular expression of saRNA after IM (mouse) or ID (human, mouse) injection with polyplex formulations. (a) Percentage of eGFP+ cells out of total live cells for each formulation after an intradermal injection of 2 μg of saRNA in human skin explants. Explants were analyzed 72 h after initial injection. jetPEI and PEI MAX were formulated at ratios of N/P = 8 and 1, respectively. pABOL formulations were prepared at ratios of 10:1, 25:1, and 45:1. Bars represent mean ± SD for n = 3, with *, **, and *** indicating significance of p < 0.05, 0.01, and 0.001 using an unpaired, two-tailed t test, respectively. (b, c) Percentage of eGFP+ cells out of total live cells for each formulation after either IM (b) or ID (c) injection of 5 μg of saRNA in mice. Tissue was excised 7 d after initial injection. jetPEI was formulated at a ratio of N/P = 8, and pABOL formulations were prepared at a ratio of 45:1. Bars are mean ± SD for n = 8 (IM) and 4 (ID), with * indicating significance of p < 0.05 using an unpaired, two-tailed t test. (d–f) Histograms of mean eGFP fluorescence intensity (MFI) for each formulation in human skin explants (d), IM injection in mice (e), and ID injection in mice (f). (g) fLuc expression of human skin explants after ID injection with 2 μg of saRNA. Explants were analyzed 72 h after initial injection. Bars represent mean ± SD for n = 3, with * indicating significance of p < 0.05 using an unpaired, two-tailed t test. (h) Representative images corresponding to (g).
Figure 6
Figure 6
Phenotypic identity of cells present in human skin explants and GFP+ cells after intradermal (ID) injection of polyplex formulations as determined by flow cytometry. (a) Identity of cells in the population of total cells extracted from human skin explants. (b) Identity of GFP-expressing skin cells from explants treated with polyplex-formulated eGFP-encoding saRNA. Cells identified using the following antibodies: epithelial cells (CD45−), fibroblasts (CD90+), NK cells (CD56+), leukocytes (CD45+), Langerhans cells (CD1a+), monocytes (CD14+), dendritic cells (CD11c+), T cells (CD3+), and B cells (CD19+).
Figure 7
Figure 7
Immunogenicity of HA-encoding saRNA polyplexes. (a, b) Change in body weight after IN challenge with Cal/09 flu virus for mice injected either IM (a) or ID (b). Dots represent mean percentage, normalized to day 0 for each mouse, ±SEM for n = 5. § indicates significance of p < 0.05 for 1 μg dose vs naïve, while # indicates significance of p < 0.05 for 1 μg dose PEI group vs 1 μg dose pABOL group as evaluated using multiple t tests adjusted for multiple comparisons. (c, d) HA antigen-specific IgG antibody titers following immunization with prime and boost of saRNA complexed with jetPEI, 8 kDa pABOL, or 100 kDa pABOL for mice injected either IM (c) or ID (d). Data are presented as box and whiskers with outer limits of the minimum and maximum, and a line as the mean for n = 5. (e, f) HAI titer of Cal/09 flu virus for mice injected either IM (e) or ID (f). Gray dotted line represents the limit of detection. (g, h) Neutralization IC50 against Cal/09 flu virus for mice injected either IM (g) or ID (h). * indicates significance of p < 0.05 as evaluated using a Kruskal–Wallis test with multiple comparisons. Each bar represents mean ± SEM for n = 5 at each time point.

References

    1. Ulmer J. B.; Valley U.; Rappuoli R. Vaccine Manufacturing: Challenges and Solutions. Nat. Biotechnol. 2006, 24, 1377–1383. 10.1038/nbt1261. - DOI - PubMed
    1. Petsch B.; Schnee M.; Vogel A. B.; Lange E.; Hoffmann B.; Voss D.; Schlake T.; Thess A.; Kallen K.-J.; Stitz L.; Kramps T. Protective Efficacy of In Vitro Synthesized, Specific mRNA Vaccines against Influenza a Virus Infection. Nat. Biotechnol. 2012, 30, 1210.10.1038/nbt.2436. - DOI - PubMed
    1. Guan S.; Rosenecker J. Nanotechnologies in Delivery of mRNA Therapeutics Using Nonviral Vector-Based Delivery Systems. Gene Ther. 2017, 24, 133.10.1038/gt.2017.5. - DOI - PubMed
    1. Karikó K.; Muramatsu H.; Welsh F. A.; Ludwig J.; Kato H.; Akira S.; Weissman D. Incorporation of Pseudouridine into mRNA Yields Superior Nonimmunogenic Vector with Increased Translational Capacity and Biological Stability. Mol. Ther. 2008, 16, 1833–1840. 10.1038/mt.2008.200. - DOI - PMC - PubMed
    1. Thess A.; Grund S.; Mui B. L.; Hope M. J.; Baumhof P.; Fotin-Mleczek M.; Schlake T. Sequence-Engineered mRNA without Chemical Nucleoside Modifications Enables an Effective Protein Therapy in Large Animals. Mol. Ther. 2015, 23, 1456–1464. 10.1038/mt.2015.103. - DOI - PMC - PubMed

Publication types