. 2020 Apr 7;31(1):107478.
doi: 10.1016/j.celrep.2020.03.042.

Innate Immunity in the C. elegans Intestine Is Programmed by a Neuronal Regulator of AWC Olfactory Neuron Development

Affiliations

Innate Immunity in the C. elegans Intestine Is Programmed by a Neuronal Regulator of AWC Olfactory Neuron Development

Kyle J Foster et al. Cell Rep. .

Abstract

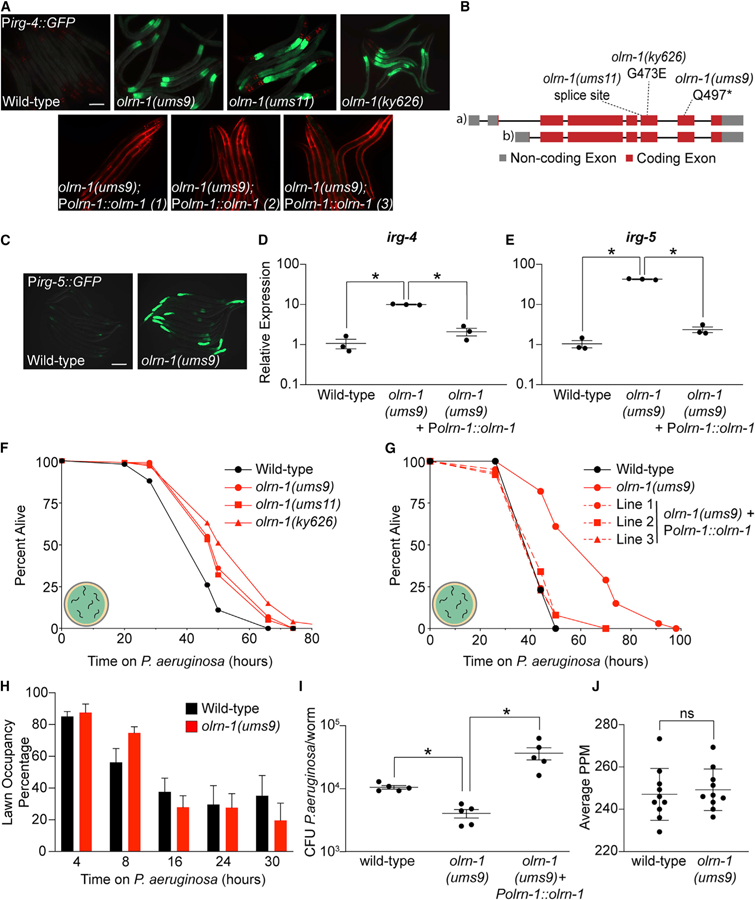
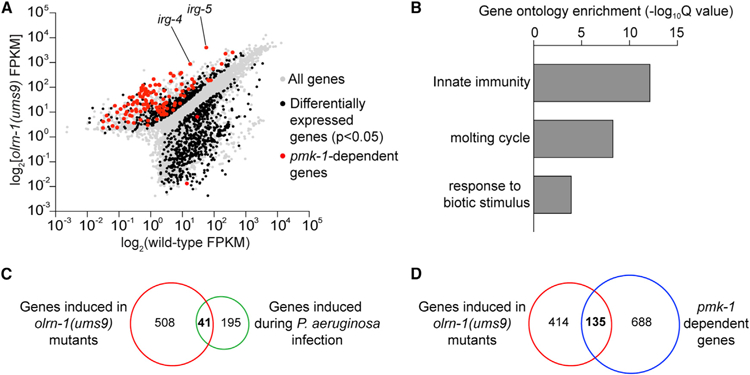
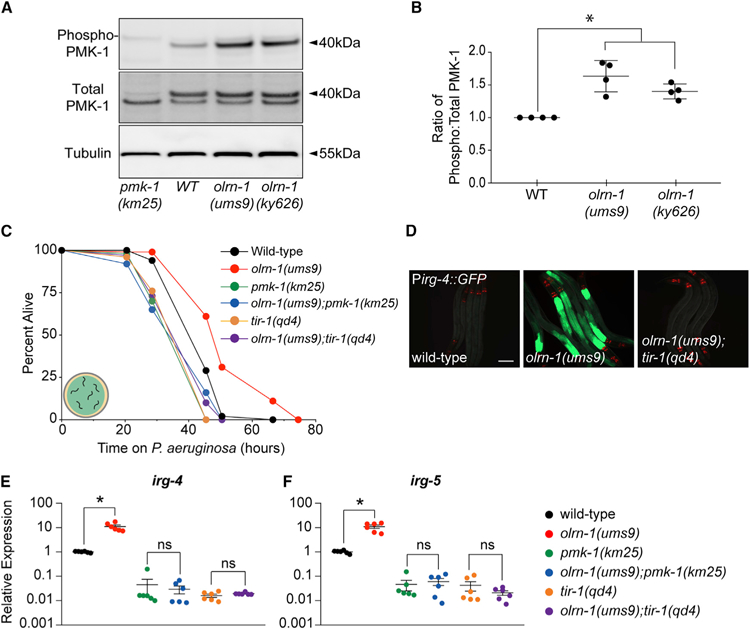
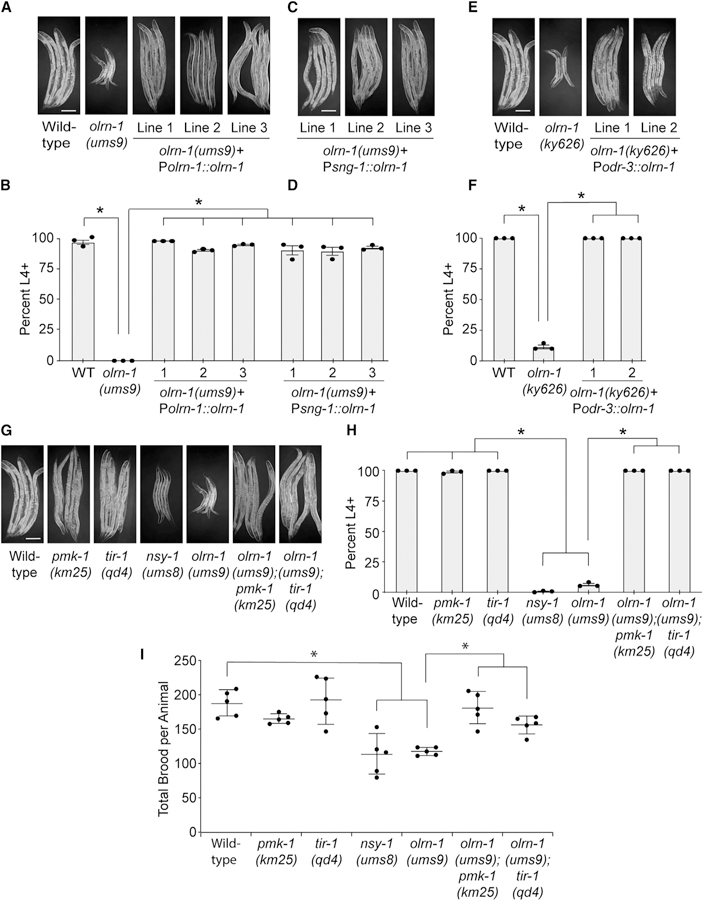
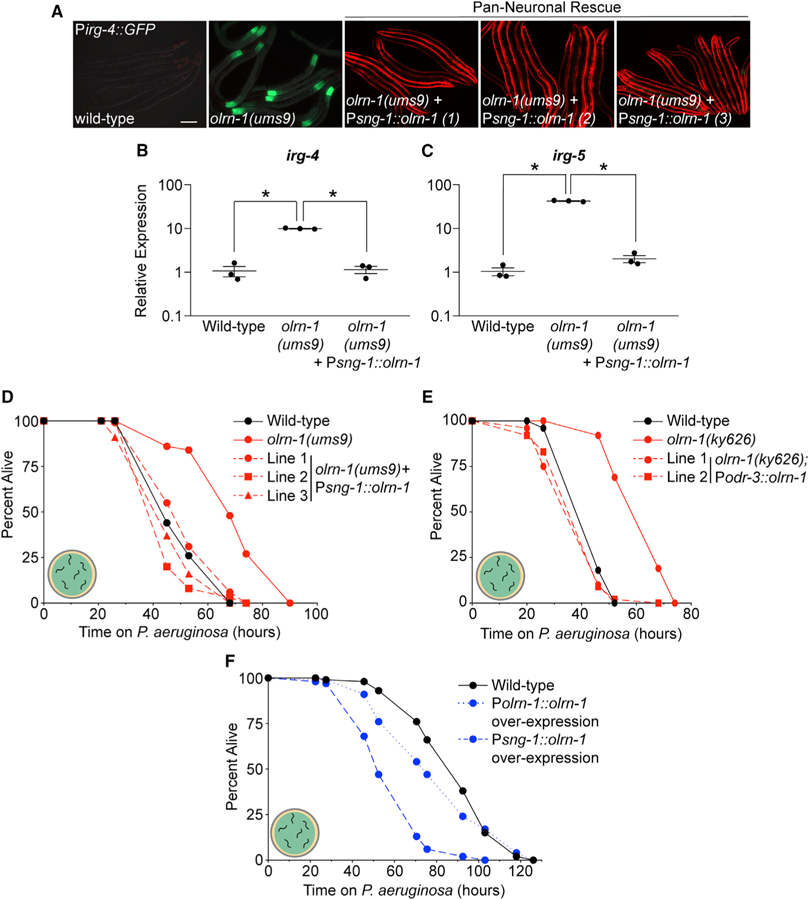
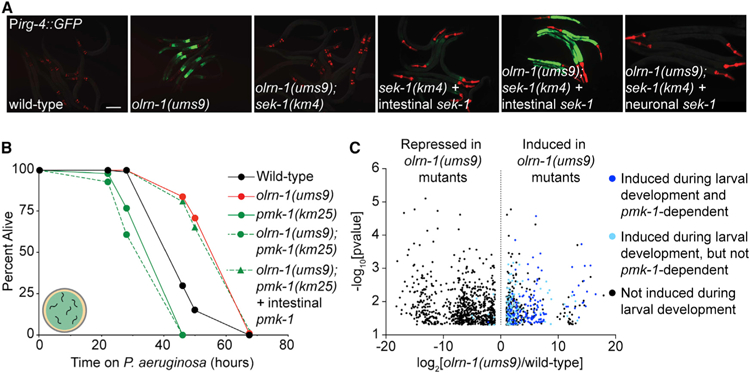
Olfactory neurons allow animals to discriminate nutritious food sources from potential pathogens. From a forward genetic screen, we uncovered a surprising requirement for the olfactory neuron gene olrn-1 in the regulation of intestinal epithelial immunity in Caenorhabditis elegans. During nematode development, olrn-1 is required to program the expression of odorant receptors in the AWC olfactory neuron pair. Here, we show that olrn-1 also functions in AWC neurons in the cell non-autonomous suppression of the canonical p38 MAPK PMK-1 immune pathway in the intestine. Low activity of OLRN-1, which activates the p38 MAPK signaling cassette in AWC neurons during larval development, also de-represses the p38 MAPK PMK-1 pathway in the intestine to promote immune effector transcription, increased clearance of an intestinal pathogen, and resistance to bacterial infection. These data reveal an unexpected connection between olfactory receptor development and innate immunity and show that anti-pathogen defenses in the intestine are developmentally programmed.

Keywords: AWC neurons; C. elegans; OLRN-1; immune homeostasis; intestinal immunity; olfactory neuron development; pathogen resistance.


Conflict of interest statement

Declaration of Interests R.P.W. has submitted a patent application related to this work (U.S. patent application, 16/069,399, filed July 11, 2018). The authors declare no other potential competing interests.

Figures

Figure 1.
Figure 1.. Loss-of-Function Mutations in olrn-1 Cause Constitutive Immune Activation
(A) Images of olrn-1 mutants and three independent rescue lines with olrn-1 expressed under the control of its own promoter in the Pirg-4::GFP immune reporter background are shown. Red pharyngeal expression is the Pmyo-2::mCherry co-injection marker, which confirms the presence of the Pirg-4::GFP transgene. The Pmyo-3::mCherry co-injection marker confirms expression of the Polrn-1::olrn-1 construct in the rescue lines. (B) Schematic of the olrn-1 locus with the locations of the ums9, ums11, and ky626 mutations is shown. (C) Immune reporter Pirg-5::GFP in the olrn-1(ums9) background is shown. (D and E) Presence of the Pirg-5::GFP transgene was confirmed by assaying for the Rol phenotype. qRT-PCR data of irg-4 (D) and irg-5 (E) of the indicated genotypes is presented. Data are the average of three independent replicates, each normalized to a control gene, with error bars representing SEM, Data are presented as the value relative to the average expression from all replicates of the indicated gene in wild-type animals. *p < 0.05 by one-way ANOVA for the indicated comparison. (F and G) C. elegans pathogenesis assay conducted with a large lawn of P. aeruginosa and C. elegans of indicated genotypes at L4 is shown. Data are representative of three trials. The Kaplan-Meier method was used to estimate the survival curves for each group, and the log rank test was used for all statistical comparisons. Sample sizes, mean lifespan, and p values for all trials are shown in Table S2. (H) Quantification of the propensity of olrn-1(ums9) and wild-type animals to avoid a lawn of P. aeruginosa is shown. Data are presented as the average number of animals that were on a small lawn of P. aeruginosa from three separate replicates, with error bars representing SEM. There is no significant difference by one-way ANOVA between these mutants, except at the 8-h time point. (I) P. aeruginosa, isolated from the intestines of animals with the indicated genotypes, was quantified after 24 h of bacterial infection. Data are colony-forming units (CFUs) of P. aeruginosa and are presented as the average of five separate replicates, with each replicate containing 10–11 animals. *p < 0.05 by one-way ANOVA for the indicated comparison. (J) Data are the pharyngeal pumping rates, recorded as pumps per minute (PPM), of 10 individual young adult C. elegans feeding on non-pathogenic OP50 in wild-type and olrn-1(ums9) mutants, with error bars representing SEM. ns indicates no significant difference by one-way ANOVA for the indicated comparison. Scale bars in (A) and (C) are 100 μm. See also Figure S1.
Figure 2.
Figure 2.. olrn-1 Suppresses Innate Immune Effector Expression
(A) Data from an mRNA sequencing (mRNA-seq) experiment comparing gene expression in olrn-1(ums9) mutants with wild-type animals are shown. All genes are shown in gray. Genes that are differentially expressed in olrn-1(ums9) mutants compared with wild-type animals are shown in black (fold change > 2, p < 0.05). Genes that are known targets of the p38 MAPK pmk-1 pathway are highlighted in red. The locations of the representative genes irg-4 and irg-5, whose expression is examined throughout this manuscript, are shown. (B) Gene Ontology enrichment analysis for the 549 genes whose transcription was significantly upregulated in olrn-1(ums9) mutants compared with wild type is shown. The three most significantly enriched categories are shown, reported as the —log10 transformation of the Q value for the enrichment of each category. (C and D) Venn diagrams show the overlap of the 549 genes upregulated in olrn-1 mutants with genes that are known to be induced during P. aeruginosa infection (C) and are targets of the p38 MAPK PMK-1 pathway (D). Hypergeometric p values for the overlap in (C) and (D) are 3.22e–21 and 9.10e–67, respectively. See also Figure S2.
Figure 3.
Figure 3.. olrn-1 Suppresses the p38 MAPK PMK-1 Innate Immune Pathway
(A) Immunoblot analysis of lysates from animals of the indicated genotype using antibodies that recognize the doubly phosphorylated TGY motif of PMK-1 (phospho-PMK-1), the total PMK-1 protein (total PMK-1), and tubulin is shown. PMK-1 is a 40 kDa protein, and tubulin is a 55 kDa protein. (B) Band intensities of four biological replicates of the western blot shown in (A) were quantified. The ratio of active to total PMK-1 is shown for each genotype and is presented relative to the ratio in wild-type animals for each replicate. *p < 0.05 by one-way ANOVA for the indicated comparison. (C) C. elegans pathogenesis assay conducted with a large lawn of P. aeruginosa and C. elegans of indicated genotypes at L4 is shown. Data are representative of three trials. The Kaplan-Meier method was used to estimate the survival curves for each group, and the log rank test was used for all statistical comparisons. Sample sizes, mean lifespan, and p values for all trials are shown in Table S2. (D) Images of olrn-1(ums9) mutants and olrn-1(ums9);tir-1(qd4) double mutants are shown. Red pharyngeal expression is the Pmyo-2::mCherry co-injection marker, which confirms the presence of the Pirg-4::GFP transgene. Scale bar is 100 μm. (E and F) qRT-PCR data show irg-4 (E) and irg-5 (F) expression in the indicated genotypes. Data are the average of six independent replicates, each normalized to a control gene, with error bars representing SEM. Data are presented as the value relative to the average expression from all replicates of the indicated gene in wild-type animals. *p < 0.05 by one-way ANOVA for the indicated comparison. ns denotes that the difference between the indicated comparisons was not statistically significant.
Figure 4.
Figure 4.. Promotion of Intestinal Immune Homeostasis by olrn-1 Is Required to Ensure Reproduction and Development
(A–H) Development assays were performed with the indicated genotypes. The stage of the animals was recorded at the same time point, approximately 72 h after eggs from C. elegans of the indicated genotypes were laid. In (B), (D), (F), and (H), data are presented as the average number of animals for each genotype that were at L4 or older (percent L4+) from three independent replicates, with error bars representing SEM. *p < 0.05 by one-way ANOVA. The stage that was recorded for each animal in these assays and the sample size for all replicates are presented in Table S2. The animals in (A), (C), (E), and (G) were from the same trial and were photographed together. The same photographs of the control genotypes [wild-type and olrn-1(ums9)] are shown in (A), (E), and (G) to make interpretation of the figure easier. (I) Brood sizes from animals of the indicated genotypes were quantified. Each data point is the average brood size from two animals. *p < 0.05 by one-way ANOVA for the indicated comparison. The data for each replicate are presented in Table S2. Scale bars in (A), (C), (E), and (G) are 100 μm. See also Figure S3.
Figure 5.
Figure 5.. Expression of olrn-1 in Chemosensory Neurons Is Sufficient to Regulate Innate Immunity in the Intestinal Epithelium
(A) Three independent lines of olrn-1 under the control of a pan-neuronal promoter (sng-1) in the olrn-1(ums9) mutant, along with the olrn-1(ums9) mutant, are shown. Pmyo-3::mCherry expression indicates the presence of an extrachromosomal array that contains the Psng-1::olrn-1 construct. Scale bar is 100 μm. (B and C) qRT-PCR data show irg-4 (B) and irg-5 (C) expression in animals of the indicated genotypes. Data are the average of three independent replicates, each normalized to a control gene, with error bars representing SEM. Data are presented as the value relative to the average expression from all replicates of the indicated gene in wild-type animals. *p < 0.05 by one-way ANOVA for the indicated comparison. (D–F) C. elegans pathogenesis assay conducted with a large lawn of P. aeruginosa and C. elegans of indicated genotypes at L4 is shown. Data are representative of three trials. Sample sizes, mean lifespan, and p values for all trials are shown in Table S2. See also Figure S4.
Figure 6.
Figure 6.. Immune Effectors Regulated by Neuronal olrn-1 Are Dynamically Expressed during Nematode Development
(A) Representative images of animals with the indicated genotypes carrying an integrated Pirg-4::GFP reporter. Red pharyngeal expression is the Pmyo-2::mCherry co-injection marker, which confirms the presence of the Pirg-4::GFP transgene. Bright red pharyngeal expression in C. elegans with intestinal sek-1 (Pges-1::sek-1::GFP) and neuronal sek-1 (Punc-119::sek-1::GFP) is the Pmyo-2:mStrawberry co-injection marker. The presence of the Pirg-4::GFP reporter was confirmed in these animals by Pmyo-2::mCherry expression in siblings that did not contain the indicated extrachromosomal arrays. Scale bar is 100 μm. (B) C. elegans pathogenesis assay conducted with a large lawn of P. aeruginosa and C. elegans of indicated genotypes at L4 is shown. Data are representative of three trials. Sample sizes, mean lifespan, and p values for all trials are shown in Table S2. ‘‘Intestinal pmk-1’’ indicates that these animals have the Pvha-6::pmk-1 extrachromosomal array. (C) Volcano plot of the mRNA-seq transcriptome profiling analysis shows all genes that were differentially expressed in olrn-1(ums9) mutants compared with wild-type animals (fold change > 2, p < 0.05), as described in Figure 2A. Highlighted in dark blue are the genes whose transcription are (1) dependent on the p38 MAPK pmk-1 (from the overlap in Figure 2D) and (2) induced in wild-type animals at L1, L2, L3, or L4 compared with wild-type young adult animals. Highlighted in light blue are the genes that are induced in L1, L2, L3, or L4 wild-type nematodes compared with adult animals but whose transcription does not depend on p38 MAPK pmk-1. Venn diagrams showing the overlap of genes that are induced at each larval stage compared with genes that are induced in olrn-1(ums9) mutants are shown Figure S5A. See also Figure S5.

Similar articles

Cited by

References

    1. Amrit FRG, Naim N, Ratnappan R, Loose J, Mason C, Steenberge L, McClendon BT, Wang G, Driscoll M, Yanowitz JL, and Ghazi A (2019). The longevity-promoting factor, TCER-1, widely represses stress resistance and innate immunity. Nat. Commun 10, 3042. - PMC - PubMed
    1. Anderson SM, Cheesman HK, Peterson ND, Salisbury JE, Soukas AA, and Pukkila-Worley R (2019). The fatty acid oleate is required for innate immune activation and pathogen defense in Caenorhabditis elegans. PLoS Pathog 15, e1007893. - PMC - PubMed
    1. Bargmann CI, Hartwieg E, and Horvitz HR (1993). Odorant-selective genes and neurons mediate olfaction in C. elegans. Cell 74, 515–527. - PubMed
    1. Bauer Huang SL, Saheki Y, VanHoven MK, Torayama I, Ishihara T, Katsura I, van der Linden A, Sengupta P, and Bargmann CI (2007). Left-right olfactory asymmetry results from antagonistic functions of voltage-activated calcium channels and the Raw repeat protein OLRN-1 in C. elegans. Neural Dev 2, 24. - PMC - PubMed
    1. Bolger AM, Lohse M, and Usadel B (2014). Trimmomatic: a flexible trimmer for Illumina sequence data. Bioinformatics 30, 2114–2120. - PMC - PubMed

Publication types

MeSH terms

Substances