. 2020 Apr 7;31(1):107489.
doi: 10.1016/j.celrep.2020.03.053.

Whole-Genome and RNA Sequencing Reveal Variation and Transcriptomic Coordination in the Developing Human Prefrontal Cortex

Affiliations

Whole-Genome and RNA Sequencing Reveal Variation and Transcriptomic Coordination in the Developing Human Prefrontal Cortex

Donna M Werling et al. Cell Rep. .

Abstract

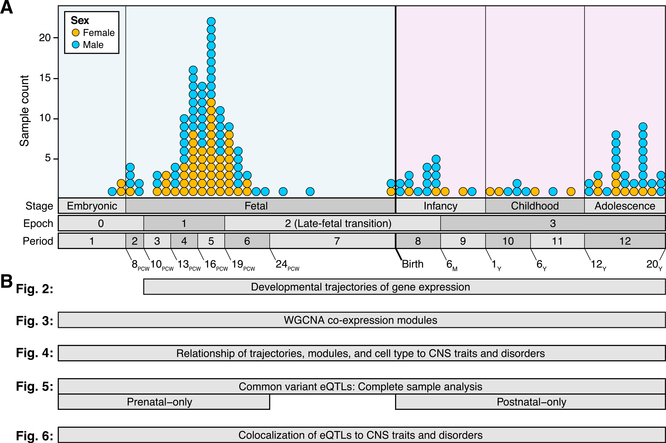
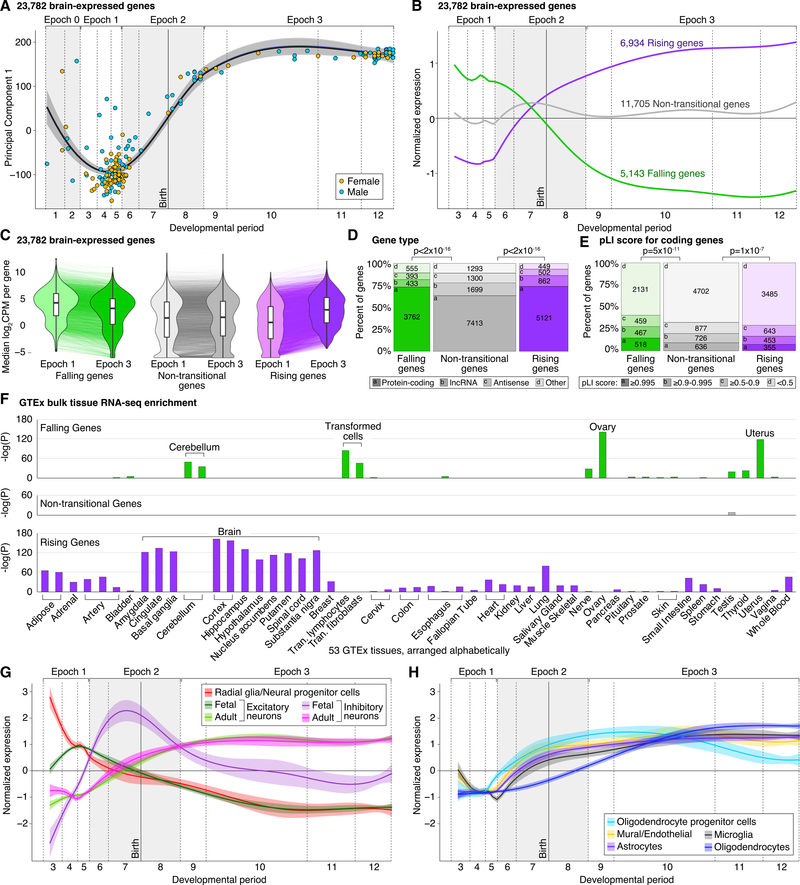
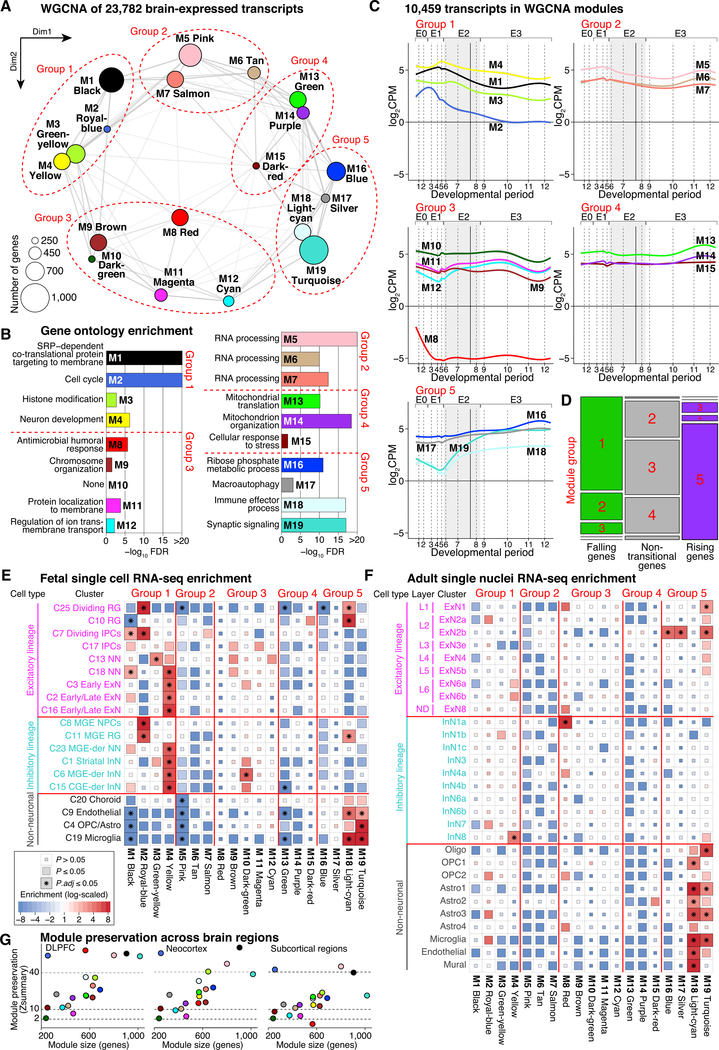
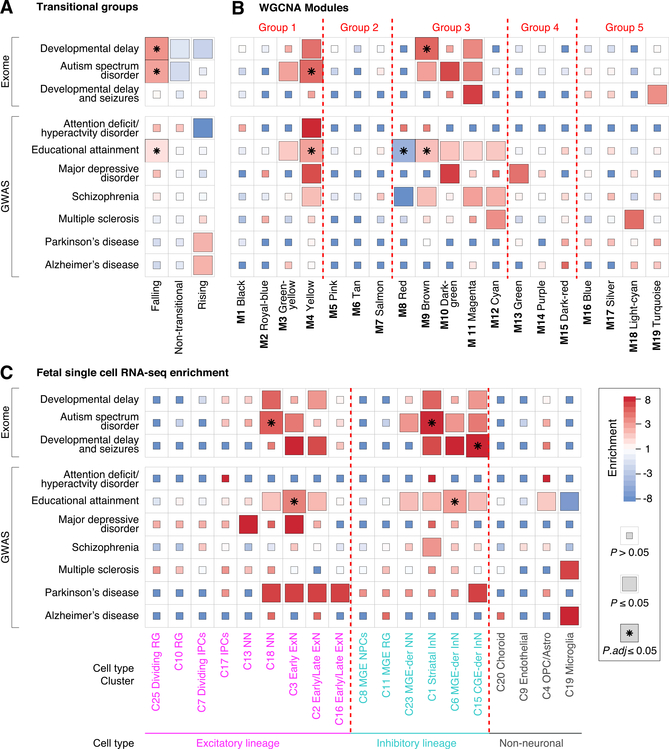
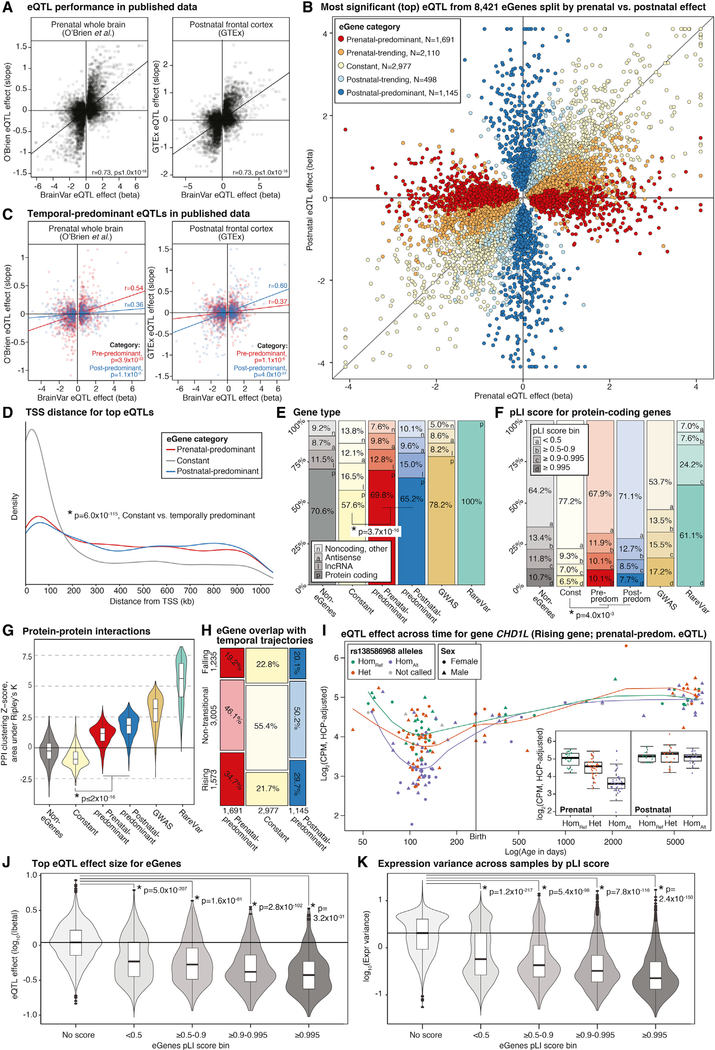
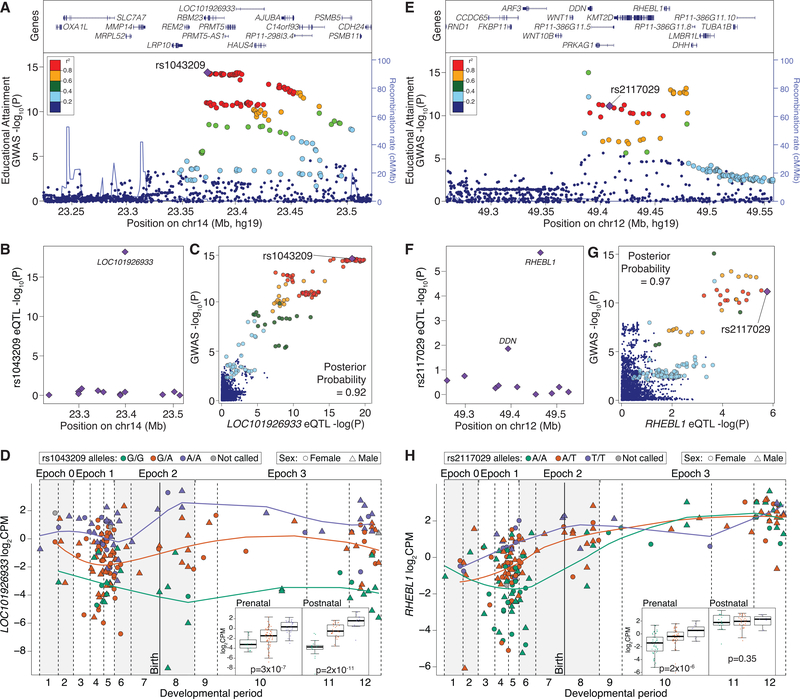
Gene expression levels vary across developmental stage, cell type, and region in the brain. Genomic variants also contribute to the variation in expression, and some neuropsychiatric disorder loci may exert their effects through this mechanism. To investigate these relationships, we present BrainVar, a unique resource of paired whole-genome and bulk tissue RNA sequencing from the dorsolateral prefrontal cortex of 176 individuals across prenatal and postnatal development. Here we identify common variants that alter gene expression (expression quantitative trait loci [eQTLs]) constantly across development or predominantly during prenatal or postnatal stages. Both "constant" and "temporal-predominant" eQTLs are enriched for loci associated with neuropsychiatric traits and disorders and colocalize with specific variants. Expression levels of more than 12,000 genes rise or fall in a concerted late-fetal transition, with the transitional genes enriched for cell-type-specific genes and neuropsychiatric risk loci, underscoring the importance of cataloging developmental trajectories in understanding cortical physiology and pathology.

Keywords: BrainVar; DLPFC; LOC101926933 RP11-298I3.1 AL132780.1 ENSG00000257285; PsychENCODE; RHEBL1; dorsolateral prefrontal cortex; fetal transition; mTOR; prenatal eQTL.


Conflict of interest statement

Declaration of Interests The authors declare no competing interests.

Figures

Figure 1.
Figure 1.. Overview of the Dataset and the Analysis
(A) 176 samples from the dorsolateral prefrontalcortex (DLFPC) of the developing human brain were processed to generate RNA-seq gene expression data and WGS data (top). The distribution of the samples is shown by sex (color) and developmental stage (x axis). Periods were defined previously (Kang et al., 2011), and epochs are defined as a superset of periods based on principal component analysis of these RNA-seq data (Figure 2). (B) Analyses conducted using these data. Thewidth of each box corresponds to the samples included in each analysis. See also Table S1 and Figure S1.
Figure 2.
Figure 2.. Temporal Trajectories of Gene Expression in the Human DLPFC
(A) Gene expression log base 2 counts per million (log2CPM) for each sample was used to calculate principal components (Figure S2). The first principal component (PC1) explains 42% of the variance between samples, and 81% of variance in PC1 is explained by developmental stage (Figure S2). The changes in PC1 over time were used to define four “epochs” of gene expression. Dotted lines represent the boundaries of the indicated developmental period as defined previously (Kang et al., 2011). (B and C) Trajectory analysis identifies three sets of genes with similar developmental profiles across the late-fetal transition in epoch 2 (B; Table S2). For each group, the expression over time, normalized by the interquartile range and locally estimated scatterplot smoothing (LOESS), is shown as a line, with the narrow 95% CI in gray. These three groups are further characterized by plotting (C) the median log2CPM across all samples in epoch 1 and epoch 3, with the difference for each gene shown as a line. (D) The relative proportion of Gencode protein-coding and noncoding genes with gene counts. (E) The distribution of probability loss-of-function intolerance (pLI) scores for protein-coding genes (Lek et al., 2016) with gene counts. (F) Enrichment in the most tissue-specific genes from the 53 tissues with bulk tissue RNA-seq data from the Genotype-Tissue Expression Consortium (GTEx) (GTEx Consortium, 2015). (G) Pattern of expression for ten cell type-specific genes (Table S2) for each of five neuronal lineage cell types (LOESS with 95% CI). (H) Analysis in (G) repeated for five glial lineage cell types. OPC, oligodendrocyte progenitor cell. Statistical analyses: (A) principal component analysis; (B) longitudinal mixture model with Gaussian noise; (D) FET; (E) two-sided WRST; (F) t-test. See also Table S2 and Figures S1 and S2.
Figure 3.
Figure 3.. Co-expression Modules in the Developing Human Cortex
(A) Weighted genome co-expression network analysis (WGCNA) identified 19 modules comprised of 10,459 of 23,782 expressed genes. Modules are shown ascolored nodes plotted based on the first two dimensions from multidimensional scaling. The weight of the connecting lines (edges) represents the degree of correlation between module eigengenes. (B) LOESS expression values across development are shown with 95% CIs for the 19 modules arranged in five groups based on proximaity in (A) and similartemporal trajectories. (C) Gene Ontology enrichment analysis for each module, showing only biological processes with the lowest false discovery rate (FDR). (D) Mosaic plot showing the relationship between the five groups of co-expression modules (from A) and genes with falling, rising, or non-transitional temporaltrajectories (Figure 2). The area is proportional to the number of genes in each bin. Detailed relationships between modules and temporal trajectories are shown in Figure S3. (E) Enrichment between the 19 modules and the 200 genes most specific to 19 cell type clusters defined by single-cell RNA-seq data in the developing humancortex (Nowakowski et al., 2017). (F) Enrichment between the 19 modules and the 200 genes most specific to 29 cell type clusters defined by single nucleus RNA-seq data in the adult humanDLPFC (Li et al., 2018). (G) Module preservation in independent BrainSpan samples (Li et al., 2018) from the same brain region (left), other cortical regions (center), and five subcortical regions (right). SRP, signal recognition particle; C, cluster of single nuclei; L, cortical layer; ND, layer not defined; RG, radial glia; IPC, intermediate progenitor cell; NN, newborn neuron; ExN, excitatory neuron; InN, inhibitory neuron; CGE, caudal ganglionic eminence; MGE, medial ganglionic eminence. Statistical analysis: (A) WGCNA with consensus module detection from 100 random resamplings; (C) FET, corrected for gProfiler Gene Ontology pathways (10–2,000 term size); (E) FET corrected for 361 comparisons; (F) FET corrected for 551 comparisons; (G) FET corrected for 19 comparisons. See also Table S2 and S3 and Figure S3.
Figure 4.
Figure 4.. Expression of Genes Associated with CNS Traits and Disorders
(A) Genes from genome-wide significant loci were collated for ten CNS traits and disorders from exome sequencing or genome-wide association studies (GWASs). The enrichment is shown for the three trajectory groups (Figure 2). (B) The analysis in (A) repeated for co-expression modules. (C) The analysis in (A) repeated for genes enriched for cell type clusters from single-cell RNA-seq of the prenatal human brain. Statistical analysis: (A) FET corrected for 30 comparisons; (B) FET corrected for 190 comparisons; (C) FET corrected for 190 comparisons. See also Table S2 and S4, and Figure S4.
Figure 5.
Figure 5.. Common Variant cis-eQTLs
(A) Effects of the top expression quantitative trait locus (eQTL) per gene regulated by an eQTL (eGene) with FDR ≤ 0.05 in the BrainVar analyses (x axis, union of results from complete sample, prenatal-only, and postnatal-only analyses) versus effects observed in the prenatal whole brain (O’Brien et al., 2018) (left) and postnatal frontal cortex (Aguet et al., 2017) (right, y axis). (B) Prenatal (x axis) and postnatal (y axis) effects for the eQTLs with the smallest p value for 8,421 eGenes (points). The eQTLs are split into five categories basedon temporal predominance using effect size and statistical thresholds; categories are represented by color. (C) Effects of the top eQTL per eGene with FDR ≤ 0.05 from the prenatal-predominant (red) or postnatal-predominant (blue) eQTL categories from BrainVar (x axis) versus effects observed in the published datasets described in (A) (y axis). (D) Density plot of the distance of top eQTLs per eGene from the transcription start site by eGene temporal category. (E–G) Characteristics of non-eGenes, temporal-predominant eGenes, and disorder-associated genes are shown by plotting the (E) proportion of coding and noncoding genes, (F) proportion of genes with pLI scores in different bins, and (G) BioGRID protein-protein interactions (permuted Z scores from Ripley’s K-net function; Cornish and Markowetz, 2014; the black line is the non-eGene median). (H) Mosaic plot of the proportion of genes in each temporal trajectory with eGenes split by temporal category. (I) Expression data binned by genotype for the top prenatal-predominant eQTL for CHD1L, a gene with a rising trajectory. Main panel: gene expression by sample age across development. Lines represent LOESS trajectories for expression in samples with each of three genotypes for rs138586968. Inset: boxplots for prenatal (left) and postnatal (right) samples with each of three rs138586968 genotypes. (J) Distribution of eQTL effect size for eGenes binned by pLI scores. The black line represents the median of the transcripts with no pLI score. (K) Distributions of between-sample variance in the expression level of expressed genes binned by pLI scores. The black line represents the median variance ofthe transcripts with no pLI score. TSS, transcription start site; Statistical analysis: (A) and (C) Pearson correlation; (D) and (G), two-sided WRST test for constant versus other eGenes; (E) and (F), two-sided FET for constant versus other eGenes; (J) and (K), two-sided WRST test for each of four pLI bins versus genes with no pLI score. See also Tables S2 and S5 and Figure S5.
Figure 6.
Figure 6.. Colocalization of Two eQTLs with Educational Attainment GWAS Loci
(A) Statistical evidence of association with educational attainment for SNPs (points) alongside the recombination rate (blue line). Color shows the correlation withthe SNP rs1043209 (Pruim et al., 2010). (B) The statistical evidence for the SNP rs1043209 being an eQTL is shown for each gene within proximity of the locus. No other genes had high posteriorprobabilities for colocalization. (C) The statistical evidence for being an eQTL for the noncoding RNA LOC101926933 (x axis) is shown against the evidence for association with educational attainment (y axis) for each SNP (points). (D) The expression of LOC101926933 is shown for each sample across development with genotype at rs1043209, indicated by color. (E–H) Another educational attainment locus that colocalized with the gene RHEBL1 in the prenatal period only is shown, as in (A)–(D). Statistical analysis: (B) colocalization analysis; (D) inset, ANOVA; (E) colocalization analysis; (H) inset, ANOVA. See also Tables S2 and S6 and Figure S6.

References

    1. Aguet F, Brown AA, Castel SE, Davis JR, He Y, Jo B, Mohammadi P, Park Y, Parsana P, Segrè AV, et al. ; GTEx Consortium (2017). Genetic effects on gene expression across human tissues. Nature 550, 204–213. 10.1038/nature24277. - DOI - PMC - PubMed
    1. Akbarian S, Liu C, Knowles JA, Vaccarino FM, Farnham PJ, Crawford GE, Jaffe AE, Pinto D, Dracheva S, Geschwind DH, et al. ; PsychENCODE Consortium (2015). The PsychENCODE project. Nat. Neurosci. 18, 1707–1712. - PMC - PubMed
    1. An JY, Lin K, Zhu L, Werling DM, Dong S, Brand H, Wang HZ, Zhao X, Schwartz GB, Collins RL, et al. (2018). Genome-wide de novo risk score implicates promoter variation in autism spectrum disorder. Science 362, eaat6576. - PMC - PubMed
    1. Anders S, Pyl PT, and Huber W (2015). HTSeq–a Python framework to work with high-throughput sequencing data. Bioinformatics 31, 166–169. - PMC - PubMed
    1. Bae BI, and Walsh CA (2013). Neuroscience. What are mini-brains? Science 342, 200–201.

Publication types

MeSH terms