. 2020 Apr 7;31(4):852-861.e6.
doi: 10.1016/j.cmet.2020.03.008.

ZBTB1 Regulates Asparagine Synthesis and Leukemia Cell Response to L-Asparaginase

Affiliations

ZBTB1 Regulates Asparagine Synthesis and Leukemia Cell Response to L-Asparaginase

Robert T Williams et al. Cell Metab. .

Abstract

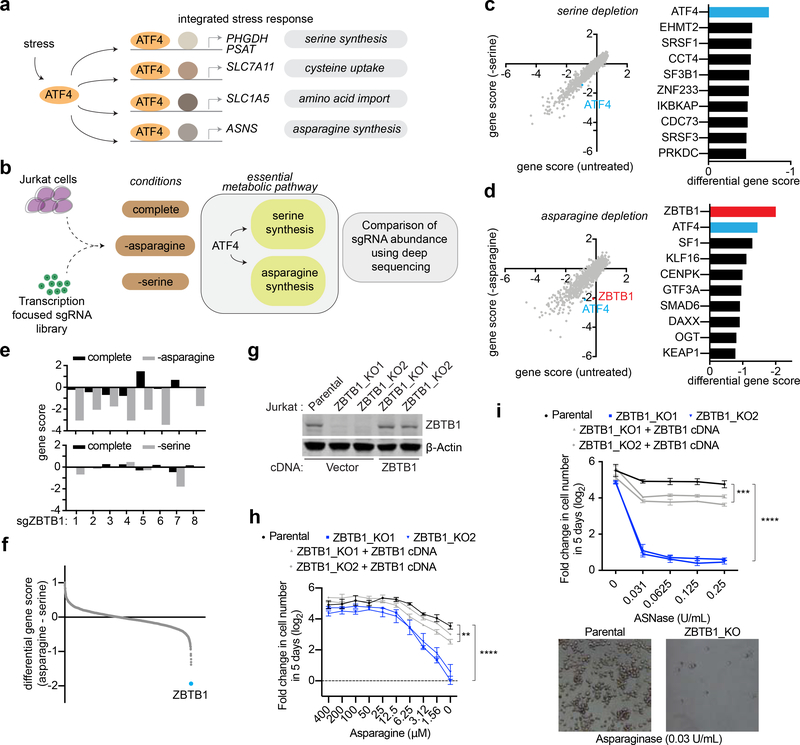
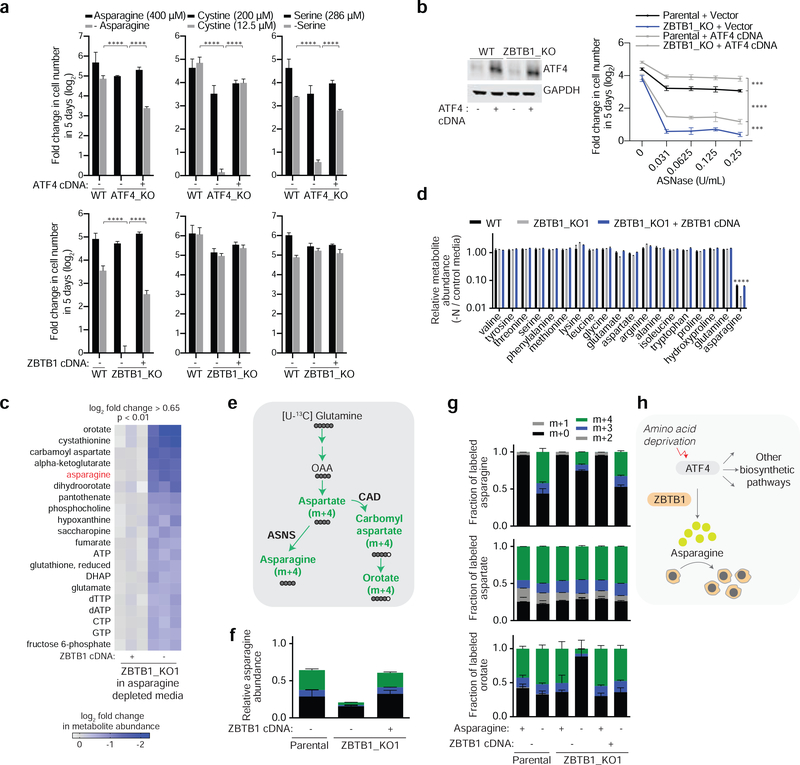
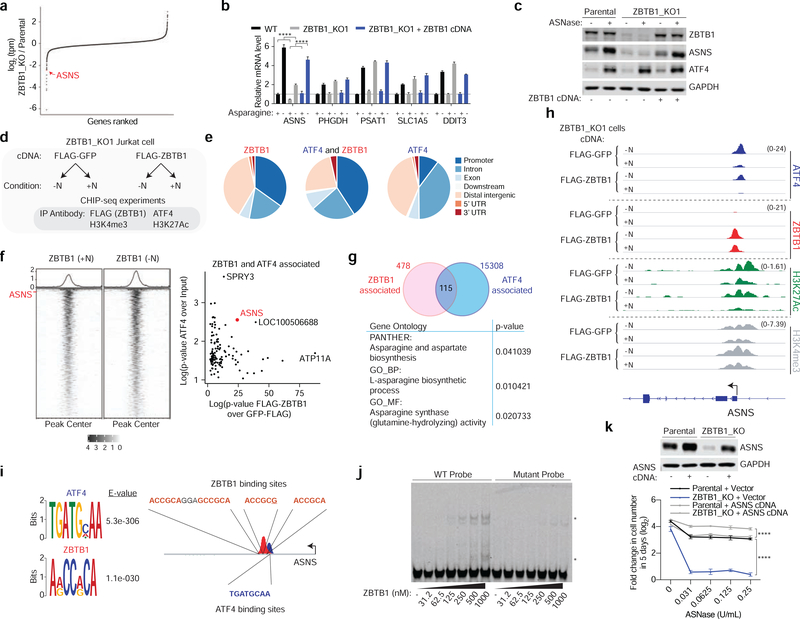
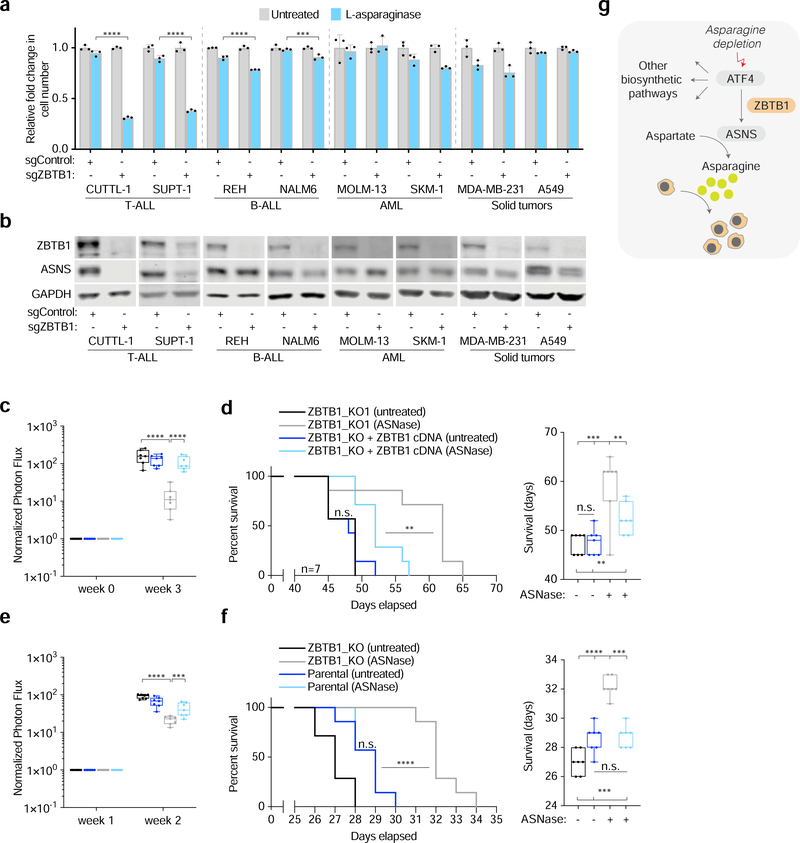
Activating transcription factor 4 (ATF4) is a master transcriptional regulator of the integrated stress response (ISR) that enables cell survival under nutrient stress. The mechanisms by which ATF4 couples metabolic stresses to specific transcriptional outputs remain unknown. Using functional genomics, we identified transcription factors that regulate the responses to distinct amino acid deprivation conditions. While ATF4 is universally required under amino acid starvation, our screens yielded a transcription factor, Zinc Finger and BTB domain-containing protein 1 (ZBTB1), as uniquely essential under asparagine deprivation. ZBTB1 knockout cells are unable to synthesize asparagine due to reduced expression of asparagine synthetase (ASNS), the enzyme responsible for asparagine synthesis. Mechanistically, ZBTB1 binds to the ASNS promoter and promotes ASNS transcription. Finally, loss of ZBTB1 sensitizes therapy-resistant T cell leukemia cells to L-asparaginase, a chemotherapeutic that depletes serum asparagine. Our work reveals a critical regulator of the nutrient stress response that may be of therapeutic value.

Keywords: ATF4; CRISPR; asparaginase; cancer metabolism; genetic screen; leukemia; transcription.


Conflict of interest statement

Declaration of Interests The authors declare no competing interests.

Figures

Figure 1:
Figure 1:. A CRISPR-based genetic screen identifies transcription machinery essential for proliferation under serine and asparagine deprivation
A) Schematic demonstrating the metabolic genes regulated by ATF4, the effector of the integrated stress response. B) Schematic depicting pooled CRISPR screens under asparagine or serine deprivation using a transcription-focused sgRNA library. C) Gene scores in Jurkat cells grown in complete versus serine deficient media (left). The gene score is the median log2 fold change in the abundance of all sgRNAs targeting a given gene after 14 population doublings. Most genes, as well as non-targeting control sgRNAs, have similar scores in the presence or absence of serine. The top ten genes differentially required under serine deprivation are shown (right). D) Gene scores in WT Jurkat cells grown in complete versus asparagine deficient media (left). The top ten genes differentially required under asparagine deprivation are shown (right). Media was depleted of asparagine through the use of L-asparaginase (0.25 U/mL). E) Changes in the abundance of individual ZBTB1 sgRNAs in complete media (black) or in the absence (gray) of asparagine (top) or serine (bottom). F) Differential scores of genes required specifically under asparagine deprivation relative to serine deprivation. ZBTB1 is highlighted in blue. G) Immunoblot analysis of parental, ZBTB1 knockout, and rescued ZBTB1 knockout Jurkat cells (top). β-actin was used as a loading control. H) Fold change in cell number (log2) of parental (black), ZBTB1 knockout (blue), and rescued ZBTB1 knockout (gray) Jurkat cells after growth in media with indicated asparagine concentrations for 5 days (mean ± SD, n=3). I) Fold change in cell number (log2) of parental (black), ZBTB1 knockout (blue), and rescued ZBTB1 knockout (gray) Jurkat cells after treatment with indicated asparaginase concentrations for 5 days (mean ± SD, n=3) (top). Representative bright-field micrographs of indicated cells after a 5day asparaginase treatment (bottom). Statistics: two-tailed unpaired t-test. **P < 0.05, ***P < 0.01, ****P < 0.001.
Figure 2:
Figure 2:. ZBTB1 enables de novo asparagine synthesis and is essential for proliferation under asparagine deprivation
A) Fold change in cell number (log2) of parental, ATF4 knockout, and rescued ATF4 knockout Jurkat cells after growth in complete media (black) or media with indicated asparagine, serine or cysteine concentrations (gray) for 5 days (mean ± SD, n=3) (top). Fold change in cell number (log2) of parental, ZBTB1 knockout, and rescued ZBTB1 knockout Jurkat cells after growth in complete media (black) or media with indicated asparagine, serine or cysteine concentrations (gray) for 5 days (mean ± SD, n=3) (bottom). B) Immunoblot analysis of parental and ZBTB1 knockout Jurkat cells expressing a control vector or ATF4 cDNA (left). GAPDH was used as a loading control. Fold change in cell number (log2) of parental and ZBTB1 knockout Jurkat cells expressing a control vector or ATF4 cDNA after treatment with indicated asparaginase concentrations for 5 days (mean ± SD, n=3) (right). C) Metabolites significantly altered between ZBTB1 knockout (right) and rescued ZBTB1 knockout (left) Jurkat cells grown in asparagine-free medium, ranked by p-value. D) Differential intracellular amino acid abundances of parental (black), ZBTB1 knockout (gray), and rescued ZBTB1 knockout (blue) Jurkat cells grown in asparagine-free medium relative to complete medium (mean ± SD, n=3). E) Schematic depicting the metabolic routes of asparagine and orotate synthesis from glutamine. Filled circles represent 13C atoms derived from [U-13C]-Glutamine. F) Abundance of asparagine derived from labeled glutamine in parental, ZBTB1 knockout and rescued ZBTB1 knockout Jurkat cells cultured for 8 hours in media containing [U-13C]-glutamine (2000 uM) in the absence of asparagine. Colors indicate mass isotopomers (mean ± SD, n=3). G) Fraction of labeled asparagine (top), aspartate (middle), and orotate (bottom) derived from labeled glutamine in parental, ZBTB1 knockout and rescued ZBTB1 knockout Jurkat cells cultured for 8 hours with [U-13C]-glutamine (2000 uM) in the presence or absence of asparagine. Colors indicate mass isotopomers (mean ± SD, n=3). H) Schematic depicting the requirement of ZBTB1 for ATF4-mediated synthesis of asparagine and cancer cell proliferation under asparagine deprivation. Statistics: two-tailed unpaired t-test. **P < 0.05, ***P < 0.01, ****P < 0.001.
Figure 3:
Figure 3:. ZBTB1 regulates ASNS transcription and associates with the ASNS promoter
A) Log2 fold change in transcripts per million (TPM) in ZBTB1 knockout versus parental Jurkat cells grown in standard medium. ASNS is highlighted in red. B) Relative mRNA levels of indicated genes in parental (black), ZBTB1 knockout (gray) and rescued ZBTB1 knockout (blue) cells grown in complete or asparagine-lacking media (mean ± SD, n=3). C) Immunoblot analysis of parental, ZBTB1 knockout, and rescued ZBTB1 knockout Jurkat cells grown in the presence or absence of L-asparaginase (0.03 U/mL) for 8 hours. GAPDH was used as a loading control. D) Schematic depicting ChIP-sequencing performed in FLAG-GFP versus FLAG-ZBTB1 expressing ZBTB1 knockout cells grown in complete (+N) or asparagine-lacking media (-N). Antibodies used for immunoprecipitation are indicated. E) The proportion of ZBTB1, ATF4 and ZBTB1-ATF4 associated peaks overlapping with specified chromatin features. F) FLAG-ZBTB1 ChIP-Seq signal from normalized bigwig files quantified over all ZBTB1 peaks identified in either the presence (+N) or absence (-N) of asparagine. The row corresponding to the peak in the ASNS promoter is labeled with red text (left). Scatter plot of p-values of the peaks overlapping between ATF4 and ZBTB1 (right). ASNS is highlighted in red. G) Venn diagram depicting the number of ZBTB1, ATF4 and overlapping ZBTB1-ATF4 peaks genome-wide (top). Significantly enriched gene ontologies for peaks that overlap in ZBTB1 and ATF4 (bottom). H) ChIP-Seq tracks near the ASNS promoter for indicated antibodies (right) in the indicated genotype (top two tracks Flag-GFP or bottom two tracks FLAG-ZBTB1) in the presence (+N) or absence (-N) of asparagine. I) Motifs enriched near ATF4 and ZBTB1 peaks (left). Schematic depicting ATF4 and ZBTB1 motifs present within the promoter of ASNS (right). J) Electrophoretic mobility shift gel of parental (WT) and mutant ASNS promoter probes with the indicated concentration of recombinant ZBTB1 protein. Stars indicate probe shifts. K) Immunoblot analysis of parental and ZBTB1 knockout Jurkat cells overexpressing a vector or ASNS cDNA (left). GAPDH was used as a loading control. Fold change in cell number (log2) of parental (black) and ZBTB1 knockout (blue) Jurkat cells expressing a control vector or ASNS cDNA (gray) after treatment with indicated asparaginase concentrations for 5 days (mean ± SD, n=3) (right). Statistics: two-tailed unpaired t-test. **P < 0.05, ***P < 0.01, ****P < 0.001.
Figure 4:
Figure 4:. Loss of ZBTB1 sensitizes therapy resistant T-cell leukemia cells to L-asparaginase in vitro and in vivo
A) Fold change in cell number of sgControl (gray) versus sgZBTB1 (blue) expressing cell lines treated with L-asparaginase (0.03 U/mL) relative to untreated (mean ± SD, n=3). B) Immunoblot analysis of indicated cell lines expressing sgControl versus sgZBTB1. GAPDH was used as a loading control. C) Photon flux detected by In Vivo Imaging System for Jurkat cell lines engrafted into NSG mice normalized to initial photon flux. D) Kaplan-Meier survival curve of NSG mice engrafted with ZBTB1 knockout versus rescued ZBTB1 knockout Jurkat cells and treated with vehicle or asparaginase (1000 U/kg, twice per week) (left). Box and whisker plots of survival data (right). E) Photon flux detected by In Vivo Imaging System for CUTLL1 cell lines engrafted into NSG mice normalized to initial photon flux. F) Kaplan-Meier survival curve of NSG mice engrafted with ZBTB1 knockout versus vector-control CUTLL1 cells and treated with vehicle or asparaginase (1000 U/kg, twice per week) (left). Box and whisker plots of survival data (right). G) Schematic depicting the role of ZBTB1 in the control of ASNS expression under asparagine depletion. In c,d,e,f, the boxes represent the median, and the first and third quartiles, and the whiskers represent the minimum and maximum of all data points. Statistics: two-tailed unpaired t-test. **P < 0.05, ***P < 0.01, ****P < 0.001.

References

    1. Al-Baghdadi RJT et al. (2017) ‘Role of activating transcription factor 4 in the hepatic response to amino acid depletion by asparaginase’, Scientific Reports. Springer US, 7(1), pp. 1–12. doi: 10.1038/s41598-017-01041-7. - DOI - PMC - PubMed
    1. Aslanian AM, Fletcher BS and Kilberg MS (2001) ‘Asparagine synthetase expression alone is sufficient to induce l-asparaginase resistance in MOLT-4 human leukaemia cells.’, The Biochemical journal, 357(Pt 1), pp. 321–8. doi: 10.1042/0264-6021:3570321. - DOI - PMC - PubMed
    1. Ben-Sahra I et al. (2013) ‘Stimulation of de novo pyrimidine synthesis by growth signaling through mTOR and S6K1.’, Science (New York, N.Y.), 339(6125), pp. 1323–8. doi: 10.1126/science.1228792. - DOI - PMC - PubMed
    1. Bowers SR et al. (2010) ‘Runx1 binds as a dimeric complex to overlapping Runx1 sites within a palindromic element in the human GM-CSF enhancer.’, Nucleic acids research, 38(18), pp. 6124–34. doi: 10.1093/nar/gkq356. - DOI - PMC - PubMed
    1. Brian Dalton W et al. (2019) ‘Hotspot SF3B1 mutations induce metabolic reprogramming and vulnerability to serine deprivation’, Journal of Clinical Investigation, 129(11), pp. 4708–4723. doi: 10.1172/JCI125022. - DOI - PMC - PubMed

Publication types