

Associations of Cardiac, Kidney, and Diabetes Biomarkers With Peripheral Neuropathy among Older Adults in the Atherosclerosis Risk in Communities (ARIC) Study
- PMID: 32268368
- PMCID: PMC7192523
- DOI: 10.1093/clinchem/hvaa051
Associations of Cardiac, Kidney, and Diabetes Biomarkers With Peripheral Neuropathy among Older Adults in the Atherosclerosis Risk in Communities (ARIC) Study
Abstract
Background: The aim of this study was to assess the association of high-sensitivity cardiac troponin (hs-cTnT) and other cardiac, kidney, hyperglycemia, and inflammatory biomarkers with peripheral neuropathy (PN) in a community-based population.
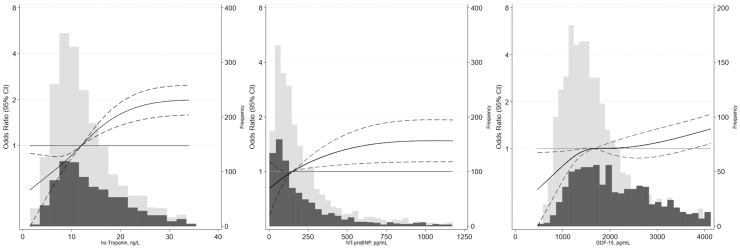
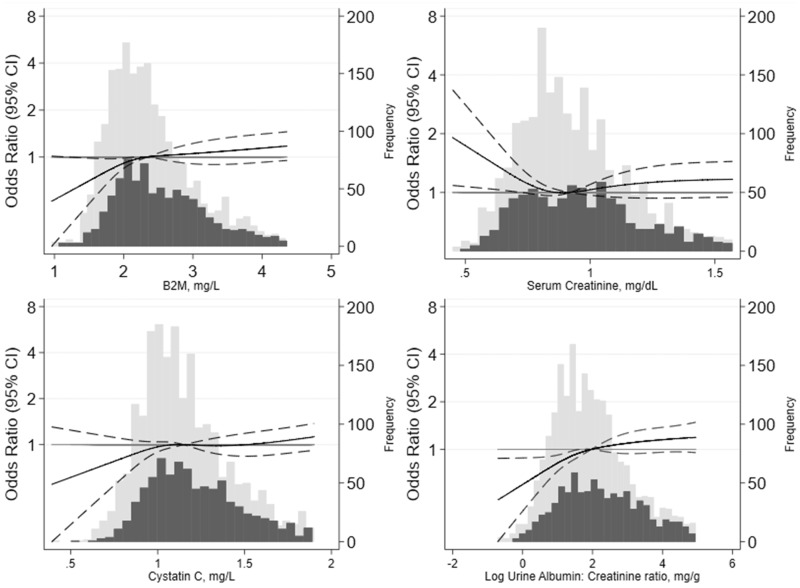
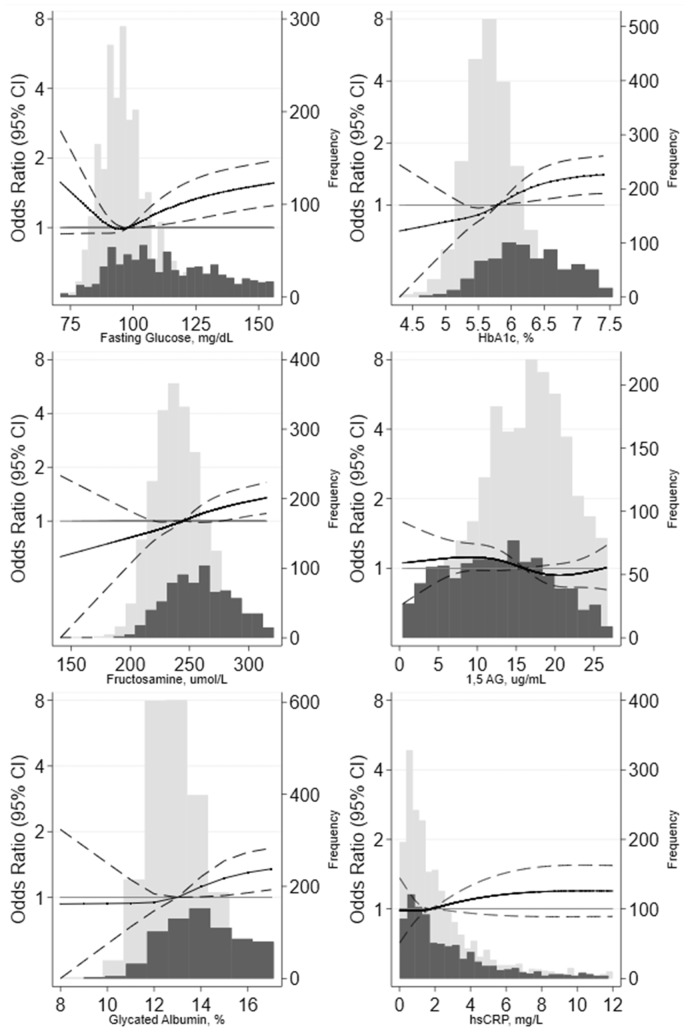
Methods: We conducted a cross-sectional analysis of 3056 black and white participants in the Atherosclerosis Risk in Communities (ARIC) study who underwent standardized monofilament PN testing and had measures of cardiac function (hs-cTnT, N-terminal pro-B-type natriuretic peptide [NT-proBNP], and growth differentiation factor 15 [GDF15]), kidney function (serum creatinine, cystatin C, β-2 microglobulin, urine albumin-to-creatinine ratio), hyperglycemia (fasting glucose, hemoglobin A1c [Hb A1c], fructosamine, glycated albumin, 1,5-anhydroglucitol), and inflammation (C-reactive protein) assessed at visit 6 (2016-2017; age 71-94 years). We used logistic regression to assess the associations of these biomarkers (modeled in diabetes-specific tertiles) with PN in older adults with and without diabetes after adjusting for traditional risk factors.
Results: In total, 33.5% of participants had PN (37.3% with diabetes and 31.9% without diabetes). There was an independent association of hs-cTnT with PN regardless of diabetes status (diabetes T3 vs. T1: odds ratio [OR], 2.15 [95% CI, 1.44-3.22]; no diabetes: OR, 2.31 [95%CI, 1.76-3.03]; P = 0.72 for interaction). Among participants without diabetes, there were also significant associations of NT-proBNP (OR, 1.40 [95% CI, 1.08-1.81]) and urine albumin-to-creatinine ratio (OR, 1.55 [95% CI, 1.22-1.97]) with PN. Associations of hyperglycemia biomarkers including Hb A1c (OR, 1.76 [95% CI, 1.22-2.54]), fructosamine (OR, 1.71 [95% CI, 1.19-2.46]), and glycated albumin (OR, 1.45 [95% CI, 1.03-2.03]) with PN were significant only among participants with diabetes.
Conclusions: Overall, hs-cTnT appears to be a global marker of end organ damage, including PN. Laboratory biomarkers may be able to help us identify those individuals with PN.
Keywords: ARIC; NT-proBNP; biomarker; diabetes; hs-cTnT; peripheral neuropathy.
© American Association for Clinical Chemistry 2020. All rights reserved. For permissions, please email: journals.permissions@oup.com.
Figures
Comment in
-
Peripheral Neuropathy-Time for Better Biomarkers?Clin Chem. 2020 May 1;66(5):638-640. doi: 10.1093/clinchem/hvaa075. Clin Chem. 2020. PMID: 32300787 No abstract available.
References
-
- Gregg EW, Gu Q, Williams D, de Rekeneire N, Cheng YJ, Geiss L, Engelgau M.. Prevalence of lower extremity diseases associated with normal glucose levels, impaired fasting glucose, and diabetes among U.S. adults aged 40 or older. Diabetes Res Clin Pract 2007;77:485–8. - PubMed
-
- Young MJ, Boulton AJ, MacLeod AF, Williams DR, Sonksen PH.. A multicentre study of the prevalence of diabetic peripheral neuropathy in the United Kingdom hospital clinic population. Diabetologia 1993;36:150–4. - PubMed
-
- Koenig W. Update on integrated biomarkers for assessment of long-term risk of cardiovascular complications in initially healthy subjects and patients with manifest atherosclerosis. Ann Med 2009;41:332–43. - PubMed
-
- Wollert KC, Kempf T, Wallentin L.. Growth differentiation factor 15 as a biomarker in cardiovascular disease. Clin Chem 2017;63:140–51. - PubMed
Publication types
MeSH terms
Substances
Grants and funding
LinkOut - more resources
Full Text Sources
Medical
Research Materials
