

Prognostic value of intermediate age-related macular degeneration phenotypes for geographic atrophy progression
- PMID: 32269061
- PMCID: PMC7848046
- DOI: 10.1136/bjophthalmol-2020-316004
Prognostic value of intermediate age-related macular degeneration phenotypes for geographic atrophy progression
Abstract
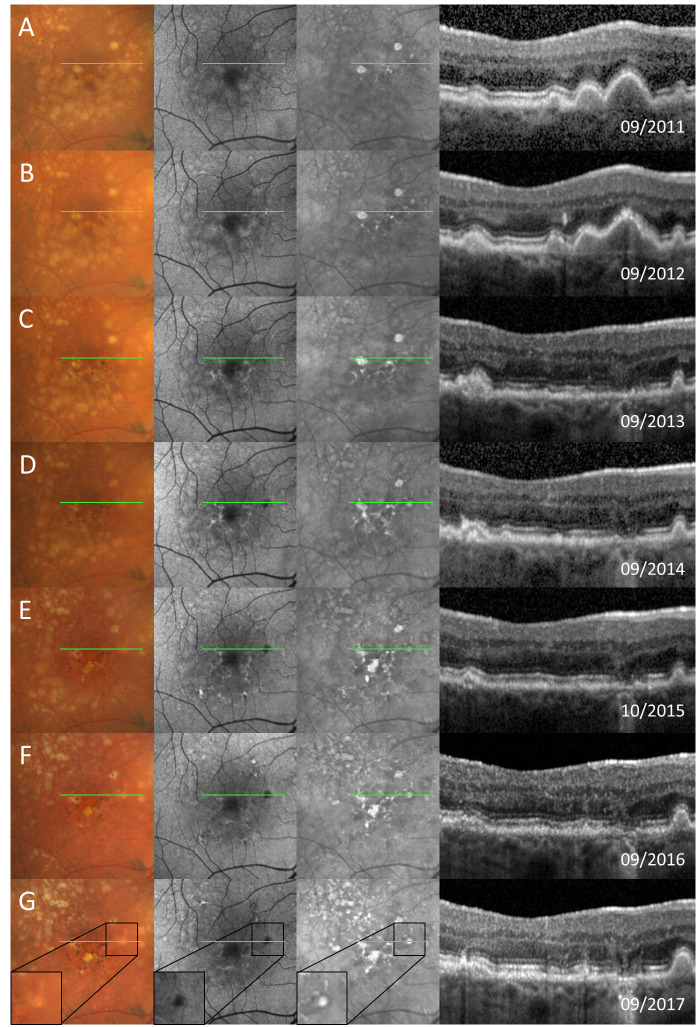
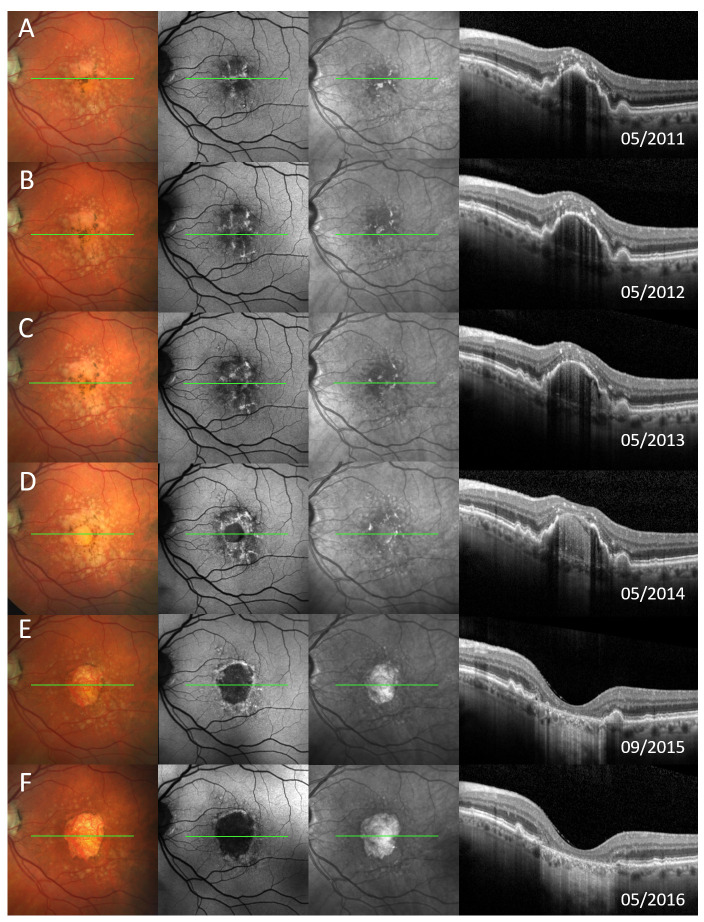
Background: To characterise early stages of geographic atrophy (GA) development in age-related macular degeneration (AMD) and to determine the prognostic value of structural precursor lesions in eyes with intermediate (i) AMD on the subsequent GA progression.
Methods: Structural precursor lesions for atrophic areas (lesion size at least 0.5 mm² in fundus autofluorescence images) were retrospectively identified based on multimodal imaging and evaluated for association with the subsequent GA enlargement rates (square-root transformed, sqrt). A linear mixed-effects model was used to account for the hierarchical nature of the data with a Tukey post hoc test to assess the impact of the local precursor on the subsequent GA progression rate.
Results: A total of 39 eyes with GA of 34 patients with a mean age of 74.4±6.7 (±SD) years were included in this study. Five precursor lesions (phenotypes 1-5) preceding GA development were identified: large, sub-retinal pigment epithelial drusen (n=19), reticular pseudodrusen (RPD, n=10), refractile deposits (n=4), pigment epithelial detachment (n=4) and vitelliform lesions (n=2). Precursor lesions exhibited a significant association with the subsequent (sqrt) GA progression rates (p=0.0018) with RPD (phenotype 2) being associated with the fastest GA enlargement (2.29±0.52 (±SE) mm/year.
Conclusions: The results indicate the prognostic relevance of iAMD phenotyping for subsequent GA progression highlighting the role of structural AMD features across different AMD stages.
Keywords: degeneration; imaging; macula; retina.
© Author(s) (or their employer(s)) 2021. Re-use permitted under CC BY-NC. No commercial re-use. See rights and permissions. Published by BMJ.
Conflict of interest statement
Competing interests: Non-financial support from Heidelberg Engineering to ST, MP; from CenterVue to ST, MP and MF; from Optos to ST, SS-V and MF. Grant from German Research Foundation (PF 950/1-1 to MP and FL 658/4-1 and Fl658/4-2 to MF); grant from Katairo to SS-V; from Acucela, CenterVue to SS-V and FGH; from Zeiss, Optos, NightStar X and Bioeq/Formycon to FGH. Personal fees from Heidelberg Engineering, Bayer and Novartis to ST; from Bioeq/Formycon, Galimedix to SS-V; from Pixium Vision, Lin Bioscience, Oxurion, Stealth Therapeutics, Kodiak to FGH. Patent pending: US20140303013A1 from MF.
Figures


Similar articles
-
Peripheral Retinal Changes Associated with Age-Related Macular Degeneration in the Age-Related Eye Disease Study 2: Age-Related Eye Disease Study 2 Report Number 12 by the Age-Related Eye Disease Study 2 Optos PEripheral RetinA (OPERA) Study Research Group.Ophthalmology. 2017 Apr;124(4):479-487. doi: 10.1016/j.ophtha.2016.12.004. Epub 2017 Jan 12. Ophthalmology. 2017. PMID: 28089680 Clinical Trial.
-
Optical Coherence Tomography Reflective Drusen Substructures Predict Progression to Geographic Atrophy in Age-related Macular Degeneration.Ophthalmology. 2016 Dec;123(12):2554-2570. doi: 10.1016/j.ophtha.2016.08.047. Epub 2016 Oct 25. Ophthalmology. 2016. PMID: 27793356 Free PMC article.
-
Characteristics and Spatial Distribution of Structural Features in Age-Related Macular Degeneration: A MACUSTAR Study Report.Ophthalmol Retina. 2023 May;7(5):420-430. doi: 10.1016/j.oret.2022.12.007. Epub 2022 Dec 20. Ophthalmol Retina. 2023. PMID: 36563964
-
Structural OCT and OCT angiography biomarkers associated with the development and progression of geographic atrophy in AMD.Graefes Arch Clin Exp Ophthalmol. 2024 Nov;262(11):3421-3436. doi: 10.1007/s00417-024-06497-8. Epub 2024 Apr 30. Graefes Arch Clin Exp Ophthalmol. 2024. PMID: 38689123 Free PMC article. Review.
-
The Progression of Geographic Atrophy Secondary to Age-Related Macular Degeneration.Ophthalmology. 2018 Mar;125(3):369-390. doi: 10.1016/j.ophtha.2017.08.038. Epub 2017 Oct 27. Ophthalmology. 2018. PMID: 29110945 Review.
Cited by
-
Subretinal drusenoid deposits: An update.Taiwan J Ophthalmol. 2022 May 26;12(2):138-146. doi: 10.4103/tjo.tjo_18_22. eCollection 2022 Apr-Jun. Taiwan J Ophthalmol. 2022. PMID: 35813798 Free PMC article. Review.
-
AI-based support for optical coherence tomography in age-related macular degeneration.Int J Retina Vitreous. 2024 Apr 8;10(1):31. doi: 10.1186/s40942-024-00549-1. Int J Retina Vitreous. 2024. PMID: 38589936 Free PMC article. Review.
-
Ellipsoid zone reflectivity as a functional imaging biomarker for age-related macular degeneration: a MACUSTAR study report.Sci Rep. 2025 Jun 20;15(1):20093. doi: 10.1038/s41598-025-00735-7. Sci Rep. 2025. PMID: 40542004 Free PMC article.
-
Association between Subretinal Drusenoid Deposits and Age-Related Macular Degeneration in Multimodal Retinal Imaging.J Clin Med. 2023 Dec 16;12(24):7728. doi: 10.3390/jcm12247728. J Clin Med. 2023. PMID: 38137797 Free PMC article.
-
Reticular Pseudodrusen Status, ARMS2/HTRA1 Genotype, and Geographic Atrophy Enlargement: Age-Related Eye Disease Study 2 Report 32.Ophthalmology. 2023 May;130(5):488-500. doi: 10.1016/j.ophtha.2022.11.026. Epub 2022 Dec 6. Ophthalmology. 2023. PMID: 36481221 Free PMC article.
References
-
- Resnikoff S, Pascolini D, Etya'ale D, et al. . Global data on visual impairment in the year 2002. Bull World Health Organ 2004;82:844–51. doi:/S0042-96862004001100009 - PMC - PubMed
Publication types
MeSH terms
LinkOut - more resources
Full Text Sources
Medical