. 2020 May 15;368(6492):742-746.
doi: 10.1126/science.abb4557. Epub 2020 Apr 8.

Effective containment explains subexponential growth in recent confirmed COVID-19 cases in China

Affiliations

Effective containment explains subexponential growth in recent confirmed COVID-19 cases in China

Benjamin F Maier et al. Science. .

Abstract

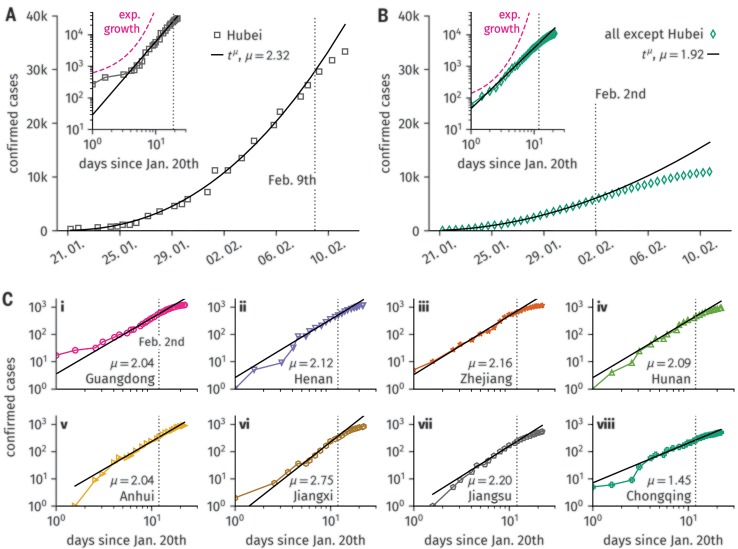
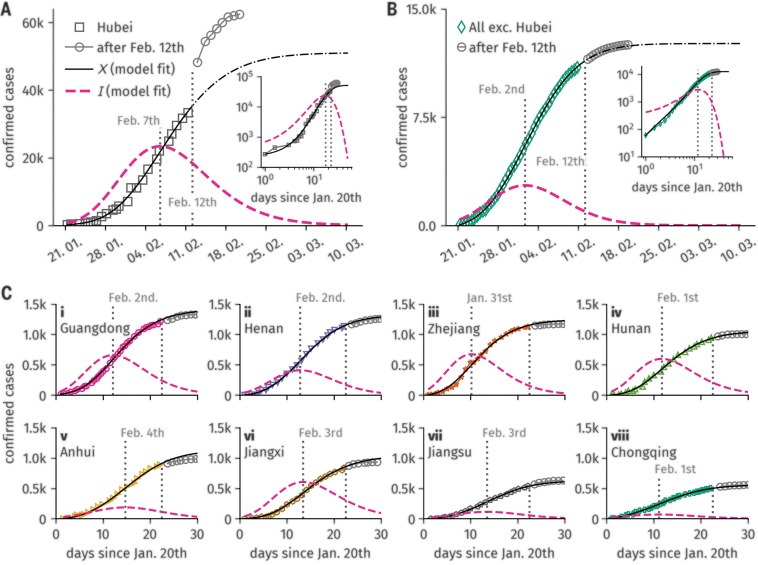
The recent outbreak of coronavirus disease 2019 (COVID-19) in mainland China was characterized by a distinctive subexponential increase of confirmed cases during the early phase of the epidemic, contrasting with an initial exponential growth expected for an unconstrained outbreak. We show that this effect can be explained as a direct consequence of containment policies that effectively deplete the susceptible population. To this end, we introduce a parsimonious model that captures both quarantine of symptomatic infected individuals, as well as population-wide isolation practices in response to containment policies or behavioral changes, and show that the model captures the observed growth behavior accurately. The insights provided here may aid the careful implementation of containment strategies for ongoing secondary outbreaks of COVID-19 or similar future outbreaks of other emergent infectious diseases.


Figures

Fig. 1
Fig. 1. Confirmed cases of COVID-19 infections.
C(t) in mainland China in late January–early February. (A) Confirmed case numbers in Hubei. The increase in cases follows a scaling law tµ with an exponent µ = 2.32 after a short initial exponential growth phase. On 9 February, the case count starts deviating toward lower values. (B) Aggregated confirmed cases in all other affected provinces except Hubei. C(t) follows a scaling law with exponent µ = 1.92 until 2 February when case counts deviate to lower values. The insets in (A) and (B) depict C(t) on a log-log scale and show example exponential growth curves for comparison. (C) Confirmed cases as a function of time for the eight remaining most affected provinces in China. The curves roughly follow a scaling law with exponents µ ≈ 2 with the exception of Chongqing Province (µ = 1.45) and Jiangxi Province (µ = 2.75).
Fig. 2
Fig. 2. Case numbers in Hubei compared to model predictions.
The quarantined compartment X(t) and the unidentified infectious compartment I(t) are obtained from fits to the model defined by Eqs. 1 to 4 as described in the materials and methods. All fits were performed for case numbers predating 12 February at which the case number definition was temporarily changed for Hubei, adding ~15,000 cases at once. Consequently, confirmed case numbers after 12 February are well captured by the model for all provinces except Hubei. Fit parameters are given in table S1. (A) In Hubei, the model captures both the initial rise of confirmed cases as well as the subsequent algebraic growth. The confirmed cases were predicted to saturate at C = 51,000. The model also predicts the time course of the number of unidentified infectious individuals I(t) which peaks on 7 February and declines exponentially afterwards. Although the magnitude of I(t) is associated with rather large fluctuations due to uncertainties in the fitting parameters, the predicted peak time is robust, consistently around 7 February. (B) Model prediction for case numbers aggregated over all affected provinces other than Hubei. The case numbers’ algebraic growth is well reflected and predicted to saturate at C = 12,600. In contrast to Hubei, the fraction of unidentified infecteds peaks around 1 February, ~1 week earlier. The insets in (A) and (B) depict both data and fits on a log-log scale. (C) Fits for confirmed cases as a function of time for the remaining eight most affected provinces in China. All curves are well captured by the model fits that predict similar values for the peak time of unidentified infecteds.

References

    1. Cohen J., Scientists are racing to model the next moves of a coronavirus that’s still hard to predict. Science (2020); 10.1126/science.abb2161. 10.1126/science.abb2161 - DOI - DOI
    1. WHO, Novel coronavirus (2019-nCoV) situation report - 11 (2020).
    1. WHO, Coronavirus disease 2019 (COVID-19) situation report - 51 (2020).
    1. CDC, 2019 Novel coronavirus (2019-nCoV); https://www.cdc.gov/coronavirus/2019-ncov/about/symptoms.html (accessed 13 February 2020).
    1. Hsu J., Here’s how computer models simulate the future spread of new coronavirus. Sci. Am. (13 February 2020).

Publication types

MeSH terms