. 2020 May 6;40(19):3849-3861.
doi: 10.1523/JNEUROSCI.2149-19.2020. Epub 2020 Apr 8.

Neonatal Stroke and TLR1/2 Ligand Recruit Myeloid Cells through the Choroid Plexus in a CX3CR1-CCR2- and Context-Specific Manner

Affiliations

Neonatal Stroke and TLR1/2 Ligand Recruit Myeloid Cells through the Choroid Plexus in a CX3CR1-CCR2- and Context-Specific Manner

Aditya Rayasam et al. J Neurosci. .

Abstract

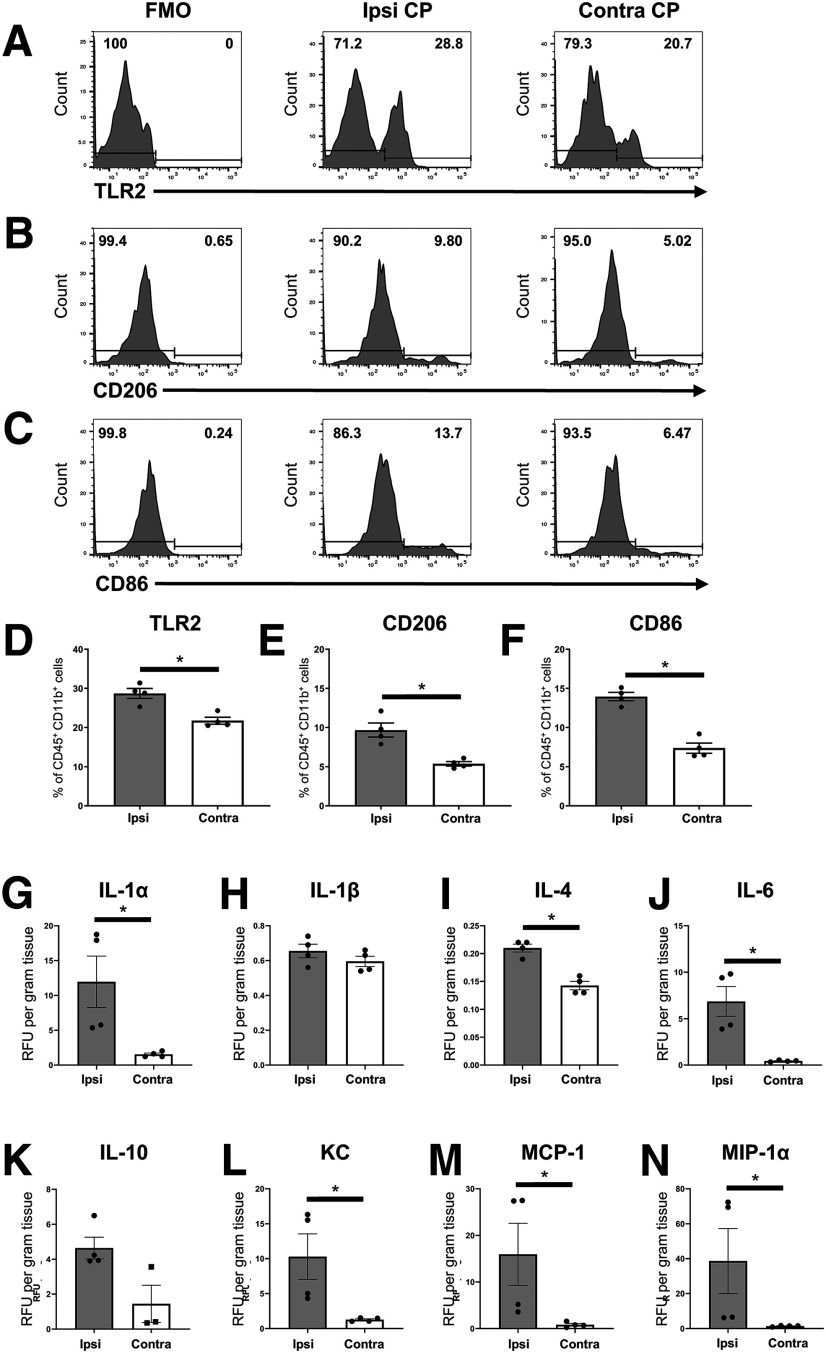
Neonatal stroke is as frequent as stroke in the elderly, but many pathophysiological injury aspects are distinct in neonates, including immune signaling. While myeloid cells can traffic into the brain via multiple routes, the choroid plexus (CP) has been identified as a uniquely educated gate for immune cell traffic during health and disease. To understand the mechanisms of myeloid cell trafficking via the CP and their influence on neonatal stroke, we characterized the phenotypes of CP-infiltrating myeloid cells after transient middle cerebral artery occlusion (tMCAO) in neonatal mice of both sexes in relation to blood-brain barrier permeability, injury, microglial activation, and CX3CR1-CCR2 signaling, focusing on the dynamics early after reperfusion. We demonstrate rapid recruitment of multiple myeloid phenotypes in the CP ipsilateral to the injury, including inflammatory CD45+CD11b+Ly6chighCD86+, beneficial CD45+CD11b+Ly6clowCD206+, and CD45+CD11b+Ly6clowLy6ghigh cells, but only minor leukocyte infiltration into acutely ischemic-reperfused cortex and negligible vascular albumin leakage. We report that CX3CR1-CCR2-mediated myeloid cell recruitment contributes to stroke injury. Considering the complexity of inflammatory cascades triggered by stroke and a role for TLR2 in injury, we also used direct TLR2 stimulation as an independent injury model. TLR2 agonist rapidly recruited myeloid cells to the CP, increased leukocytosis in the CSF and blood, but infiltration into the cortex remained low over time. While the magnitude and the phenotypes of myeloid cells diverged between tMCAO and TLR2 stimulation, in both models, disruption of CX3CR1-CCR2 signaling attenuated both monocyte and neutrophil trafficking to the CP and cortex.SIGNIFICANCE STATEMENT Stroke during the neonatal period leads to long-term disabilities. The mechanisms of ischemic injury and inflammatory response differ greatly between the immature and adult brain. We examined leukocyte trafficking via the choroid plexus (CP) following neonatal stroke in relation to blood-brain barrier integrity, injury, microglial activation, and signaling via CX3CR1 and CCR2 receptors, or following direct TLR2 stimulation. Ischemia-reperfusion triggered marked unilateral CX3CR1-CCR2 dependent accumulation of diverse leukocyte subpopulations in the CP without inducing extravascular albumin leakage or major leukocyte infiltration into the brain. Disrupted CX3CR1-CCR2 signaling was neuroprotective in part by attenuating monocyte and neutrophil trafficking. Understanding the migratory patterns of CP-infiltrating myeloid cells with intact and disrupted CX3CR1-CCR2 signaling could identify novel therapeutic targets to protect the neonatal brain.

Keywords: immune; inflammation; ischemia; microglia; perinatal.


Figures

Figure 1.
Figure 1.
A robust CX3CR1-CCR2-dependent accumulation of myeloid cells in the ipsilateral CP of neonatal mice subjected to tMCAO followed by 3 h of reperfusion. A, Representative images of GLUT-1-immunostained CPs ipsilateral and contralateral to tMCAO in GFP/+/RFP/+ and GFP/GFP/RFP/RFP mice. Scale bar, 50 µm. Dashed white lines indicate areas where cells were counted. Black box on histologic section represents where images were taken. B, C, Quantification of the number of GFP+ cells (B) and RFP+ cells (C) in ipsilateral and contralateral CPs from GFP/+/RFP/+ and GFP/GFP/RFP/RFP mice subjected to tMCAO or sham surgery. D-H, Characterization of myeloid cells from dissociated CPs by flow cytometry. Gating strategy to identify CD45+CD11b+ cells (D) and CD45+11b+Ly6g+ and CD45+11b+Ly6c+ cells (E) from ipsilateral and contralateral CPs ofGFP/+/RFP/+ mice (top row) and GFP/GFP/RFP/GFP mice (bottom row). E, Data originate from CD45+CD11b+ gate in D. F-H. Quantification of CD45+CD11b+ cells (F), CD45+CD11b+Ly6g+ cells (G), and CD45+CD11b+Ly6c+ cells (H). B, C, F-H, *p < 0.05; **p < 0.01; ***p < 0.001; ****p < 0.0001; two-way ANOVA with Tukey's Multiple Comparison post hoc test.
Figure 2.
Figure 2.
Gradual CX3CR1-CCR2-dependent morphologic transformation of CX3CR1+ cells and small but significant accumulation of myeloid cells in the ipsilateral cortex 3 h after reperfusion. A, Representative images of GLUT-1-immunostained sections of CX3CR1+ and CCR2+ cells in ipsilateral and contralateral cortex in GFP/+/RFP/+ and GFP/GFP/RFP/RFP mice. Images are taken in the same coronal sections shown in Figure 1. Scale bar, 50 µm. Black box on histologic section represents where images were taken. B, C, Quantification of the number of GFP+ (B) and RFP+ (C) cells in the ipsilateral and contralateral cortex from GFP/+/RFP/+ and GFP/GFP/RFP/RFP mice subjected to tMCAO or sham surgery. D-I, Characterization of myeloid cells from dissociated cortical regions by flow cytometry. D, Gating strategy to identify CD45intCD11b+ and CD45highCD11b+ cells. E, Gating strategy for CD45+11b+Ly6g+ and CD45+11b+Ly6c+ cells. Data originate from D. F-I, Quantification of CD45intCD11b+ cells (F), CD45highCD11b+ cells (G), CD45highCD11b+Ly6g+ cells (H), and CD45highCD11b+Ly6c+ cells (I) in the ipsilateral and contralateral cortices. Data are mean ± SEM. B, C, F-I, *p < 0.05; **p < 0.01; ***p < 0.001; ****p < 0.0001; two-way ANOVA with Tukey's Multiple Comparison post hoc test.
Figure 3.
Figure 3.
Identification of the origin of CX3CR1+ cells 3 h after reperfusion and effects of CX3CR1-CCR2 dysfunction on BBB integrity and subchronic injury. A, B, Representative images of CX3CR1+, CCR2+, 4D4+, and merged CX3CR1+/CCR2+/4D4+/GLUT-1+ in the ipsilateral (A) and contralateral (B) cortex in sections adjacent to those shown in Figure 2. White boxes represent higher-magnification images from areas shown in respective bottom rows. C, D, Representative images of ipsilateral (C) and contralateral (D) cortical regions immunolabeled with microglia-specific markers TMEM119 and P2RY12. Blue represents GLUT-1+ vasculature. Scale bar, 30 µm. Note similar branched patterns of CX3CR1+ in A and C. E, Occasional 4D4+CX3CR1+ colabeled cells are observed in the CP from GFP/+/RFP/+ mice. Scale bar, 50 µm. F, Quantification of CX3CR1+/4D4+ cells in the ipsilateral and contralateral cortex and CPs in GFP/+/RFP/+ mice. G, H, Representative images of intravascular appearance of Alexa647-albumin in both ipsilateral and contralateral cortex of GFP/+/RFP/+ mice 3 h after reperfusion. G, Inset, High-magnification images. Scale bar, 30 µm. H, Quantification of percent of GLUT-1+ vessels perfused with Alexa647-albumin in ipsilateral cortex inGFP/+/RFP/+ mice. I, J, Representative images of cresyl violet-stained sections (I) and quantification of injury volume (J) in WT and GFP/GFP/RFP/RFP mice 72 h after reperfusion. F, J, *p < 0.05; **p < 0.01; Student's t test with Mann–Whitney U post hoc test.
Figure 4.
Figure 4.
Expression of TLR2, CD206, and CD86 on myeloid cells is increased in the ipsilateral CP 3 h after reperfusion. A-C, Representative flow cytometry histograms for TLR2 (A), CD206 (B), and CD86 (C) in Fluorescence Minus One controls (left), ipsilateral CP (middle), and contralateral CP (right) in WT mice. Gate: CD45+CD11b+ cells. D-F, Quantification of data in A-C. Compared with contralateral CPs, the number of TLR2+ (D), CD206+ (E), and CD86+ (F) cells is significantly increased in the ipsilateral CP in WT mice. G-N, Multiplex cytokine assay to measure IL-1α (G), IL-1β (H), IL-4 (I), IL-6 (J), IL-10 (K), KC (L), MCP-1 (M), and MIP-1α (N) in ipsilateral and contralateral WT cortex. D-N, *p < 0.05; Student's t test with Mann–Whitney U post hoc test.
Figure 5.
Figure 5.
TLR1/2 ligand PAM induces robust CX3CR1-CCR2-dependent accumulation of myeloid cells in the CP within 6 h. A, Representative images of CX3CR1+ and CCR2+ cells in GLUT-1-immunostained CPs of PAM- and PBS-treated GFP/+/RFP/+ and GFP/GFP/RFP/RFP mice. Scale bar, 50 µm. Black box on histologic section represents areas where images were taken. Dashed white lines indicate areas where cells were counted. B, C, Quantification of the number of CX3CR1+ (B) and CCR2+ (C) cells in PAM- and PBS-treated CPs from GFP/+/RFP/+ mice and GFP/GFP/RFP/RFP mice. D-H, Characterization of myeloid cells from dissociated CPs by flow cytometry. Gating strategy to identify CD45+CD11b+ cells (D) and CD45+11b+Ly6g+ and CD45+11b+Ly6c+ cells (E) from PAM- and PBS-treated CX3CR1GFP/+CCR2RFP/+ mice (top row) and CX3CR1GFP/GFPCCR2RFP/GFP mice (bottom row). E, Data originate from CD45+CD11b+ gate in D. F-H. Quantification of CD45+CD11b+ (F), CD45+CD11b+Ly6g+ (G), and CD45+CD11b+Ly6c+ (H) cells. B, C, F-H, *p < 0.05; **p < 0.01; ***p < 0.001; ****p < 0.0001; two-way ANOVA with Tukey's Multiple Comparison post hoc test.
Figure 6.
Figure 6.
PAM induces gradual CX3CR1-CCR2-dependent microglial activation and small increase in myeloid cell number in the cortex at 6 h. A, Representative images of CX3CR1+ and CCR2+ cells in the cortex in PAM- or PBS-treated GFP/+/RFP/+ and GFP/GFP/RFP/RFP mice. Scale bar, 50 µm. Black box on histologic section represents where images were taken. Dashed white lines indicate areas where cells were counted. B, C, Quantification of the number of CX3CR1+ (B) and CCR2+ (C) cells in the cortex of PAM- and PBS-treated GFP/+/RFP/+ mice and GFP/GFP/RFP/RFP mice. D-I, Characterization of microglial cells and myeloid cells by flow cytometry in PAM- and PBS-treated GFP/+/RFP/+ mice (top row) and GFP/GFP/RFP/GFP mice (bottom row). D, Gating strategy to identify CD45intCD11b+ and CD45highCD11b+ cells. E, Gating strategy for CD45+CD 11b+Ly6g+ and CD45+CD 11b+Ly6c+ cells. F, G, Quantification of gradual CD45 acquisition from CD45intCD11b+ (F) to CD45highCD11b+ (G). H, I, Quantification of CD45+CD11b+Ly6g+ (H) and CD45+CD11b+Ly6c+ (I) cells in the cortex. B, C, F-I, *p < 0.05; **p < 0.01; ***p < 0.001; ****p < 0.0001; two-way ANOVA with Tukey's Multiple Comparison post hoc test.
Figure 7.
Figure 7.
Disruption of CX3CR1-CCR2 signaling attenuates PAM-induced accumulation of CXCR2 expression on neutrophils in the blood and the CP within 6 h. A, Gating strategy in CSF and blood samples. B-E, Quantification for CD45highCD11b+ cells (B), CD45highCD11b+Ly6g+ cells (C), CD45highCD11b+Ly6g+CXCR2+ cells (D), and CD45highCD11b+Ly6c+ cells (E) in CSF of PAM- and PBS-treated WT mice. F-I, Quantification for CD45highCD11b+ cells (F), CD45highCD11b+Ly6g+ cells (G), CD45highCD11b+Ly6g+CXCR2+ cells (H), and CD45highCD11b+Ly6c+ cells (I) in blood of PAM- and PBS-treated WT and GFP/GFP/RFP/RFP mice. J, Quantification of CD45highCD11b+Ly6g+CXCR2+ cells in the CP of PAM- and PBS-treated WT and GFP/GFP/RFP/RFP mice. *p < 0.05; **p < 0.01; ***p < 0.001; ****p < 0.0001; Student's t test with Mann–Whitney U post hoc test (B-E) and two-way ANOVA with Tukey's Multiple Comparison post hoc test (F-J).
Figure 8.
Figure 8.
PAM and tMCAO trigger separate patterns of pro- and anti-inflammatory myeloid phenotypes in the CP. AB, Gating strategy for CD206+IL-10+ (A) and CD86+IL-1β+ (B) cells from CD45+CD11b+ population. Cells were obtained 6 hours after PAM/PBS and 3 hours after reperfusion in WT mice. CD. Quantification of CD11b+CD45+CD206+IL-10+ cells (in (C) PAM Vs. PBS WT CPs and (D) ipsilateral Vs. contralateral CPs of WT mice. EF. (Quantification of CD11b+CD45+CD86+IL-1β+cells in (E) PAM Vs. PBS WT CPs and (F) ipsilateral Vs. contralateral CPs of WT mice. Student's t Test with Mann-Whitney U post-hoc test was performed for C–F (*p < 0.05, **p < 0.01, ***p < 0.001, ****p < 0.0001).
Figure 9.
Figure 9.
tMCAO and PAM trigger distinct patterns of myeloid cells in the CP and cortex at 16 h. A, B, Quantification of the number of CX3CR1+ (A) and CCR2+ (B) cells in the CPs and the cortex 16 h after PAM/PBS treatment of GFP/+/RFP/+ mice. C, D, In the cortex, calculation is based on the number of cells/tissue volume. Quantification of the number of CX3CR1+ (C) and CCR2+ (D) cells in ipsilateral and contralateral region 13 h after tMCAO in GFP/+/RFP/+ mice. In the CPs, calculation is based on the number of cells/100 µm3/GLUT-1 volume. Quantification of CD45highCD11b+ cells 16 h after PAM or PBS in the CP and cortex (E) and at 13 h reperfusion following tMCAO in the ipsilateral and contralateral CPs and cortices of WT mice (F). Data are mean ± SEM. A-D, *p < 0.05; ****p < 0.0001; Student's t test with Mann–Whitney U post hoc test.

Similar articles

Cited by

References

    1. Aghaeepour N, Finak G, FlowCAP Consortium, Dream Consortium, Hoos H, Mosmann TR, Brinkman R, Gottardo R, Scheuermann RH, et al. (2013) Critical assessment of automated flow cytometry data analysis techniques. Nat Methods 10:228–238. 10.1038/nmeth.2365 - DOI - PMC - PubMed
    1. Andrade EB, Alves J, Madureira P, Oliveira L, Ribeiro A, Cordeiro-da-Silva A, Correia-Neves M, Trieu-Cuot P, Ferreira P (2013) TLR2-induced IL-10 production impairs neutrophil recruitment to infected tissues during neonatal bacterial sepsis. J Immunol 191:4759–4768. 10.4049/jimmunol.1301752 - DOI - PubMed
    1. Baruch K, Schwartz M (2013) CNS-specific T cells shape brain function via the choroid plexus. Brain Behav Immun 34:11–16. 10.1016/j.bbi.2013.04.002 - DOI - PubMed
    1. Bennett ML, Bennett FC, Liddelow SA, Ajami B, Zamanian JL, Fernhoff NB, Mulinyawe SB, Bohlen CJ, Adil A, Tucker A, Weissman IL, Chang EF, Li G, Grant GA, Hayden Gephart MG, Barres BA (2016) New tools for studying microglia in the mouse and human CNS. Proc Natl Acad Sci USA 113:E1738–E1746. 10.1073/pnas.1525528113 - DOI - PMC - PubMed
    1. Bohacek I, Cordeau P, Lalancette-Hebert M, Gorup D, Weng YC, Gajovic S, Kriz J (2012) Toll-like receptor 2 deficiency leads to delayed exacerbation of ischemic injury. J Neuroinflammation 9:191 10.1186/1742-2094-9-191 - DOI - PMC - PubMed

Publication types