. 2020 Apr 8;12(538):eaay1620.
doi: 10.1126/scitranslmed.aay1620.

Kidney tissue hypoxia dictates T cell-mediated injury in murine lupus nephritis

Affiliations

Kidney tissue hypoxia dictates T cell-mediated injury in murine lupus nephritis

Ping-Min Chen et al. Sci Transl Med. .

Abstract

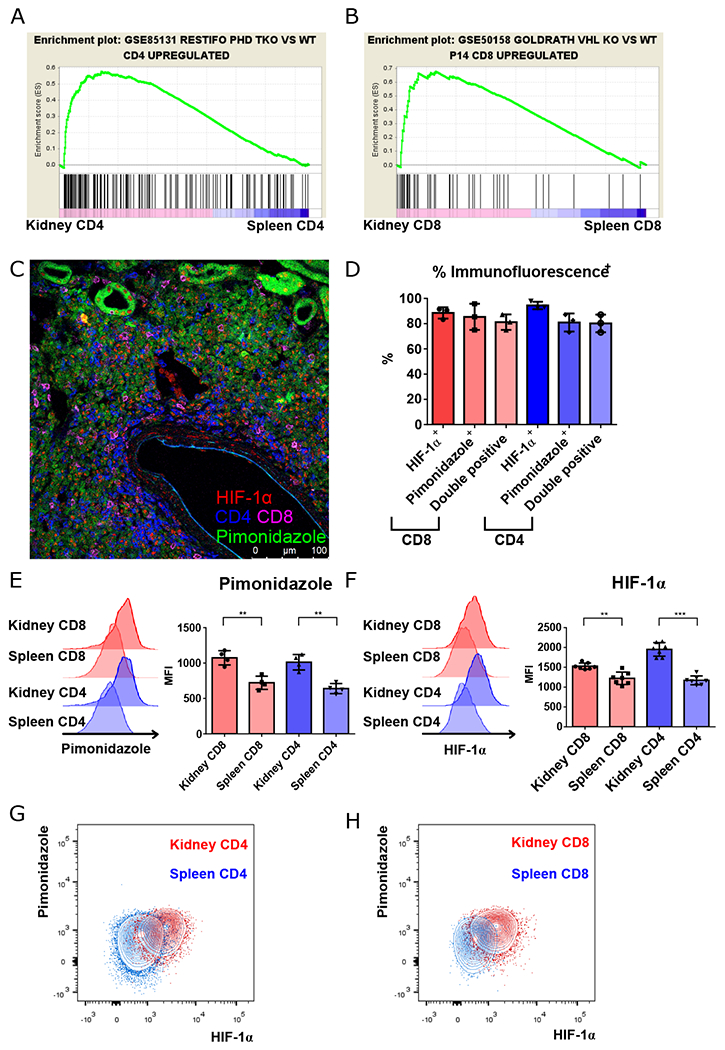
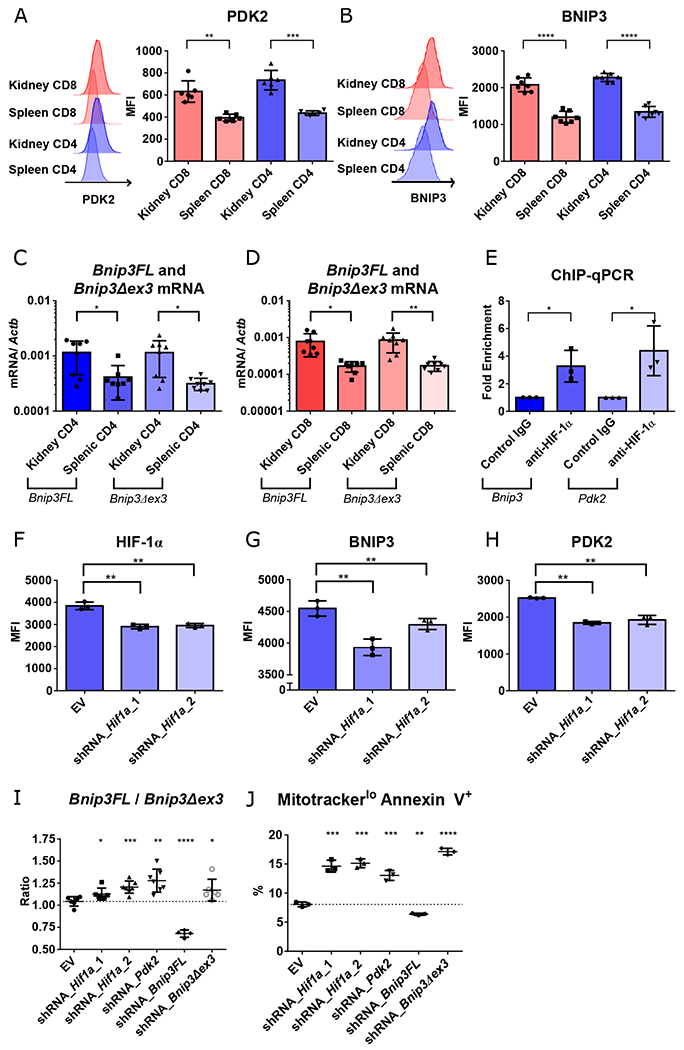
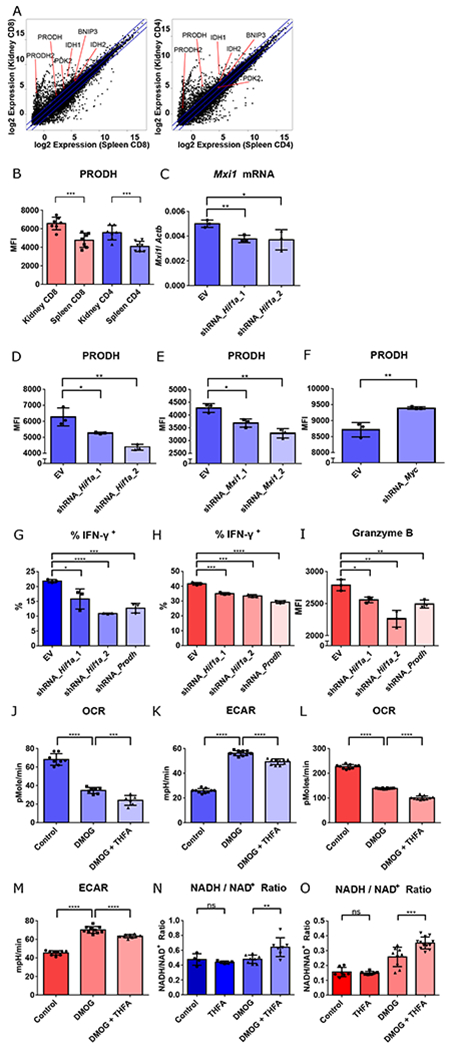
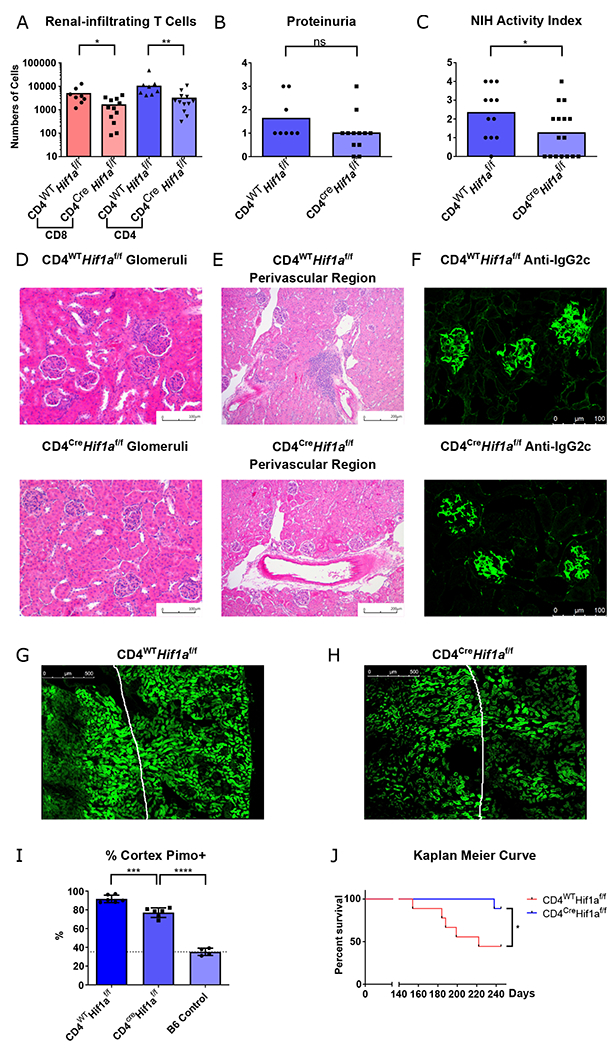
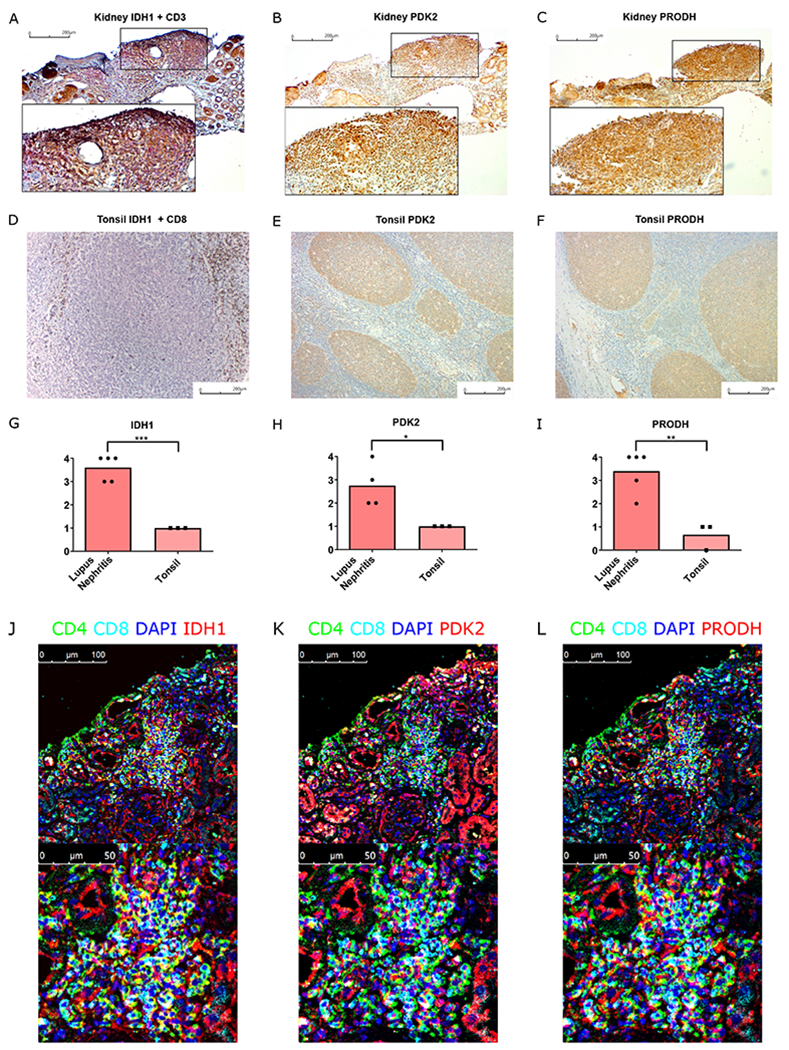
The kidney is a frequent target of autoimmune injury, including in systemic lupus erythematosus; however, how immune cells adapt to kidney's unique environment and contribute to tissue damage is unknown. We found that renal tissue, which normally has low oxygen tension, becomes more hypoxic in lupus nephritis. In the injured mouse tissue, renal-infiltrating CD4+ and CD8+ T cells express hypoxia-inducible factor-1 (HIF-1), which alters their cellular metabolism and prevents their apoptosis in hypoxia. HIF-1-dependent gene-regulated pathways were also up-regulated in renal-infiltrating T cells in human lupus nephritis. Perturbation of these environmental adaptations by selective HIF-1 blockade inhibited infiltrating T cells and reversed tissue hypoxia and injury in murine models of lupus. The results suggest that targeting HIF-1 might be effective for treating renal injury in autoimmune diseases.


Conflict of interest statement

Competing Interests: J.C. received research funding from AbbVie which was used to partially support this work.

Figures

Fig. 1.
Fig. 1.. Renal-infiltrating T cells are located in areas of hypoxia.
A, B. GSEA plots comparing gene signatures of renal-infiltrating CD4+ and CD8+ T cells, to splenic to CD4+ and CD8+ T cells, respectively, based upon the hypoxia signatures generated by comparing triple PHD (prolyl-4-hydroxylase domain proteins)-knockout CD4+ to wild type CD4+ T cells, and comparing VHL (Von-Hippel Lindau) tumor suppressor knockout CD8+ T cells to lymphocytic choriomenigitis virus specific P14 TCR transgenic CD8+ T cells taken from virally-infected mice. C. Representative confocal microscopy of lymphocytic aggregates of CD4+ (blue) and CD8+ T cells (magenta) with HIF-1α nuclear staining (red) located in regions of hypoxia (pimonidazole, green). D. Summary of nuclear HIF-1α and pimonidazole staining, and combined staining of CD4+ and CD8+ T cells within renal lymphocytic aggregates. E, F. Representative data and summary of pimonidazole and HIF-1α staining of activated (CD44hi) splenic vs. renal CD4+ and CD8+ T cells isolated from kidneys of 16-18-week-old MRL/lpr mice (n = 4 and 8, respectively). G, H. Representative data of pimonidazole and HIF-1α staining in kidney versus spleen CD4+ (G) and CD8+ T cells (H) as in (E) and (F). Representative of 3 experiments, n = 4 to 8 animals per group. Data shown are mean ± s.d.; statistical analysis by two-tailed paired t-test (E, F). **p < 0.01, ***p < 0.001.
Fig. 2.
Fig. 2.. Renal T cells survive in hypoxia through Bnip3 alternative splicing mediated by HIF-1 dependent PDK2.
A-B. Representative data and summary of PDK2 (A) and BNIP3 (B) expression in activated (CD44hi) splenic vs. renal CD4+ and CD8+ T cells isolated from kidneys of 16-18-week-old MRL/lpr mice (n = 6, 7, respectively). C-D. Quantification of two forms of Bnip3 transcripts, full length (Bnip3FL) and exon 3 deleted (Bnip3Δex3) in CD4+ (C) and CD8+ T cells (D) (n = 8). E. Binding of HIF-1α to Bnip3 and Pdk2 promoter regions, as determined by chromatin immunoprecipitation (ChIP) and quantitative real-time PCR (qPCR). F-H. Mean fluorescence intensity of HIF-1α (F), BNIP3 (G), and PDK2 (H) in Th1-activated CD4+ T cells transduced with empty vector (EV), or two different constructs of Hif1α knockdowns after 2 days in hypoxic cultures. I. Ratio of Bnip3FL and Bnip3Δex3 mRNAs in Th1-activated CD4+ T cells transduced with either EV or knockdown constructs targeting Hif1a, Pdk2, Bnip3FL, or Bnip3Δex3 one day after adding DMOG. J. Percentage of mitotracker deep redlo annexin V+ cells of Th1-activated CD4+ T cells transduced with knockdown vectors after 3 days of hypoxic culture. Data shown are mean ± s.d.; statistical analysis by two-tailed paired t-test (A-E) and unpaired t-test (F-J). *p < 0.05, **p < 0.01, ***p < 0.001, ****p < 0.0001.
Fig. 3.
Fig. 3.. T cell effector function in hypoxia is mediated by HIF-1 regulated proline metabolism facilitating glycolysis.
A. RNA-seq gene expression (mean) of splenic vs. renal CD8+ and CD4+ T cells isolated from kidneys of 14-week-old MRL/lpr mice. B. PRODH expression in activated (CD44hi) splenic vs. renal CD4+ and CD8+ T cells isolated from kidneys of 16-18-week-old MRL/lpr mice (n = 7). C. Mxi1 mRNA in Th1-activated CD4+ T cells transduced with either empty vector (EV), or knockdown constructs targeting Hif1a one day after adding DMOG. D-F. Mean fluorescence intensity of PRODH in Th1 activated CD4+ T cells transduced with EV, or two different Hif1a knockdown constructs (D), two different Mxi1 knockdown constructs (E), or Myc knockdown constructs (F) after 2 days of hypoxic culture. G, H. Percentage of IFN-γ+ cells of the live Th1 activated CD4+ T cells, and activated CD8+ T cells, transduced with the different knockdown vectors after 3 days (for CD4+ T cells) or 1 day (for CD8+ T cells) of hypoxia culture. I. Mean fluorescence intensity (MFI) of granzyme B in live activated CD8+ T cells transduced with the different knockdown vectors after one day of hypoxia culture. J-K. Baseline OCR (J) and extracellular acidification rate (ECAR) (K) of control-, DMOG-, DMOG- and THFA-treated Th1-activated CD4+ T cells. L-M. Baseline OCR (L) and extracellular acidification rate (ECAR) (M) of control-, DMOG-, DMOG- and THFA-treated CD8+ T cells N-O. NADH/ NAD+ ratio of control-, THFA-, DMOG-, DMOG- and THFA-treated Th1-activated CD4+ T cells (N) and CD8+ T cells (O). Data shown are mean ± s.d.; statistical analysis by two-tailed paired t-test (B) and unpaired t-test (C-O). ns = p > 0.05, *p < 0.05, **p < 0.01, ***p < 0.001, ****p < 0.0001.
Fig. 4.
Fig. 4.. Selective HIF-1 blockade eliminates renal injury in murine lupus nephritis.
A. Numbers of renal-infiltrating CD4+ and CD8+ T cells isolated from 16-week-old male MRL/lpr mice after four weeks of treatment with either PX-478 or PBS (n = 11, 10, respectively). B. Semi-quantitative urine dipstick analysis for proteinuria from 16-week-old male MRL/lpr mice treated with PX-478 or PBS. C. Pathological scores of the 16-week-old male MRL/lpr mice treated with PX-478 or PBS, as assessed by the NIH activity index. D-F. Representative glomerular (D), perivascular aggregates near the corticomedullary junction (E) and immunofluorescence staining of glomerular IgG2a (F) from the same mice after 4 weeks of treatment with PX-478 (D-F) and PBS (G-I). Representative of 3 experiments, n = 10 to 11 animals per group. G-I. Representative pimonidazole staining of kidney sections from 16-week-old MRL/lpr mice treated with PBS (J) or PX-478 (K), and quantification of pimonidazole positive cortical tubular cells (L). Reference line indicates pimonidazole positive renal tubular cells in control Fas-intact MRL+/+ mice. n = 5, 6 and 4 respectively. J. Kaplan Meier survival curve of MRL/lpr mice treated with PBS or PX-478. (n = 10 animals each group). Data shown are mean ± s.d.; statistical analysis by two-tailed t-test (A-C, I) and log-rank test (J). *p < 0.05, **p < 0.01, ***p < 0.001, ****p < 0.0001.
Fig. 5.
Fig. 5.. Genetic ablation of HIF-1α in T cells eliminates infiltrating T cells in lupus nephritis, reverses hypoxia, and prolongs survival.
A. Numbers of renal-infiltrating CD4+ and CD8+ T cells isolated from 6-month-old Cd4cre.Hif1afl/fl and Hif1afl/fl B6.Sle1.Yaa male mice (n = 12 and 8, respectively). B. Semi-quantitative urine dipstick analysis for proteinuria the same mice as (A) C. Pathological scores of the same mice using the NIH activity index for total NIH activity index(C) (n = 16, 12, respectively). D-F. Representative glomerular (D), perivascular aggregates near the corticomedullary junction (E), and immunofluorescence staining of glomerular IgG2c (F) from the same mice. G-I Representative pimonidazole (Hypoxyprobe) staining of kidney sections and quantification of pimonidazole positive renal tubular cells in the cortex. Reference line represents the pimonidazole staining in renal cortex of control B6 mice n = 6, 6 and 4 respectively. J. Kaplan Meier survival curve of Cd4cre.Hif1afl/fl and Hif1afl/fl B6.Sle1.Yaa male mice, n = 9 animals each group. Data shown are mean ± s.d.; statistical analysis by two-tailed t-test (A-C) and log-rank test (J) ns = p > 0.05, *p < 0.05, **p < 0.01, ***p < 0.001, ****p < 0.0001.
Fig. 6.
Fig. 6.. Hypoxia-regulated T cell survival and effector pathways are upregulated in human lupus nephritis.
A-C. Immunohistochemistry staining of IDH1 (brown) + CD3 (red) (A), PDK2 (brown) (B), and PRODH (brown) (C) in human lupus nephritis biopsy sample. D-F. Immunohistochemistry staining of IDH1 (red) + CD8 (brown) (D), PDK2 (brown) (E), and PRODH (brown) (F) in inflamed human tonsil. G-I. Quantification of IDH1 (G), PDK2 (H), and PRODH (I) positive staining in dense lymphocytic aggregates of lupus nephritis and T cell zone in inflamed tonsils. J-L. Merged immunofluorescence staining images of CD4, CD8, DAPI with either IDH1 (J), PDK2 (K), or PRODH (L).

Comment in

References

    1. Davidson A, What is damaging the kidney in lupus nephritis? Nat Rev Rheumatol 12, 143–153 (2016). - PMC - PubMed
    1. Deng W, Ren Y, Feng X, Yao G, Chen W, Sun Y, Wang H, Gao X, Sun L, Hypoxia inducible factor-1 alpha promotes mesangial cell proliferation in lupus nephritis. American journal of nephrology 40, 507–515 (2014). - PubMed
    1. Doedens AL, Phan AT, Stradner MH, Fujimoto JK, Nguyen JV, Yang E, Johnson RS, Goldrath AW, Hypoxia-inducible factors enhance the effector responses of CD8(+) T cells to persistent antigen. Nature immunology 14, 1173–1182 (2013). - PMC - PubMed
    1. Clever D, Roychoudhuri R, Constantinides MG, Askenase MH, Sukumar M, Klebanoff CA, Eil RL, Hickman HD, Yu Z, Pan JH, Palmer DC, Phan AT, Goulding J, Gattinoni L, Goldrath AW, Belkaid Y, Restifo NP, Oxygen Sensing by T Cells Establishes an Immunologically Tolerant Metastatic Niche. Cell 166, 1117–1131.e1114 (2016). - PMC - PubMed
    1. Whitehouse T, Stotz M, Taylor V, Stidwill R, Singer M, Tissue oxygen and hemodynamics in renal medulla, cortex, and corticomedullary junction during hemorrhage-reperfusion. American journal of physiology. Renal physiology 291, F647–653 (2006). - PubMed

Publication types