. 2020 Apr 8;12(538):eaax5104.
doi: 10.1126/scitranslmed.aax5104.

IL-6 blockade reverses bone marrow failure induced by human acute myeloid leukemia

Affiliations

IL-6 blockade reverses bone marrow failure induced by human acute myeloid leukemia

Tian Yi Zhang et al. Sci Transl Med. .

Abstract

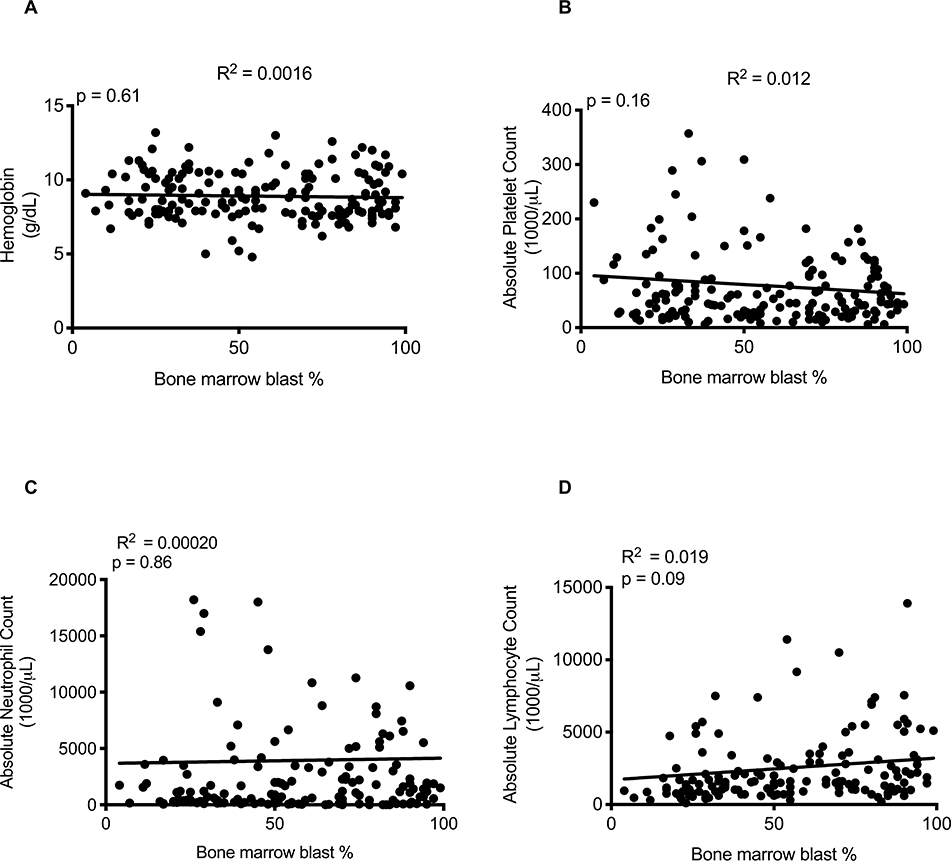
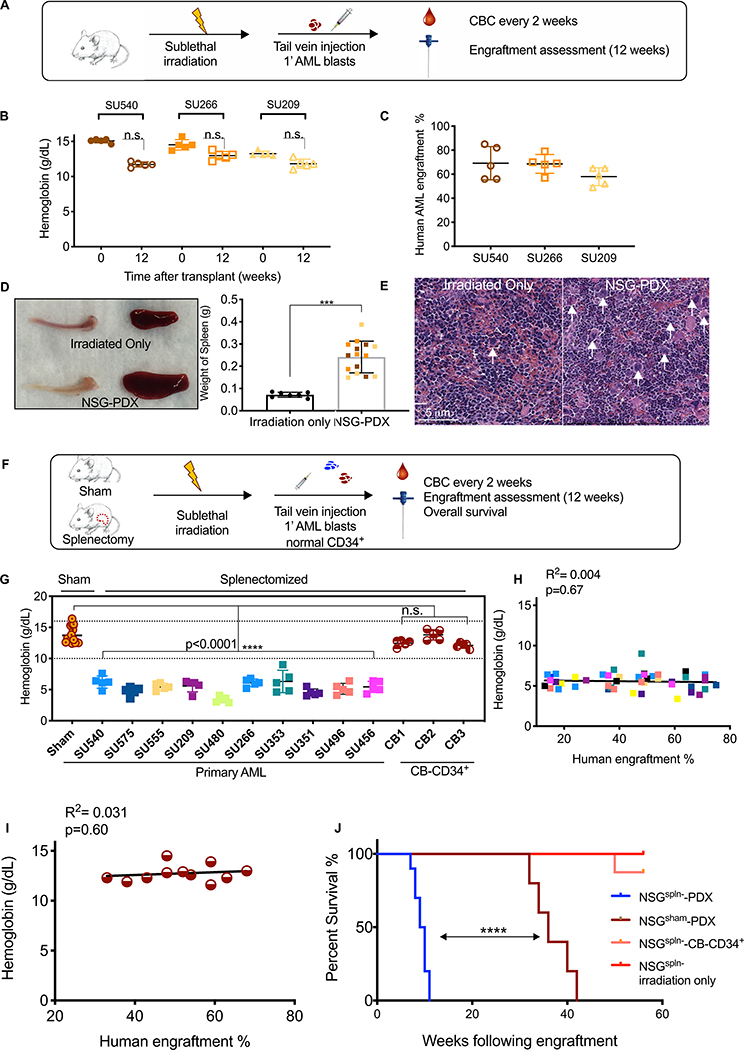
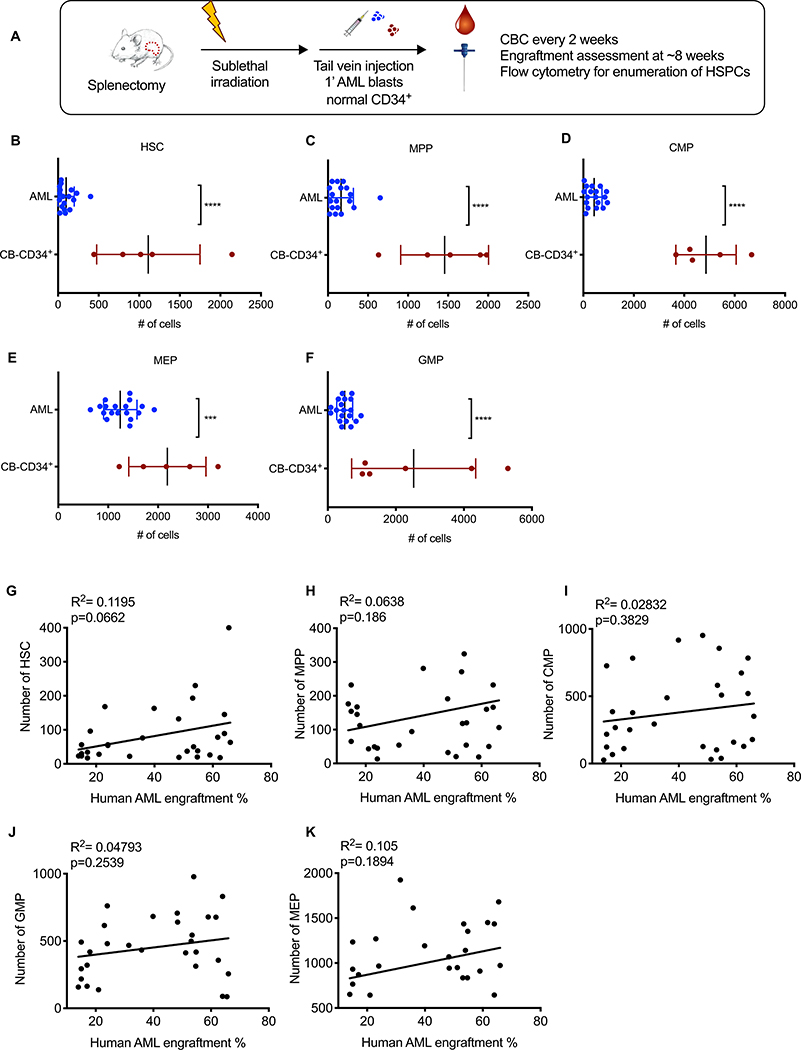
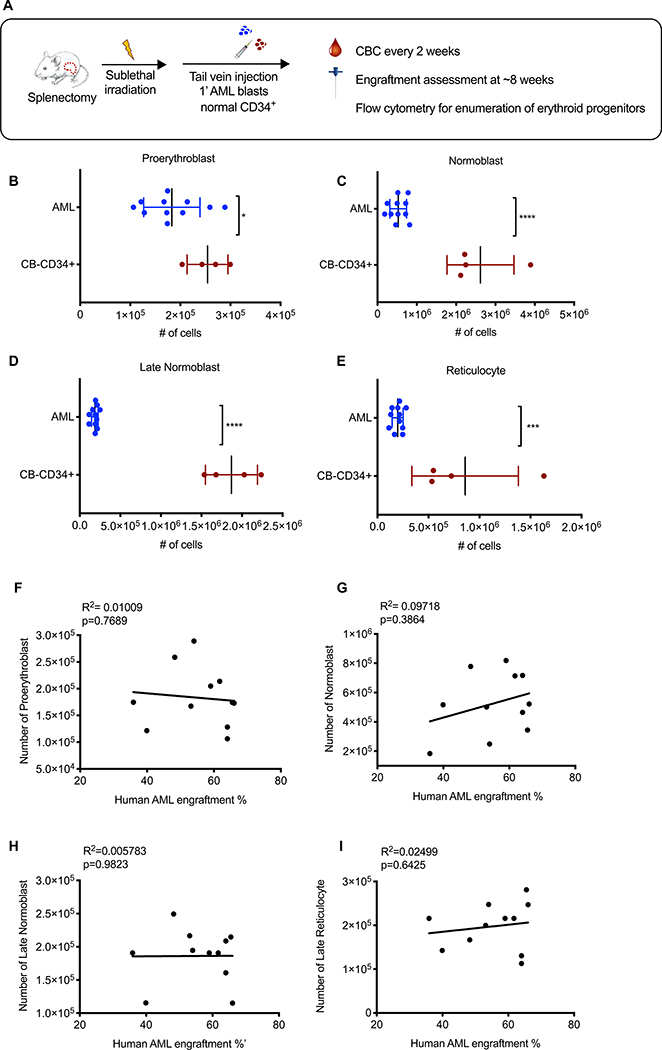
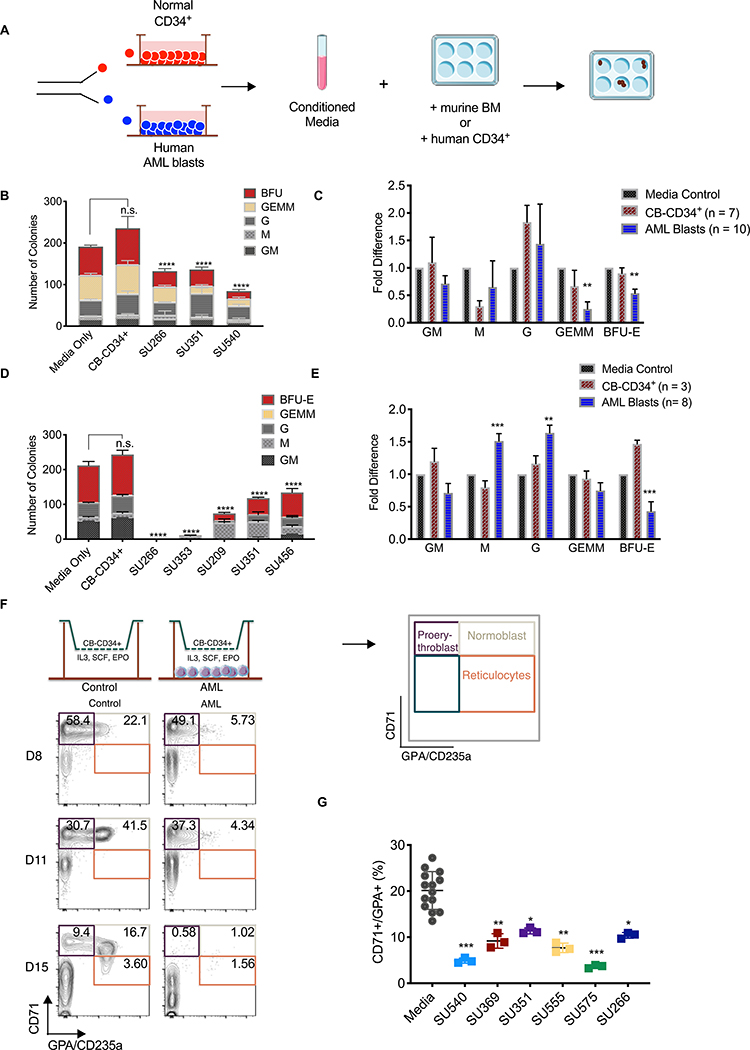
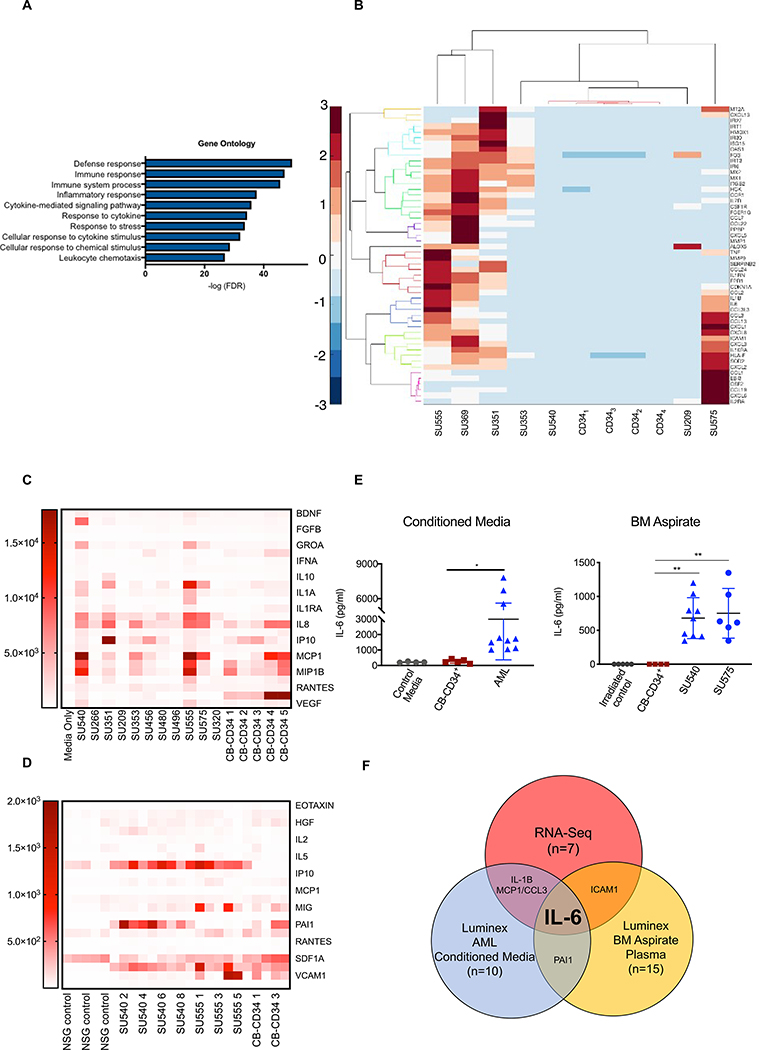
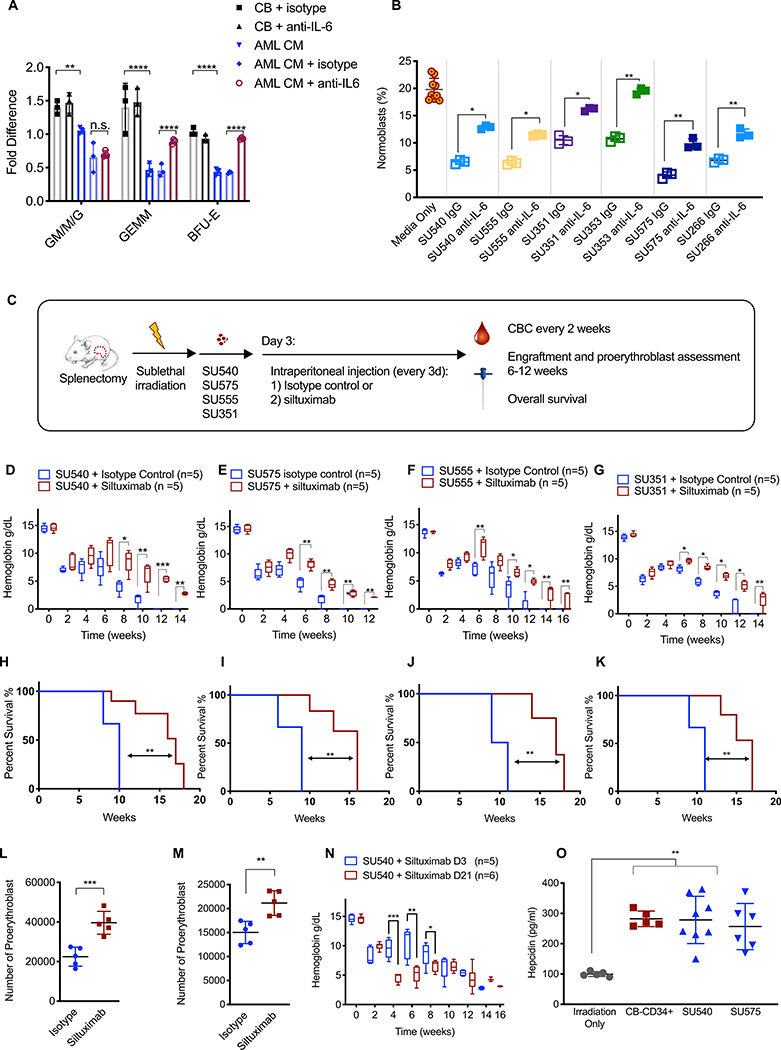
Most patients with acute myeloid leukemia (AML) die from complications arising from cytopenias resulting from bone marrow (BM) failure. The common presumption among physicians is that AML-induced BM failure is primarily due to overcrowding, yet BM failure is observed even with low burden of disease. Here, we use large clinical datasets to show the lack of correlation between BM blast burden and degree of cytopenias at the time of diagnosis. We develop a splenectomized xenograft model to demonstrate that transplantation of human primary AML into immunocompromised mice recapitulates the human disease course by induction of BM failure via depletion of mouse hematopoietic stem and progenitor populations. Using unbiased approaches, we show that AML-elaborated IL-6 acts to block erythroid differentiation at the proerythroblast stage and that blocking antibodies against human IL-6 can improve AML-induced anemia and prolong overall survival, suggesting a potential therapeutic approach.


Conflict of interest statement

Competing interests: R.M. is a founder, consultant, equity holder, and serves on the Board of Directors of Forty Seven Inc. The other authors report no competing interests and have no paid or unpaid consultancy to report. No patents were filed as the result of this work.

Figures

Fig. 1.
Fig. 1.. The severity of cytopenias in AML patients is independent of disease burden
Correlation of (A) hemoglobin (R2=0.0016, p=0.61), (B) platelet count (R2=0.012, p=0.16), (C) absolute neutrophil count (R2=0.00020, p=0.86), and (D) absolute lymphocyte count (R2=0.019, p=0.09) with BM blast percentage at the time of diagnosis. R2=Pearson correlation of determination.
Figure 2.
Figure 2.. Splenectomized human AML xenograft mice die of BM failure.
(A) Schematic of experimental procedure. (B) Hemoglobin results at 12 weeks are shown. (C) Human AML engraftment at 12 weeks. (D) Representative spleens and tibiae from NSG-PDX and irradiated-only mice are shown on the left. NSG-PDX mice (n=15) demonstrated increased splenic weight (n = 7) (p < 0.0001, unpaired t-test). (E) Representative H&E stained spleen sections from NSG-PDX mice demonstrating the presence of increased megakaryocytes (white arrows). Red pulp expansion (red areas) is seen in splenectomized NSG-PDX mice. (F) Schematic of experimental procedure. (G) Eight weeks after transplantation, hemoglobin was determined in NSGspln--PDX mice (10 primary AML samples, n = 50 total with 5 mice in each group, p<0.0001, 1-way ANOVA) compared to NSGsham-PDX (n=32, 10 independent AML samples) and NSGspln--CB-CD34+ mice (n=15, 3 independent CB) (H) Correlation of hemoglobin and human AML BM engraftment in NSGspln--PDX mice color-coded to reflect individual AML samples as reported in (D) (n= 46, R2= 0.02 Pearson correlation determination, p=0.42). (I) Correlation of hemoglobin and BM engraftment in NSGspln--CB-CD34+ mice (n=11, R2=0.031, p=0.60). (J) Kaplan-Meier survival curve indicating overall survival of NSGspln- irradiated only (n=5, median survival not reached), NSGsham-SU540 (n=5, median survival 36 weeks), NSGspln--SU540 (n=7, median survival 9.5 weeks), and NSGspln-CB-CD34+ (n=5, median survival not reached ) engrafted mice. NSGspln-PDX mice have shortened overall survival compared to NSGsham-PDX (p<0.0001). n.s. = not significant.
Fig. 3.
Fig. 3.. Normal mouse HSPCs are depleted in the presence of human AML
(A) Schematic of experimental procedure. Absolute numbers of (B) HSC (AML 99.9±23.3 vs CB 1112±285; p<0.0001), (C) MPP (AML 163±36.3 vs CB 1456±245; p<0.0001), (D) CMP (AML 427±74.1 vs CB 4864±534; p<0.0001), (E) MEP (AML 1241±78.8 vs CB 2186±346; p=0.0005), and (F) GMP (AML 498±53.7 vs CB 2525±744; p<0.0001) in NSGspln--PDX (n=25, engrafted with the same AML samples as in in Fig. 2D, E, absolute numbers represent total numbers per mouse) and NSGspln--CB-CD34+ (n=5, engrafted with the same CB samples as in Fig. 2D, F) mice 8 weeks after transplantation. Pearson’s Correlation between absolute numbers of (G) HSCs, (H) MPP, (I) CMP, (J) GMP, (K) MEPs and BM disease burden as indicated by percent AML engraftment in the BM.
Fig. 4.
Fig. 4.. Human AML blasts impart an erythroid differentiation blockade in vivo.
(A) Schematic of experimental procedure. Absolute numbers of mouse (B) proerythroblasts (AML 1.8×10⁵ ± 1.7 × 10⁴ vs CB 2.5×10⁵ ± 2.0×10⁴; p=0.034), (C) normoblasts (AML 5.4×10⁵ ± 6.4×10⁴ vs CB 2.6×10⁶ ±4.3×10⁵; p<0.0001), (D) late normoblasts (AML 1.86×10⁵ ±1.3×10⁴ vs CB 1.9×10⁶ ± 1.6×10⁵; p<0.0001), and (E) reticulocytes (AML 2.0×10⁵ ± 1.6×10⁴ vs CB 8.6×10⁵ ± 2.6×10⁵; p=0.0007) in the BM of NSGspln--PDX (engrafted with SU540 (n=6) and SU575 (n=5)) compared to NSGspln--CB-CD34+ mice (n=4). Absolute numbers represent total numbers per mouse. Pearson’s correlation between absolute numbers of (F) proerythroblasts, (G) normoblasts, (H) late normoblasts, (I) reticulocytes and human AML BM engraftment. All R2 = Pearson correlation determination.
Figure 5.
Figure 5.. Human AML suppresses normal hematopoiesis via a paracrine factor(s)
(A) Schematic of experimental procedure. (B) Total number and type of colonies formed by mouse BM cells in the presence of CM from CB-CD34+ cells or human AML. p<0.0001. (C) Fold change in the number of each colony type generated by normal mouse BM cells in the presence of CM from cultures of purified CB-CD34+ (n=7) or human AML (n=10). For each sample, the number of colonies was normalized to control media. p<0.01 (D) Total number and type of colonies formed by human CB-CD34+ cells in the presence of CM from CB-CD34+ cells or human AML. p<0.0001 (E) Fold changes in the number of each colony type generated by normal CB-CD34+ cells in the presence of CM generated from purified CB-CD34+ (n=3) or human AML (n=8). p<0.001. (F) Schematic of experimental procedure. At the indicated time points, the top compartment was analyzed for CD71/GPA subpopulations as indicated. Representative CD71/GPA flow cytometry plots at D8, D11, and D15 are shown with percentages of each population indicated from control and AML cultures. (G) The percentage of CD71+/GPA+ normoblasts present on day 6 of the transwell assay in the absence (n=4 with technical triplicates) or presence (n=6 with technical triplicates) of purified AML blasts.
Fig. 6.
Fig. 6.. IL-6 is differentially upregulated and secreted by AML blasts
(A) Gene ontology analysis of differentially upregulated transcripts in primary AML blasts (n=7) compared to normal human CB-CD34+ cells (n=4), ranked by p-value. (B) Heatmap illustrating the expression pattern of genes upregulated (>=8 fold, p<0.0005) in primary AML compared to CB-CD34+ cells associated with cytokines and/or cytokine signaling. (C) Heatmap summary of Luminex data showing expression of upregulated factors secreted by purified AML blasts in culture (n=10) compared to control media (n=3) and purified normal human CB-CD34+ cells (n=5). (D) Heatmap summary of Luminex data showing upregulated secreted factors in the BM plasma of NSGspln--PDX mice engrafted with SU540 (n=9) and SU555 (n=6) compared to irradiated only NSGspln- mice (n=5) or NSGspln--CB-CD34+ mice (n=4). (E) Concentrations of IL-6 produced in individual experimental replicates reported in (C) and (D) p<0.001 (F) Schematic showing identification of IL-6 as a secreted factor upregulated by human AML blasts in all three platforms of evaluation.
Fig. 7
Fig. 7. Human AML suppresses erythroid differentiation and causes anemia via paracrine effects of IL-6
(A). Fold change in the number of colonies generated by normal human CB-CD34+ cells in the presence of CB-CD34+-CM (n=3) or human AML-CM (n=3) +/− human IL-6 neutralizing antibody or an isotype control antibody. The number of colonies was normalized to either CB-isotype control or AML-CM isotype controls as indicated by brackets in the figure. (B). Transwell assay for erythroid differentiation was done in the presence or absence of a human IL-6 neutralizing antibody or an isotype control antibody. Aliquot of cells from the top compartment was analyzed for the percentage of CD71+GPA+ normoblasts on day 6. (C). Schematic of experimental procedure. Treatment with control antibody or siltuximab (anti-human IL-6, 20 mg/kg) began on day 3 and occurred every 3 days. Hemoglobin in NSGspln- mice engrafted with primary AML (D) SU540, (E) SU575, (F) SU555, and (G) SU351. Overall survival in NSGspln--PDX mice engrafted with (H) SU540 10 weeks vs 17 weeks p=0.02, (I) SU575 9 weeks vs 16 weeks, p=0.002, (J) SU555 10 weeks vs 17 weeks p=0.0014, and (K) SU351 11 weeks vs 16 weeks, p=0.006). Absolute numbers of CD71+/GPA+ normoblasts in NSGspln--PDX mice engrafted with (L) SU555 2.25×10⁴ vs 3.96×10⁴ p=0.0009 and (M) SU351 1.50×10⁴ vs 2.11×10⁴ p=0.004. (N) Hemoglobin in NSGspln--SU540 mice which began treatment on d3 versus d21. (O) Serum hepcidin concentrations in control, NSGspln--PDX engrafted with SU540 or SU575, and NSGspln--CB-CD34+ mice (n=5 for each group, p=0.001). *P < 0.05, **P < 0.01, ***P < 0.001

References

    1. Döhner H, Estey E, Grimwade D, Tallman MS, Tien H-F, Wei AH, Löwenberg B, Bloomfield CD, Diagnosis and management of AML in adults: 2017 ELN recommendations from an international expert panel, Blood 129, 424–447 (2017). - PMC - PubMed
    1. Arber DA, Orazi A, Hasserjian R, Thiele J, Borowitz MJ, Le Beau MM, Bloomfield CD, Cazzola M, Vardiman JW, The 2016 revision to the World Health Organization classification of myeloid neoplasms and acute leukemia, Blood 127, 2391–2405 (2016). - PubMed
    1. Cannas G, Fattoum J, Raba M, Dolange H, Barday G, François M, Elhamri M, Salles G, Thomas X, Transfusion dependency at diagnosis and transfusion intensity during initial chemotherapy are associated with poorer outcomes in adult acute myeloid leukemia, Ann. Hematol 94, 1797–1806 (2015). - PubMed
    1. Morrison SJ, Scadden DT, The bone marrow niche for haematopoietic stem cells, Nature 505, 327–334 (2014). - PMC - PubMed
    1. Crane GM, Jeffery E, Morrison SJ, Adult haematopoietic stem cell niches, Nat. Rev. Immunol 17, 573–590 (2017). - PubMed

Publication types