. 2020 Apr 8;10(1):6075.
doi: 10.1038/s41598-020-62204-7.

Adaptive rewiring evolves brain-like structure in weighted networks

Affiliations

Adaptive rewiring evolves brain-like structure in weighted networks

Ilias Rentzeperis et al. Sci Rep. .

Abstract

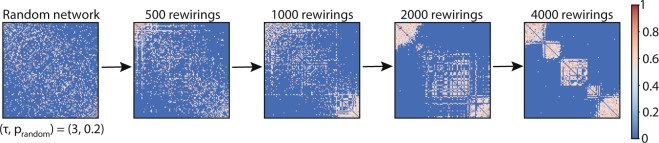
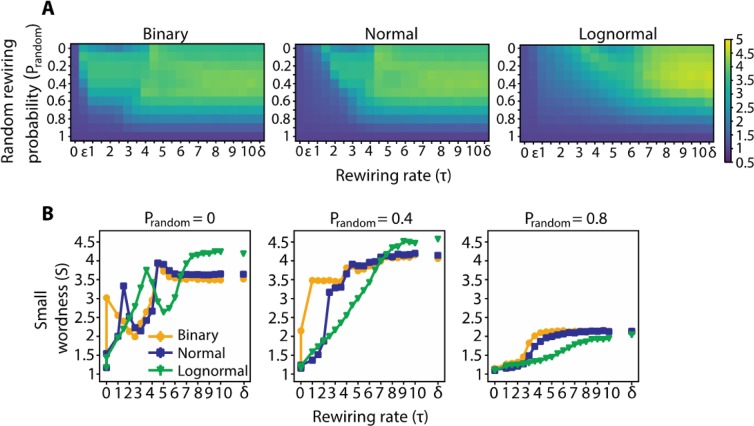
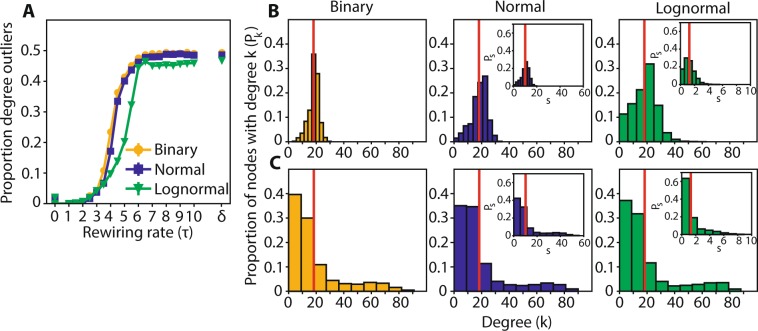
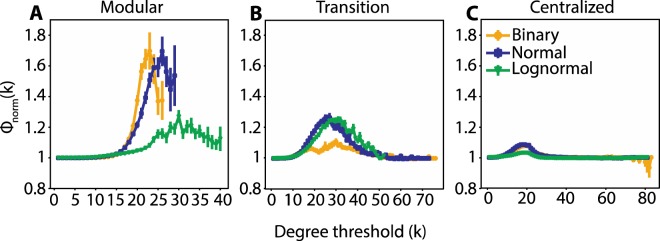
Activity-dependent plasticity refers to a range of mechanisms for adaptively reshaping neuronal connections. We model their common principle in terms of adaptive rewiring of network connectivity, while representing neural activity by diffusion on the network: Where diffusion is intensive, shortcut connections are established, while underused connections are pruned. In binary networks, this process is known to steer initially random networks robustly to high levels of structural complexity, reflecting the global characteristics of brain anatomy: modular or centralized small world topologies. We investigate whether this result extends to more realistic, weighted networks. Both normally- and lognormally-distributed weighted networks evolve either modular or centralized topologies. Which of these prevails depends on a single control parameter, representing global homeostatic or normalizing regulation mechanisms. Intermediate control parameter values exhibit the greatest levels of network complexity, incorporating both modular and centralized tendencies. The simulation results allow us to propose diffusion based adaptive rewiring as a parsimonious model for activity-dependent reshaping of brain connectivity structure.


Conflict of interest statement

The authors declare no competing interests.

Figures

Figure 1
Figure 1
Example of an initially random network at progressive stages of rewiring.
Figure 2
Figure 2
Networks with binary, normal and lognormal weight distributions develop into small worlds. (A) From left to right, small world values (S) for networks with binary, normal and lognormal weight distributions for different rewiring rates (τ) and random rewiring probabilities (prandom). ε = 10−15, δ = 1015. (B) S as a function of τ for different values of prandom. The s.e.m lines are not visible since they do not exceed the markers.
Figure 3
Figure 3
Networks can have the same small world value but diverging connectivity pattern. (A) Example of a modular network (τ = 3) where nodes within clusters are densely intraconnected but sparsely interconnected between clusters. (B) Example of a centralized network (τ = 5) where there is a degree imbalance between nodes, with the vast majority of the nodes having very few connections and the rest being heavily connected, acting as hubs. Both networks have the same small world value (S = 3.4) despite their different topological characteristics. In both cases prandom is 0.2 and the weight distribution is normal. The color scaling indicates the weights of the connections.
Figure 4
Figure 4
Modularity profiles between networks with binary, normal and lognormal weight distributions have similar shape. (A) From left to right, Modularity index Q for networks with binary, normal and lognormal weight distributions for different values of the system parameters τ and prandom. (B) Q as a function of τ for different prandom. The s.e.m. lines do not exceed the markers.
Figure 5
Figure 5
Degree distribution for modular networks is close to the mean value; for centralized networks it is heavy tailed. (A) Proportion of nodes with outlier degrees as a function of τ for binary, normal and lognormal networks. The s.e.m. lines do not exceed the markers. (B) From left to right, the distribution of degrees for binary, normal and lognormal networks (τbinary = 2, τnormal = 3, τlognormal = 4.5) which are modular. Inset plots show the strength distributions. C. Same as in B, but for centralized networks (τbinary = 5, τnormal = 5, τlognormal = 7). In all cases prandom = 0.2.
Figure 6
Figure 6
Weighted networks show the most prominent topological rich club for rewiring rates in the modular and transition ranges, binary networks only in the modular range. Topological normalized rich club, Φnorm(k), for binary, normal and lognormal networks in the (A) modular (τbinary = 2, τnormal = 3, τlognormal = 4.5) (B) transition (τbinary = 4.1, τnormal = 4.15, τlognormal = 5.5) and (C) centralized (τbinary = 5, τnormal = 5, τlognormal = 7) state. In all cases prandom = 0.2. Vertical lines indicate s.e.m.
Figure 7
Figure 7
Topological and weighted rich club coefficients diverge similarly to physiological data. Topological and weighted rich club coefficient for the normal network at τtransition = 4.15, prandom = 0.2. Vertical lines indicate s.e.m.

References

    1. Sporns, O. Networks of the brain. (MIT press, 2010).
    1. Bassett DS, Bullmore ET. Small-world brain networks revisited. The Neuroscientist. 2017;23:499–516. doi: 10.1177/1073858416667720. - DOI - PMC - PubMed
    1. Sporns O, Zwi JD. The small world of the cerebral cortex. Neuroinformatics. 2004;2:145–162. doi: 10.1385/NI:2:2:145. - DOI - PubMed
    1. Hilgetag C-C, Burns GA, O’Neill MA, Scannell JW, Young MP. Anatomical connectivity defines the organization of clusters of cortical areas in the macaque and the cat. Philos. Trans. R. Soc. Lond. B. Biol. Sci. 2000;355:91–110. doi: 10.1098/rstb.2000.0551. - DOI - PMC - PubMed
    1. Bullmore E, Sporns O. Complex brain networks: graph theoretical analysis of structural and functional systems. Nat. Rev. Neurosci. 2009;10:186. doi: 10.1038/nrn2575. - DOI - PubMed

Publication types