. 2020 Apr;580(7802):278-282.
doi: 10.1038/s41586-020-2110-6. Epub 2020 Mar 11.

DNA clamp function of the monoubiquitinated Fanconi anaemia ID complex

Affiliations

DNA clamp function of the monoubiquitinated Fanconi anaemia ID complex

Renjing Wang et al. Nature. 2020 Apr.

Abstract

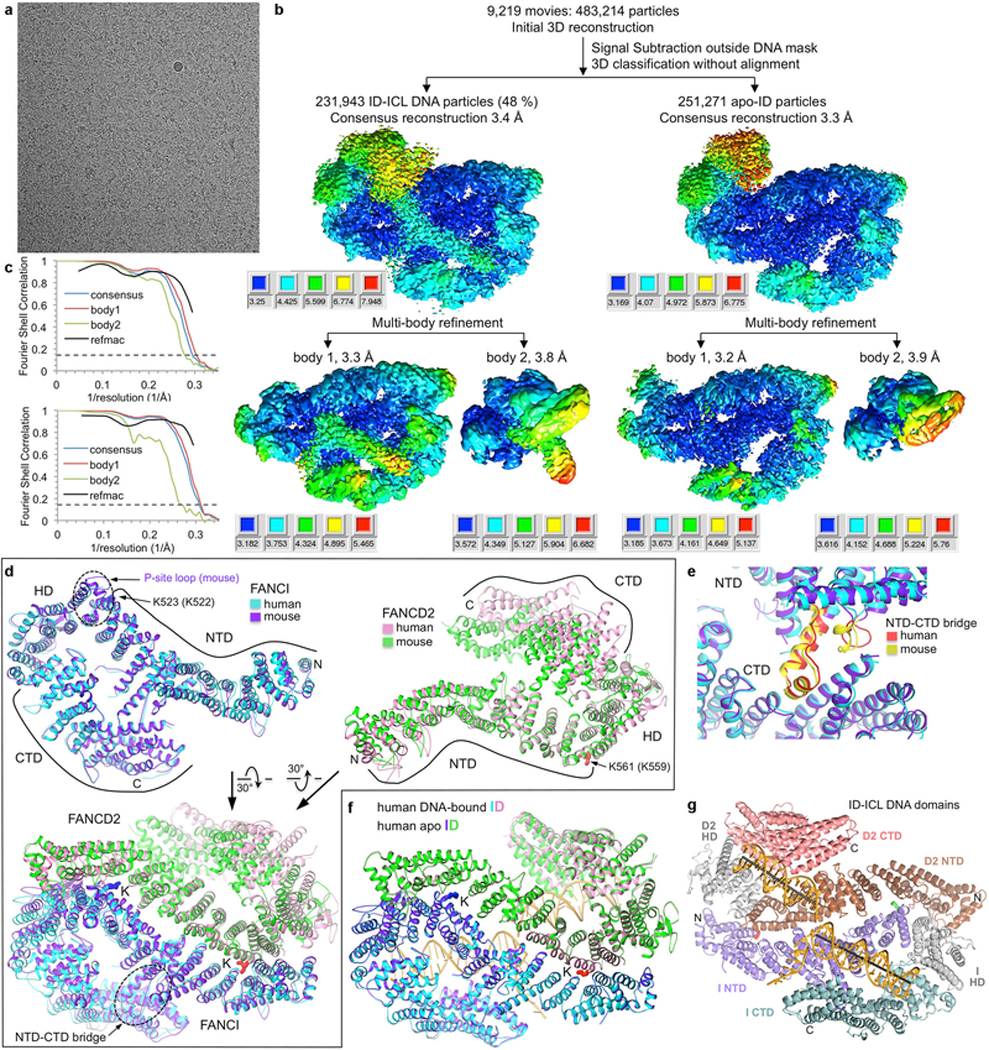
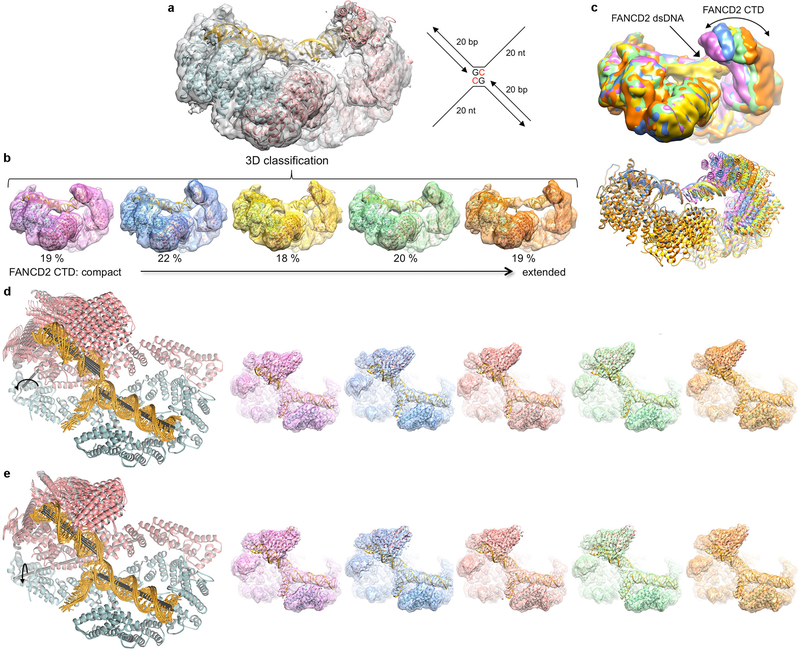
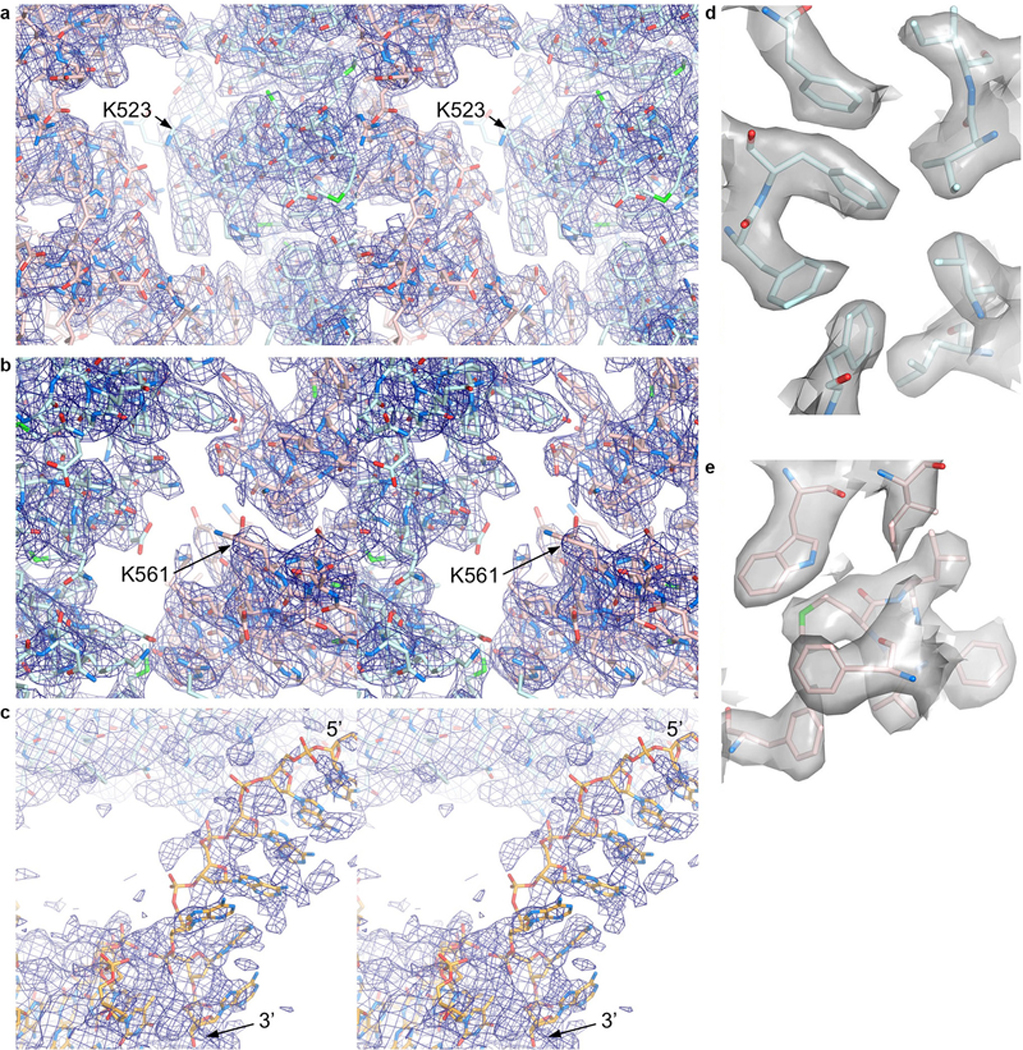
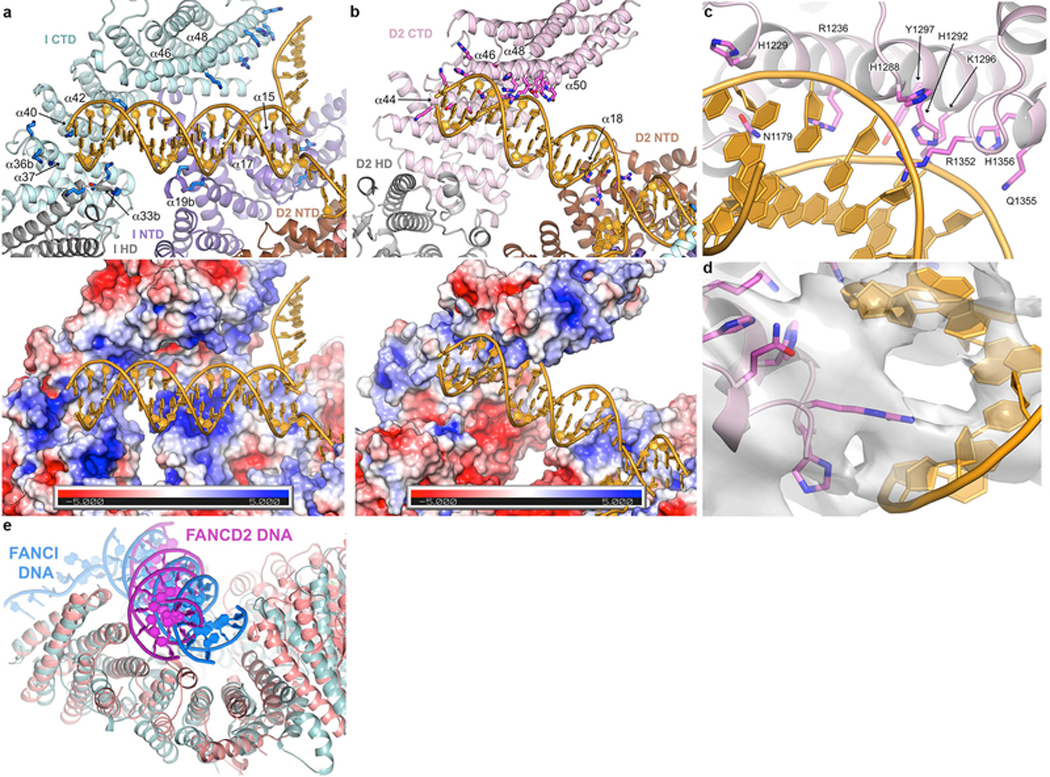
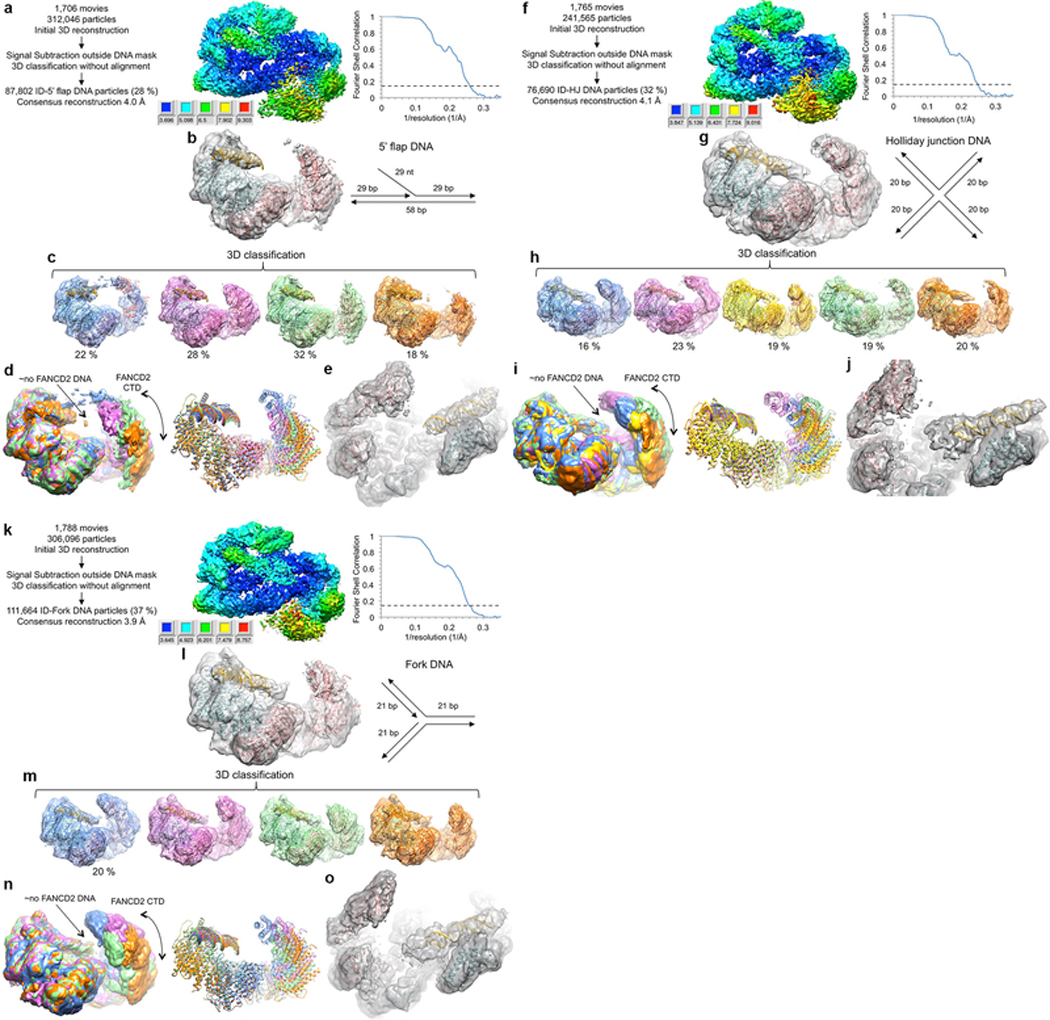
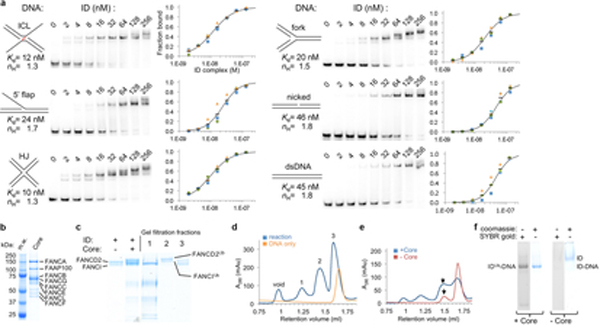
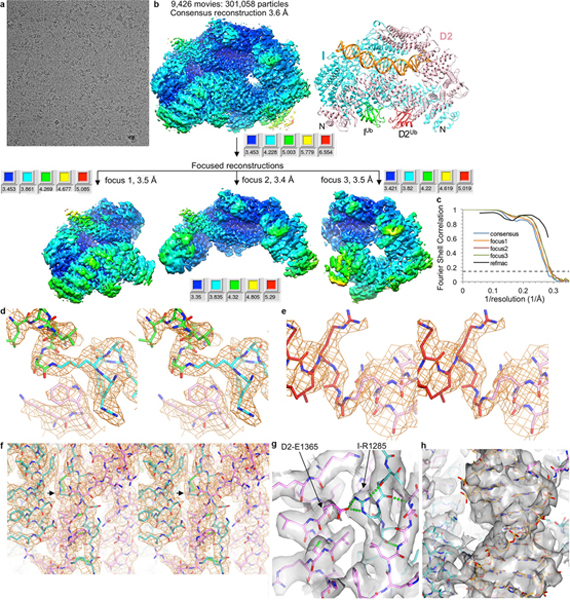
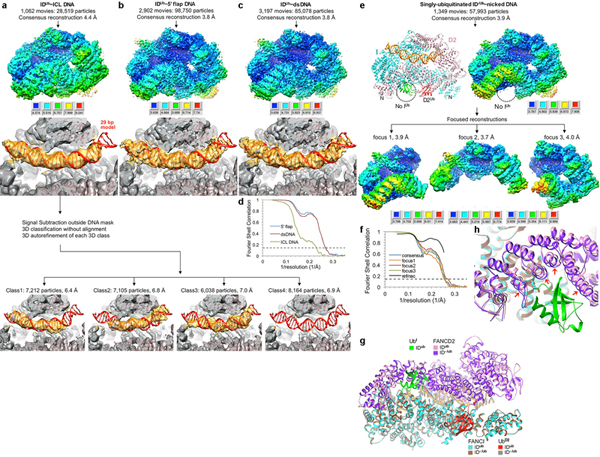
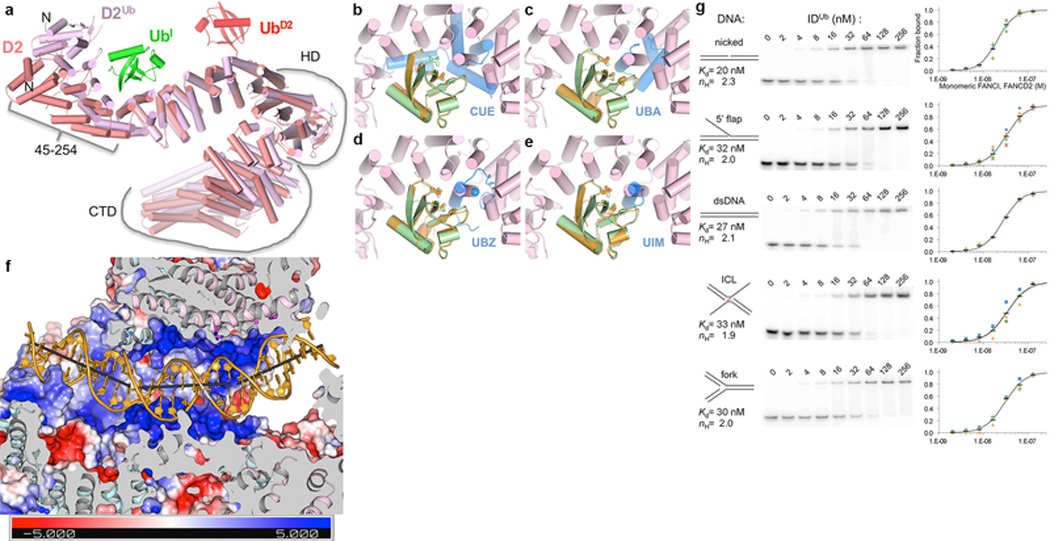
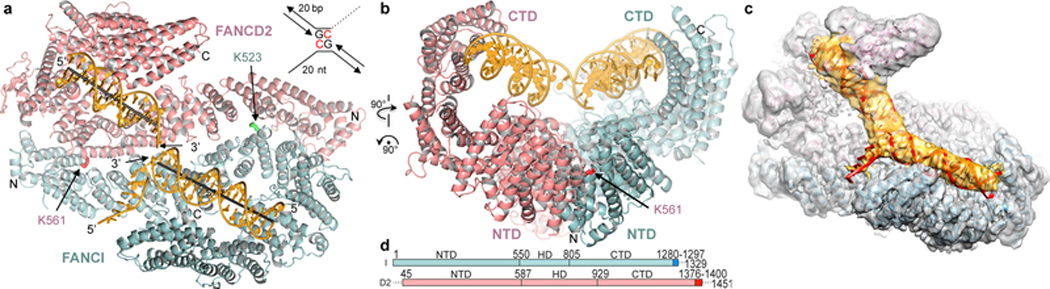
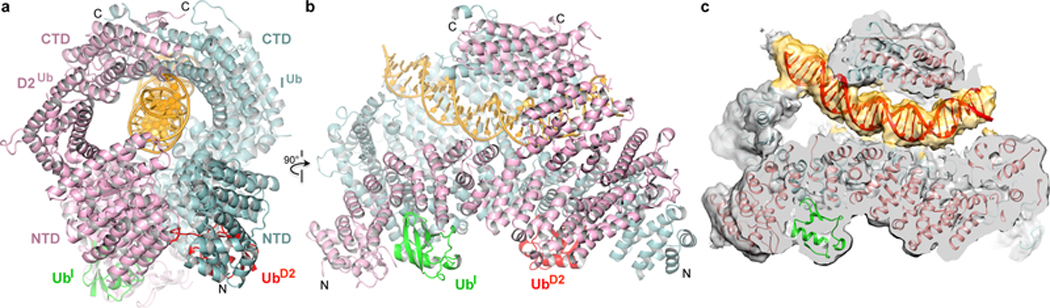
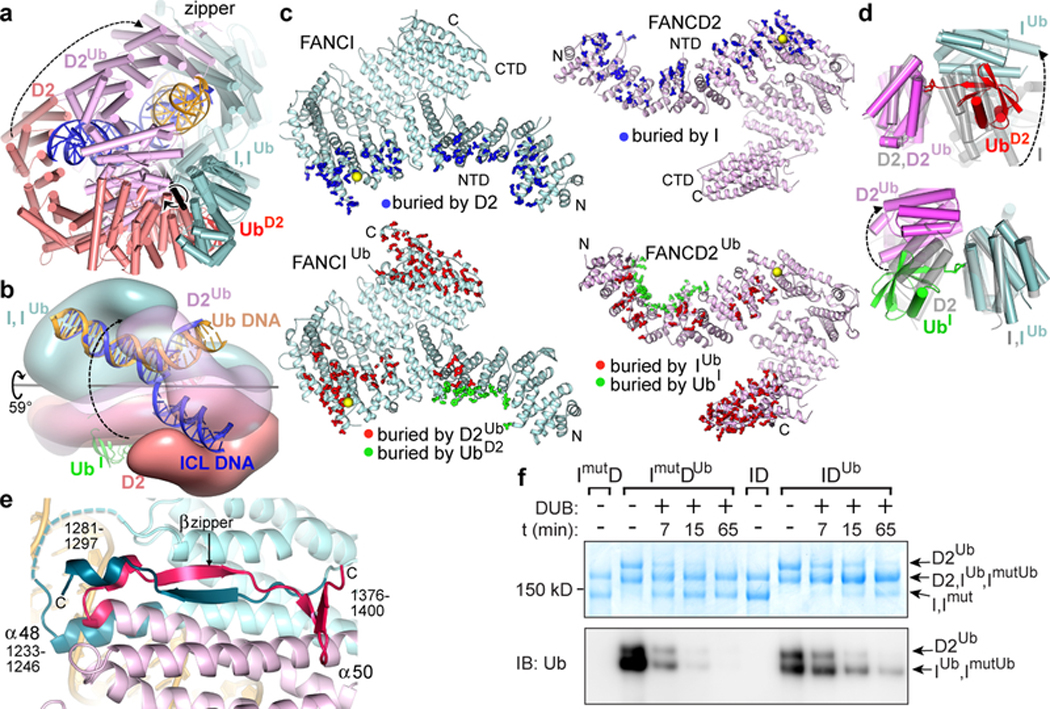
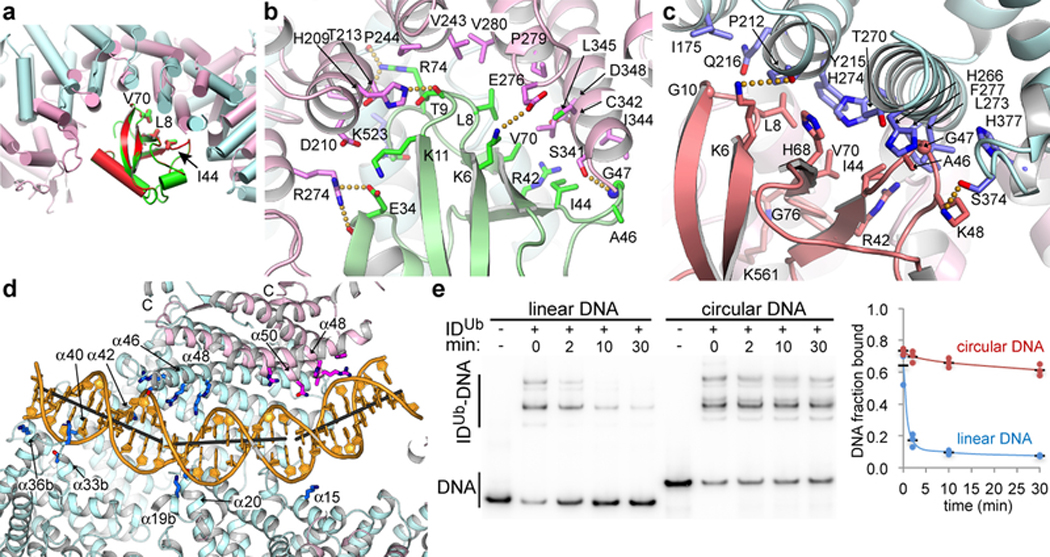
The ID complex, involving the proteins FANCI and FANCD2, is required for the repair of DNA interstrand crosslinks (ICL) and related lesions1. These proteins are mutated in Fanconi anaemia, a disease in which patients are predisposed to cancer. The Fanconi anaemia pathway of ICL repair is activated when a replication fork stalls at an ICL2; this triggers monoubiquitination of the ID complex, in which one ubiquitin molecule is conjugated to each of FANCI and FANCD2. Monoubiquitination of ID is essential for ICL repair by excision, translesion synthesis and homologous recombination; however, its function remains unknown1,3. Here we report a cryo-electron microscopy structure of the monoubiquitinated human ID complex bound to DNA, and reveal that it forms a closed ring that encircles the DNA. By comparison with the structure of the non-ubiquitinated ID complex bound to ICL DNA-which we also report here-we show that monoubiquitination triggers a complete rearrangement of the open, trough-like ID structure through the ubiquitin of one protomer binding to the other protomer in a reciprocal fashion. These structures-together with biochemical data-indicate that the monoubiquitinated ID complex loses its preference for ICL and related branched DNA structures, and becomes a sliding DNA clamp that can coordinate the subsequent repair reactions. Our findings also reveal how monoubiquitination in general can induce an alternative protein structure with a new function.


Figures

Extended Data Figure 1 |
Extended Data Figure 1 |. Cryo-EM reconstructions of the non-ubiquitinated ID-ICL DNA and apoID complexes.
a, Micrograph of non-ubiquitinated ID-ICL DNA particles. The presence of excess DNA at 0.8 mg/ml obscures the protein particles. The particles were collected in five data sets. b, Flow chart of single particle cryo-EM data processing for the ID-ICL DNA and apo-ID complexes. Consensus (top) and focused maps from the RELION3 multi-body refinement, temperature-factor sharpened and masked, are colored by local resolution estimated with the RELION3 postprocess program. The resolution range is mapped to the colors in the inset next to each map. Orientation is similar to Figure 1a. The particle has dimensions of 164 Å, 116 Å, 96 Å. Additional details are in Methods. c, Top graph shows gold-standard FSC plots between two independently refined half-maps for the ID-ICL DNA consensus reconstruction (blue curve), for the RELION3 multi-body refinement of the larger body1 consisting of FANCI, FANCI-bound dsDNA and ssDNA, and FANCD2 residues 43–623 (red curve), and for the smaller body2 consisting of FANCD2 residues 624–1376 and the FANCD2-associated dsDNA (green curve). The FSC curve for the final model versus the composite map combining the cryo-EM maps of the two bodies is shown in black. Dashed line marks the FSC cutoff of 0.143. Bottom graph shows the gold-standard FSC plots between two independently refined half-maps for the consensus reconstruction of the apo-ID complex (blue curve), of the RELION3 multi-body refinement of the two bodies, and of the model refined with REFMAC5 (black). d, Top left panel shows the superposition of the human FANCI structure on mouse FANCI from the crystal structure of the mouse ID complex with an r.m.s.d. of 1.8 Å for 926 out of 1,168 common Cα atoms (colored blue and purple for human and mouse, respectively). The majority of the residues that do not superimpose are in the N-terminal 183 amino-acid segment that packs with the FANCD2 HD domain that is mobile in the cryo-EM structure. Other differences include FANCI residues 551–574 that are disordered in human FANCI, while the corresponding mouse FANCI segment (marked by dotted oval and labeled P-site loop) is well ordered at the FANCI-FANCD2 interface, and affects the conformations of flanking helical repeats. The FANCD2 region with which this segment packs in the mouse ID complex is shifted by ~5 Å away from FANCI in the human ID complex. This segment also contains the phosphorylation sites of ATR kinase,. Ubiquitination sites, N- and C- termini and individual domains are marked. Top right panel shows the superposition of the human FANCD2 on the mouse structure with an r.m.s.d. of 2.0 Å for 501 out of 1,131 common Cα atoms (colored pink and green for human and mouse, respectively). The low level of overall structural overlap is due to the flexibility of the FANCD2 CTD and HD domains in the cryo-EM structure compared to the mouse ID crystal structure, where the FANCD2 CTD is involved in crystal packing contacts that limit its mobility. Another difference involves the first ~200 residues that cap the FANCD2 NTD solenoid. This segment is displaced by 5 Å in the mouse structure owing to the ordering of the aforementioned FANCI phosphorylation-site loop at the interface. Bottom panel shows the superposition of human ID on the crystal structure of mouse ID with an r.m.s.d. of 2.2 Å for 1,302 out of 2,312 common Cα atoms. The superimposed segments are primarily the FANCI and FANCD2 NTD solenoids, including their ubiquitination sites but excluding their N-termini as discussed above, and most of the FANCI CTD domain. The dashed oval marks the helical protrusion (NTD-CTD bridge) from the FANCI NTD that packs with its CTD and rigidifies the structure. The lack of an NTD-CTD bridge in FANCD2 is associated with the increased mobility of its CTD relative to the NTD. e, Close-up view of the FANCI NTD-CTD bridge of the human and mouse structures colored red and yellow, respectively. f, DNA binding does not cause any substantial conformational differences, except for the FANCD2 CTD that exhibits increased mobility in apo-ID. The human ID-ICL complex (cyan FANCI and pink FANCD2) can be superimposed on the human apo-ID complex (purple FANCI and green FANCD2) in its entirety with a Cα r.m.s.d. of 0.9 Å (2,291 common Cα atoms). g, The human ID-ICL DNA complex colored according to the individual proteins’ domains as indicated, in the same orientation as Figure 1a.
Extended Data Figure 2 |
Extended Data Figure 2 |. Conformational flexibility of the FANCD2 CTD domain and its associated DNA.
a, The FANCD2 CTD and its associated DNA are evident in the consensus reconstruction prior to temperature-factor sharpening. Because the DNA has higher temperature factors than the protein (Extended Data Table 1), the temperature-factor calculated from the overall map degrades the continuity of the DNA density. The cartoon representation of the refined model is colored cyan for FANCI, pink for FANCD2, and gold for DNA. The schematic of the ICL DNA is shown to the right of the map, with the deoxycytidine bases that are crosslinked by a triazole colored red. The 20 nt ssDNA arms consist of (dT)20 to minimize secondary structure. b, 3D classification of the particles showing the conformational flexibility of FANCD2. The 3D classes are arranged starting with the most compact conformation where the FANCD2 CTD is closer to its NTD. Also shown is the refined consensus model rigid-body fitted into each class and colored as in a. The conformational flexibility starts within the HD domain (starting around residue 645). c, The five 3D classes are superimposed by aligning the FANCI-portion of each map (left), or of each pdb (right) colored according to their map in b. d, Cryo-EM reconstructions using particles from the top component of the principle component analysis (PCA) of the multi-body refinement angles, separated into 5 bins. This component accounts for 21.5 % of the variance in the relative orientation of the FANCD2 CTD (Supplementary Video 1). Left, five ID-ICL DNA models refined in real-space with PHENIX (overall solvent-corrected resolution ranging from 3.7 to 3.9 Å) against maps reconstructed with particles derived from five bins of eigenvalues for the top eigenvector. This PCA component corresponds to a rotation of up to 16° (curved arrow) about an axis running through the HD domain roughly perpendicular to the plane of the figure (gray stick). The helical axes of the individual duplexes are shown as black sticks. Right, the corresponding maps, without temperature-factor sharpening, starting with the conformation (pink map) where the FANCD2 CTD is closest to the FANCI CTD. e, The second component from the PCA analysis accounts for 17% of the variance in the relative orientation of the FANCD2 CTD (Supplementary Video 2). It corresponds to an up to ~10° rotation (curved arrow) about an axis (gray stick) roughly parallel to the plane of the figure. Left are the refined models, and right the maps as in d.
Extended Data Figure 3 |
Extended Data Figure 3 |. Cryo-EM density from post-processed maps of non-ubiquitinated ID bound to ICL DNA.
a-b, Stereo view of the 3.3 Å cryo-EM density from the post-processed reconstruction using multi-body refinement. Map shows the vicinity of a, the FANCI ubiquitination site (Lys523 marked) with portions of FANCI residues 475–593 (cyan) and FANCD2 residues 174–287 (pink) shown in stick representation, and b, the FANCD2 ubiquitination site (Lys561 marked), with portions of FANCD2 residues 482–578 and of FANCI residues 123–223. O and N atoms are colored half-bonded red and blue, respectively, for both proteins. c, Stereo view of the map from a focusing on the ssDNA (5’ and 3’ ends marked) at the FANCI CTD, as well as a portion of the FANCI-bound dsDNA. The DNA is in stick representation colored half-bonded yellow, red and blue for C, O, N atoms, respectively. The map is shown at a low contour level because the ssDNA has high temperature factors, and its density is broken up due to the temperature-factor applied in post-processing being calculated from the entire map. ssDNA density before post-processing can be seen in the panel of maps in Extended Data Fig. 2, d and e. d-e, Mono view of the 3.3 Å cryo-EM density depicted as a semi-transparent surface at the hydrophobic core of d, the FANCINTD, showing the residues 202, 214, 217, 236–237, 271–272, and 300, and e, of the FANCD2NTD, showing the residues 347, 364, 368, 380, and 383–386.
Extended Data Figure 4 |
Extended Data Figure 4 |. DNA binding by the non-ubiquitinated ID complex.
a, DNA binds to an extended basic surface of FANCI. Cartoon representation showing FANCI side chains within potential contact distance of the DNA (top), and molecular surface colored according to the electrostatic potential calculated with PYMOL (bottom, colored −5 to +5 kT blue to red). The proteins are colored according to their domains, in purple, gray and cyan for the FANCI NTD, HD and CTD domains, respectively, and brown, gray, pink for the FANCD2 NTD, HD and CTD domains, respectively. The end of the dsDNA binds to a semi-circular groove consisting of helices α33b, α36b, α37, α40 and α42 (secondary structure elements numbered as in the mouse ID structure, with insertions denoted by letters after the helix number). This is analogous to the 7.8 Å crystallographic map of mouse FANCI bound to Y DNA, with the N-termini of helices and inter-helix loops providing multiple basic residues. The ICL-proximal portion of the duplex, which is absent from the shorter DNA used in the mouse FANCI crystals, is positioned against basic residues emanating from helices α15, α17 and α19b. The ssDNA rests against the sides of the α48 and α49 helices. The overall DNA density is of lower resolution than the surrounding protein, and in the refined model the DNA has high temperature factors suggesting it is significantly more mobile than the surrounding protein elements. Figure shows side chains for Arg287 on α15, Arg321, Lys336 and Lys339 on α17, Lys396 and Lys397 on α19b, Lys791, Lys793, Thr794 and Lys795 on α33b, Lys897, Lys898 and Lys902 on α36b, Lys980 on α40, Lys1026 on α42, Arg1178 on α46, and Lys1262, His1266, Lys1269 and Lys1270 on α48. b, FANCD2-DNA contacts are localized to the last four helical repeats of the CTD and a patch of basic residues on the NTD. Top figure shows the residues within contact distance of the DNA, colored as in a. The CTD residues involve the N-terminal portions of the inner helices of the helical repeats: Lys1172, Lys1174, Ser1175, Ser1178, Asn1179 and His1183 on α44, Arg1128, His1229 and Arg1236 on α46, Ser1287, His1288, His1292, Lys1296 and Tyr1297 on α48, and Thr1351, Arg1352, Gln1355 and His1356 on α50. NTD residues on α50 are Arg401, Arg404, Asn405 and Arg408. Bottom figure shows the corresponding molecular surface colored according to the electrostatic potential calculated with PYMOL (bottom, colored −5 to +5 kT blue to red). Note the absence of a basic patch at the HD-portion of the semi-circular groove (lower left portion of figure) compared to that of FANCI in a. c, Close-up view of the FANCD2 Arg1352 side chain in the DNA minor groove, and the residues that are in the vicinity of the flanking phosphodiester backbone. d, Close-up view of c, showing the 3.8 Å cryo-EM density centered on Arg1352, shown in stick representation. Only a subset of the side chains shown in c are visible in this view (His1288, His1292, Lys1236, Lys1296, Gln1355 and His1356). e, Superposition of the DNA-binding region of FANCD2 (pink) CTD on the corresponding region of the FANCI paralog (cyan) showing the different orientations of the FANCI dsDNA (blue) and FANCD2 dsDNA (magenta) in the semi-circular grooves of the respective proteins. Residues 905–1269 of FANCD2 were aligned on residues 1058–1376 of FANCI with a 2.2 Å r.m.s.d. in the positions of 185 Cα atoms.
Extended Data Figure 5 |
Extended Data Figure 5 |. Cryo-EM reconstructions of the non-ubiquitinated ID complex bound to 5’ flap DNA, Holliday junction DNA, and replication fork DNA.
a, Flow chart of single particle cryo-EM data processing. The consensus reconstruction map, temperature-factor sharpened and masked, is colored by local resolution estimated with the RELION3 postprocess program. Graph on the right shows gold-standard FSC plot between two independently refined half-maps for the consensus reconstruction with 87,802 particles. Dashed line marks the FSC cutoff of 0.143 that the FSC curve intersects at 4.0 Å. b, Cryo-EM map from the consensus reconstruction without temperature-factor sharpening. Also shown are cartoon representations of the FANCI (cyan), FANCD2 (pink) and FANCI-bound dsDNA (gold) from the ID-ICL DNA complex rigid-body fitted as multiple domains into the map. Schematic of the 5’ flap DNA is shown to the right of the map. c, 3D classification of the particles showing the conformational flexibility of FANCD2. Maps shown are after the particles from each 3D class were further refined in RELION to 4.7, 4.3, 4.3 and 4.9 Å, respectively. The maps are without temperature-factor sharpening to make the DNA easier to see. The ID complex and dsDNA, rigid body fitted into each map are also shown. d, The five 3D classes are superimposed by aligning the FANCI-portion of each map (left), or of each pdb (right) colored as in c. The lack of FANCD2-bound dsDNA is indicated by the label “ño FANCD2 DNA”. The density of the FANCD2 CTD is significantly weaker and flatter than the similarly calculated maps of the of the ID-ICL DNA complex. The curved arrow indicates the motion suggested by the 3D classification. In the most compact class (blue map), there is density extending from the FANCD2 CTD to the FANCI CTD. While we could not improve this density due to the limited number of particles, it suggests that the flexibility of the FANCD2 CTD may be important for the closing of the structure on ubiquitination. e, Close-up view of the best 3D class (pink in c) after 3D refinement of the particles prior to post processing. Orientation is similar to Figure 1c in the main text. Neither this map nor those of the other 3D classes have any evidence for a localized fork junction or for the 5’ ssDNA flap, suggesting the 5’ flap DNA binds to FANCI in multiple registers with no specificity for the junction. f, Flow chart of cryo-EM data processing for the ID complex bound to Holliday junction DNA. The consensus reconstruction map, temperature-factor sharpened and masked, is colored by local resolution estimated with the RELION3 postprocess program. Right graph shows the gold-standard FSC plot between two independently refined half-maps for the consensus reconstruction with 76,690 particles, with an FSC value of 0.143 (dashed line) at 4.1 Å. g, Cryo-EM map from the consensus reconstruction prior to post processing. Also shown are cartoon representations of the FANCI (cyan), FANCD2 (pink) and FANCI-bound dsDNA (gold) from the ID-ICL DNA complex rigid-body fitted into the map. Schematic of the Holliday junction DNA used is shown to the right of the map. h, 3D classification of the particles showing the conformational flexibility of FANCD2. Maps shown are after the particles from each 3D class were further refined in RELION to 6.9, 4.7, 6.6, 4.7 and 6.5 Å, respectively. The maps are without temperature-factor sharpening. The ID complex and dsDNA, rigid body fitted into each map are also shown. i, The five 3D classes are superimposed by aligning the FANCI-portion of each map (left), or of each pdb (right) colored as in h. j, Close-up view of the best 3D class (green in h) after 3D refinement of the particles prior to post processing. Unlike the map with the 5’ flap DNA, this map shows some bifurcation at one end of the duplex suggestive of the presence of the Holliday junction at a preferred location. This may be due to its shorter duplexes of 20 bp being just long enough to fill the FANCI groove. k, Cryo-EM data processing flow chart of ID bound to replication fork DNA. The consensus reconstruction map, temperature-factor sharpened and masked, is colored by local resolution estimated with the RELION3 postprocess program. The graph on the right shows the gold-standard FSC plot between two independently refined half-maps for the consensus reconstruction with 111,664 particles, with an FSC value of 0.143 (dashed line) at 3.9 Å. l, Cryo-EM map from the consensus reconstruction prior to post processing. Also shown are cartoon representations of the FANCI (cyan), FANCD2 (pink) and FANCI-bound dsDNA (gold) from the ID-ICL DNA complex rigid-body fitted into the map. Schematic of the replication fork DNA used is shown to the right of the map. m, 3D classification of the particles showing the conformational flexibility of FANCD2. Maps shown are after the particles from each 3D class were further refined in RELION to 4.8, 4.7, 4.6 and 4.4 Å, respectively. The maps are without temperature-factor sharpening. The ID complex and dsDNA, rigid body fitted into each map are also shown. n, The five 3D classes are superimposed by aligning the FANCI-portion of each map (left), or of each pdb (right) colored as in m. o, Close-up view of the best 3D class (orange in m) after 3D refinement of the particles prior to post processing.
Extended Data Figure 6 |
Extended Data Figure 6 |. Biochemical characterization of ID DNA binding and reconstitution of ID mono-ubiquitination.
a, Electrophoretic mobility shift assay (EMSA) of the ID complex binding to the indicated 32P-labeled DNA substrates (0.5 nM) in the presence of 1.4 μM unlabeled, 20 bp dsDNA as nonspecific competitor. The plots with a logarithmic X-axis show fraction bound in three repetitions of each experiment (blue, green, orange markers), and their mean value (black dash). Each binding isotherm fits a Hill slope model significantly better than a non-competitive binding model, even after excluding the highest protein concentration reactions where multiple shifted bands are apparent, and also in the absence of nonspecific competitor DNA (not shown). A binding curve (black line) simulated with the indicated Kd and Hill coefficient (ηH) values is shown on each plot. b, SDS-PAGE gel of the purified FA core complex. M.w.: molecular weight markers with their mass labeled; Core: FA Core complex with the constituent proteins labeled. The Core prep was performed at least 3 times, and an additional time with a different isolate of a stably transfected cell line with very similar results. c, SDS-PAGE of the ubiquitination reaction of the ID complex in the presence of a 58 bp nicked-DNA molecule and of three peaks from the fractionation of the reaction products on a Superose 6 gel-filtration column shown in d. The gel and gel filtration run of d are typical of the preparative reaction and purification performed at least 3 times with nicked DNA and once each for the DNA substrates of Extended Data 8a–c with similar results. d, Gel-filtration chromatography of the ubiquitination reaction products (blue plot) and of the DNA-only control (orange plot). The fraction marked 1 contains the core complex, fraction 2 the complex of uniquitinated FANCI and ubiquitinated FANCD2, and fraction 3 contains monomeric non-ubiquitinated FANCI and FANCD2, as well as the overlapping peak of excess DNA. e, Comparison of the gel-filtration chromatography profiles of the ID ubiquitination reaction product (blue plot) and of non-ubiquitinated ID (red plot), both at 8 μM, in the presence of 16 μM ICL-DNA and 100 mM NaCl. The chromatography and SDS-PAGE of f were repeated twice with similar results. f, 4 % TBE gels of the gel-filtration fractions marked with an arrow in e stained for protein with Coomassie Blue and for DNA with SYBR Gold. Compared to ubiquitinated ID, only a residual amount of non-ubiquitinated ID remains bound to DNA, and its DNA and ID-DNA bands are faint. Because gel filtration chromatography is more sensitive to the off rate of a complex than the EMSA assay, this suggests that the IDUb complex has a slower off rate consistent with its closed ring structure compared to the open-trough structure prior to ubiquitination. Complexes of IDUb with nicked DNA and with the other DNA substrates of Extended Data Fig. 8 behave similarly to the IDUb-ICL complex under these conditions (not shown).
Extended Data Figure 7 |
Extended Data Figure 7 |. Cryo-EM reconstruction of the IDUb complex bound to nicked DNA.
a, Micrograph of IDUb-nicked DNA particles. The particles were collected in three data sets. b, Flow chart of single particle cryo-EM data processing. Consensus (top) and focused maps from RELION3, temperature-factor sharpened and masked, are colored by local resolution estimated with the RELION3 postprocess program. The focused maps below roughly correspond to the left, top, and right portions of the consensus map. The maps are all oriented as the structure on the right (colored as in Fig. 2a). The resolution range is mapped to the colors in the inset next to each map. The particle has dimensions of 155 Å, 115 Å, 101 Å. Additional details are in Methods. c, Graph shows gold-standard FSC plots between two independently refined half-maps for the consensus reconstruction of the ID-ICL DNA (blue curve) and the three focused maps. The FSC curve for the final model versus the composite map combining the focused maps in REFMAC5 is shown in black. Dashed line marks the FSC cutoff of 0.143. d, Stereo view of the 3.5 Å cryo-EM density of the isopeptide bond between the ubiquitin Gly76 C atom and the Nζ atom of Lys523 of FANCI from the post-processed reconstruction of the focused refinement. UbI is green, FANCI cyan. O and N atoms are colored half-bonded red and blue, respectively, for both proteins. Also shown is FANCD2 Trp182 (pink) that packs with Lys523. e, Stereo view of the 3.5 Å cryo-EM density of the isopeptide bond between the ubiquitin Gly76 C atom and the Nζ atom of Lys561 of FANCD2 from the post-processed reconstruction. UbD2 is dark red, FANCD2 pink. f, Stereo view of the 3.4 Å cryo-EM density of the zipper β sheet of the IDUb complex. FANCI is cyan and FANCD2 pink. The arrow points to FANCI Arg1285 that is mutated to glutamine in Fanconi Anemia. Select hydrogen bonds (made by the β sheet and by Arg1285) are shown as green dotted lines. g, Mono view of the density in f, rendered semi-transparent, focusing on the vicinity of FANCI Arg1285. Arg1285 and the FANCD2 Glu1365 with which it forms a salt bridge are both in a buried environment as can be seen in e (the structural elements and density above the plane of the figure are not shown for clarity). Because there are no other basic residues near Glu1365 to neutralize its charge, the loss of the arginine charge in the FA R1285Q mutant would leave a net charge in a buried environment and destabilize the zipper. h, Mono view of the DNA density inside the ring, abutted by the zipper on the left side.
Extended Data Figure 8 |
Extended Data Figure 8 |. Cryo-EM reconstructions of the IDUb complex bound to ICL DNA, 5’ flap DNA and dsDNA, and of the ID-/Ub complex ubiquitinated only on FANCD2 bound to nicked DNA.
a, Cryo-EM reconstruction of IDUb bound to ICL DNA (same DNA as Extended Data Fig. 2a). The consensus map (top), temperature-factor sharpened and masked, is colored by local resolution estimated with the RELION3 postprocess program. The resolution range is mapped to the colors in the inset. The map is oriented as in Extended Data Fig. 7b. To make the DNA easier to see, the consensus map is also shown prior to temperature-factor sharpening with the FANCD2 portion above the plane of the figure clipped (middle, gray map) in the same orientation as Fig. 2c. The model shown is the IDUb-nicked DNA complex structure that was fit as a single body into the map with CHIMERA, without any further refinement of the coordinates. Because the DNA density in the consensus map appeared longer than the 20 bp dsDNA arms of the ICL DNA, we used 3D classification with partial signal subtraction followed by the reconstruction of the non-signal subtracted particles from four 3D classes (bottom row of four maps). This revealed that a 20 bp duplex arm goes in from either end of the clamp resulting in the consensus DNA density looking longer. In the 1st class, the DNA duplex reaches into the clamp from the FANCI side, and in the 2nd class from the FANCD2 side. The 3rd class appears to have mixed DNA registers with some bulbous density at the FANCD2 side and flat density at the FANCI side (the 4th class is devoid of DNA). This suggests that the ICL DNA has no preferred orientation in binding to IDUb. b, Cryo-EM reconstruction of IDUb bound to 5-flap DNA containing two 29 bp duplexes flanking the flap (same DNA as the non-ubiquitinated complex of Extended Data Fig. 5b). The top and middle density are the consensus maps with and without temperature-factor sharpening, respectively, colored as in a. The model shown is the IDUb-nicked DNA structure that was fit as a single body into the map. We did not refine the coordinates for this reconstruction, yet the DNA density overlaps well with the nicked DNA model. Unlike the ICL DNA complex, 3D classification failed to identify unique DNA conformations, and there was no evidence for any ssDNA branch (not shown). This suggests that either the flap is past the 29 bp duplex ends, or it can be accommodated within the clamp but not in a specific register that can be identified by 3D classification. c, Cryo-EM reconstruction of IDUb bound to 58 bp dsDNA, shown as in b. d, Gold-standard FSC plots for the consensus reconstructions of IDUb bound to the other DNA molecules discussed in text. The blue curve is the 3.8 Å reconstruction from 98,750 particles of IDUb bound to 5’ flap DNA, the red curve is the 3.8 Å reconstruction from 85,078 particles of IDUb bound to dsDNA, and the green curve is the 4.4 Å reconstruction from 28,519 particles of IDUb bound to ICL-DNA. e, Flow chart of single particle cryo-EM data processing for the ID-/Ub complex ubiquitinated only on FANCD2 bound to nicked DNA. Consensus (top) and focused maps, temperature-factor sharpened and masked, are colored by local resolution estimated with the RELION3 postprocess program. The resolution range is mapped to the colors in the inset next to each map. f, Graph shows gold-standard FSC plots between two independently refined half-maps for the consensus reconstruction (blue curve) and the three focused maps. The FSC curve for the final model versus the composite map is shown in black. Dashed line marks the FSC cutoff of 0.143. g-h, The singly mono-ubiquitinated ID-/Ub structure is overall very similar to IDUb, and the two superimpose with a 0.57 Å r.m.s.d. in the positions of 2,429 common Cα atoms. There is only a small shift in the FANCD2 segment that interacts with the FANCI ubiquitin (UbI) as shown in the close-up view of h, where the red arrows indicate the ~1.5 Å local motion the FANCD2 helical repeats undergo when FANCI is also ubiquitinated.
Extended Data Figure 9 |
Extended Data Figure 9 |. Ubiquitination induces FANCD2 conformational changes associated with alternative FANCI-FANCD2 contacts; DNA binding activity of IDUb.
a, After ubiquitination, FANCI does not change significantly (entire molecule can be superimposed with a 1.6 Å r.m.s.d in 1132 Cα positions), but FANCD2 undergoes two changes. FANCD2 from the ID complex (salmon) is superimposed on that of IDUb (pink) by aligning the 2nd half of their NTDs (residues 255–587; 1.8 Å r.m.s.d. for 308 Cα positions), a segment that changes little on ubiquitination. UbD2 that is covalently attached to FANCD2 is in red, and the UbI with which it packs in green. The N-terminal portion of the NTD, which rotates by 38° towards FANCI as a mostly rigid body (residues 45 to 254, 0.68 Å r.m.s.d. for 202 Cα) is approximately marked by a bracket. This rotation at the center of the UbI binding site allows FANCD2 to better embrace UbI, and also to interact with FANCI (NTD-HD junction, residues 529 to 593), the latter involving similar residues on FANCD2 but mostly different ones on FANCI. Similarly marked is the HD domain (residues 604–928) that rotates relative to the NTD by 15°. Additional tilting of helices within the HD domain results in the CTD that follows (residues 929 to C-termini also marked) being rotated by 20° degrees relative to the invariant portion of the NTD. b-e, The FANCI and FANCD2 ubiquitin binding structural elements are distinct from commonly occurring ubiquitin-binding domains. Superposition of the UbI (green) bound to FANCD2Ub (pink) on the ubiquitin (orange) bound to the dimeric Vps29 CUE domain (blue) from PDBID 1P3Q in b, to the Cbl-b UBA domain (PDBID 2OOP) in c, to the UBZ domain of Faap20 (PDBID 3WWQ) in d, and to the UIM domain of Vps27 (PDBID 1Q0W) in e. The ubiquitin hydrophobic patch residues (Leu8, Ile44, and Val70) are shown in stick representation for both ubiquitin molecules in each figure. The blue sphere in d is the Zn atom of the UBZ domain. Orientation similar to that of Figure 4a. It has been suggested that FANCD2 shares sequence homology with the CUE domain. While the 47-residue region of proposed homology (residues 191–237) partially overlaps the Ub-binding site, its structure is unrelated to the CUE domain, and Ub binding by FANCD2 is distinct. f, Molecular surface colored according to electrostatic potential calculated with PYMOL in the absence of DNA (colored −5 to +5 kT blue to red), in the same view as Figure 4d and with structural elements and surfaces above the DNA similarly clipped to reveal the DNA. As with the ID-ICL DNA complex, the FANCIUb groove partially encircles the DNA through basic and polar residues from α33b and α36b on one side of the groove and α40, α42 on the other. Near the middle of the DNA, however, the extension of α48 that results from coiling with FANCD2Ub α50 (Fig. 3e) gives rise to a new semicircular basic groove, between α46 and α48 on one side and the NTD α19b and α20 on the other, into which dsDNA binds (Fig. 4d). This is associated with one of the two DNA bends, which redirects the duplex away from clashing with the new position of FANCD2. Thereafter, the second bend occurs as the dsDNA is redirected by the FANCD2 CTD, which uses the localized patch of α48 and α50 to bind to the duplex analogously to the ID-ICL DNA complex. The side chains near the DNA, shown in Figure 4d as sticks, are from FANCIUb residues Lys291 (α15), Lys397 (α19b), Ser411 (α20), Lys793, Thr794 on α33b, Lys898 (α36b), Lys980 (α40), Lys1026 (α42), Lys1164 (α46), and Thr1238, Arg1242, Arg1245 and Lys1248 on the extended α48; and from FANCD2Ub residues His1288, His1292, and Arg1299 on α48, and Thr1351, Arg1352 and Gln1355 on α50. The sites of DNA bending, of 26° and 31°, are centered on the 11th and 21st base pairs from the FANCI end, respectively, with large roll values over three base-pair steps. g, The IDUb Kd values for dsDNA, nicked, 5’ flap, ICL and fork DNA vary by less than a factor of two, with dsDNA and nicked DNA exhibiting slightly tighter binding. EMSA of the equimolar mixture of the mono-ubiquitinated FANCIUb and FANCD2Ub, each at the indicated concentrations, binding to the 32P-labeled DNA substrates (0.5 nM) shown schematically. The plots with a logarithmic X-axis show fraction bound in at least three repetitions of each experiment (different color and shape markers) and their mean value (black dash). As with the non-ubiquitinated complex, the binding isotherms fit a Hill slope model best. A binding curve (black line) simulated with the indicated Kd and Hill coefficient (ηH) values is shown on each plot.
Figure 1 |
Figure 1 |. Human ID complex bound to ICL DNA.
a, Overall structure with FANCI colored cyan, FANCD2 salmon, and ICL DNA yellow. The mono-ubiquitination sites are shown as sticks (labeled). The helical axes of the DNA duplexes are shown as gray lines. Inset shows schematic of the ICL DNA, with triazole-linked deoxycytidine residues in red (not built in structure). b, View looking down the left side of the horizontal axis of a. c, Cryo-EM density without temperature-factor sharpening. Orientation similar to a. DNA model is red, and its density yellow. d, Linear representation marking domain boundaries. Darker hues are disordered C-terminal segments that become ordered on ubiquitination; dashed lines disordered in both.
Figure 2 |
Figure 2 |. Mono-ubiquitinated human IDUb complex bound to nicked DNA.
a, Overall IDUb-DNA structure with FANCD2Ub pink (labeled D2), FANCIUb cyan (I), FANCI ubiquitin (UbI) green, FANCD2 ubiquitin (UbD2) red, and DNA yellow. The N and C termini are labeled (FANCD2 N-terminus obscured in this view). FANCI is oriented as in Fig. 1b. b, View looking down the left side of the horizontal axis of a. c, Cryo-EM density without temperature-factor sharpening. Orientation as in b, but parts of FANCD2 are cropped to reveal the internal DNA (red, density yellow).
Figure 3 |
Figure 3 |. Conformational changes on ubiquitination.
a, Non-ubiquitinated ID (cyan, salmon and blue for FANCI, FANCD2 and DNA, respectively) superimposed on IDUb (cyan, magenta and yellow for FANCIUb, FANCD2Ub, and DNA, respectively) by aligning FANCI. UbD2 is red (UbI obscured in this view). The rotation axis is shown as a thick black stick with the rotation indicated by a circular arrow. FANCD2 movement is indicated by a dashed arrow linking equivalent structural elements. The CTD-CTD interaction region is labeled “zipper”. Orientation similar to Fig. 2a. b, View looking approximately down the vertical axis of a with the two complexes rendered as semi-transparent surfaces to reveal the DNA inside. c, FANCI (left top, cyan), FANCIUb (left bottom, cyan), FANCD2 (right top, pink), and FANCD2Ub (right bottom, pink) proteins showing residues (thick sticks) with a reduction in solvent accessibility due to interactions between FANCI and FANCD2 (top pair, blue sticks), between FANCIUb and FANCD2Ub (bottom pair, red sticks), and between each protein and the ubiquitin of the other paralog (bottom pair, green sticks). Yellow spheres mark ubiquitination sites. d, Close-up view of the ID and IDUb complexes superimposed on the FANCD2 ubiquitination site (top) or on the FANCI ubiquitination site (bottom). Non-ubiquitinated ID is transparent gray. e, The IDUb CTD zipper looking down the vertical axis of b. Residues unstructured in non-ubiquitinated ID are shown in darker shades and are labeled. Dashed cyan line is a loop unstructured in both complexes. f, SDS-PAGE gel of the de-ubiquitination of wild type IDUb and mutant ImutDUb complexes, both at 940 nM, by USP1-UAF1 (400 nM) at the indicated time points, detected by Coomassie staining (top) or anti-ubiquitin immunoblot (bottom). The positions of the substrates and products are marked. Repeated n=3 times.
Figure 4 |
Figure 4 |. Interactions with ubiquitin and DNA.
a, Superposition of the FANCD2Ub-UbI and FANCIUb-UbD2 interfaces by aligning UbD2 (red) with UbI (green). The paralogs that each ubiquitin is attached to are not shown for clarity. The ubiquitin hydrophobic patch residues (Leu8, Ile44, and Val70) are shown as sticks for both ubiquitin molecules. Colored as in Fig. 2a. b, Close-up view of the non-covalent interface between FANCD2Ub (pink) and UbI (green) showing the residues within interaction distance as sticks (darker colors). Yellow dotted lines indicate potential hydrogen bonds. c, Close-up view of the reciprocal interface between FANCIUb (cyan) and UbD2 (green). d, Cartoon, colored as in Fig. 2a, showing IDUb side chains within contact distance of the DNA as sticks (darker hues). Gray sticks show the helical axes for the three relatively straight segments of the DNA. The majority of FANCD2Ub and parts of FANCIUb are clipped above the plane of the figure to make the DNA visible (Extended Data Fig. 9f legend lists side chains shown). e, Autoradiogram of DNA binding competition time course after 8 μM of unlabeled 67 bp dsDNA was added to the IDUb complex (800 nM) pre-assembled on a 95 bp circular nicked DNA or the corresponding linear nicked DNA, both at 400 nM with only 2 nM of each 32P labeled. 32P DNA-protein complexes contain multiple IDUb proteins due to the length of each DNA. Fraction of DNA bound is quantified in the chart (repetitions marked by circles, and their mean by a black dash; n=3).

Comment in

References

    1. Ceccaldi R, Sarangi P & D’Andrea AD The Fanconi anaemia pathway: new players and new functions. Nature reviews. Molecular cell biology 17, 337–349, doi:10.1038/nrm.2016.48 (2016). - DOI - PubMed
    1. Zhang J et al. DNA interstrand cross-link repair requires replication-fork convergence. Nature structural & molecular biology 22, 242–247, doi:10.1038/nsmb.2956 (2015). - DOI - PMC - PubMed
    1. Boisvert RA & Howlett NG The Fanconi anemia ID2 complex: dueling saxes at the crossroads. Cell cycle 13, 2999–3015, doi:10.4161/15384101.2014.956475 (2014). - DOI - PMC - PubMed
    1. Park WH et al. Direct DNA binding activity of the Fanconi anemia D2 protein. J Biol Chem 280, 23593–23598, doi:M503730200 [pii] 0.1074/jbc.M503730200 (2005). - PubMed
    1. Yuan F, El Hokayem J, Zhou W & Zhang Y FANCI protein binds to DNA and interacts with FANCD2 to recognize branched structures. J Biol Chem 284, 24443–24452, doi:M109.016006 [pii] 10.1074/jbc.M109.016006 (2009). - DOI - PMC - PubMed

Extended Data References

    1. Joo W et al. Structure of the FANCI-FANCD2 complex: insights into the Fanconi anemia DNA repair pathway. Science 333, 312–316, doi:10.1126/science.1205805 (2011). - DOI - PMC - PubMed
    1. Ishiai M et al. FANCI phosphorylation functions as a molecular switch to turn on the Fanconi anemia pathway. Nature structural & molecular biology 15, 1138–1146, doi:10.1038/nsmb.1504 (2008). - DOI - PMC - PubMed
    1. Rego MA, Kolling F. W. t., Vuono EA, Mauro M & Howlett NG Regulation of the Fanconi anemia pathway by a CUE ubiquitin-binding domain in the FANCD2 protein. Blood 120, 2109–2117, doi:10.1182/blood-2012-02-410472 (2012). - DOI - PMC - PubMed

Publication types

MeSH terms