. 2020 Apr;580(7802):263-268.
doi: 10.1038/s41586-020-2111-5. Epub 2020 Mar 18.

An intestinal zinc sensor regulates food intake and developmental growth

Affiliations

An intestinal zinc sensor regulates food intake and developmental growth

Siamak Redhai et al. Nature. 2020 Apr.

Abstract

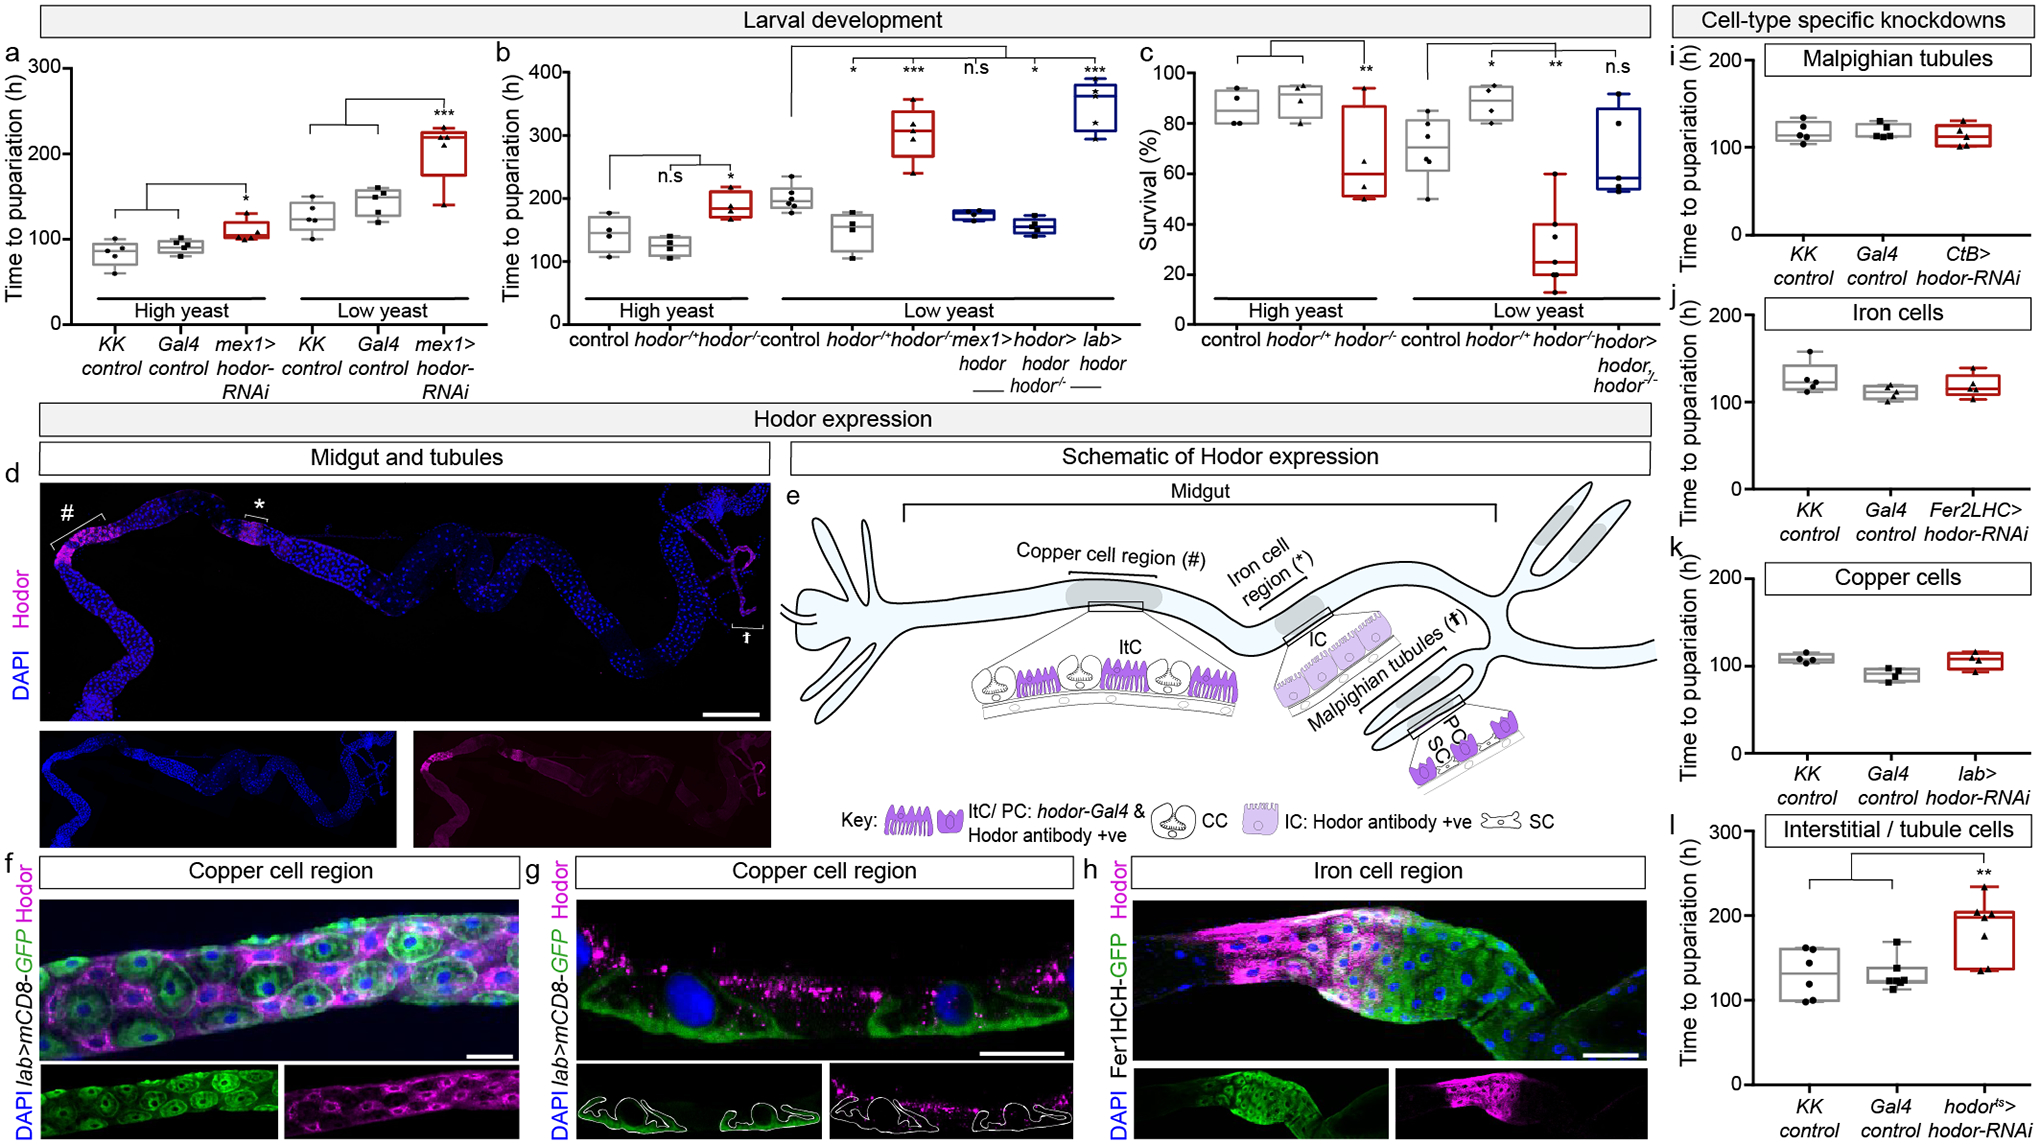
In cells, organs and whole organisms, nutrient sensing is key to maintaining homeostasis and adapting to a fluctuating environment1. In many animals, nutrient sensors are found within the enteroendocrine cells of the digestive system; however, less is known about nutrient sensing in their cellular siblings, the absorptive enterocytes1. Here we use a genetic screen in Drosophila melanogaster to identify Hodor, an ionotropic receptor in enterocytes that sustains larval development, particularly in nutrient-scarce conditions. Experiments in Xenopus oocytes and flies indicate that Hodor is a pH-sensitive, zinc-gated chloride channel that mediates a previously unrecognized dietary preference for zinc. Hodor controls systemic growth from a subset of enterocytes-interstitial cells-by promoting food intake and insulin/IGF signalling. Although Hodor sustains gut luminal acidity and restrains microbial loads, its effect on systemic growth results from the modulation of Tor signalling and lysosomal homeostasis within interstitial cells. Hodor-like genes are insect-specific, and may represent targets for the control of disease vectors. Indeed, CRISPR-Cas9 genome editing revealed that the single hodor orthologue in Anopheles gambiae is an essential gene. Our findings highlight the need to consider the instructive contributions of metals-and, more generally, micronutrients-to energy homeostasis.


Conflict of interest statement

COMPETING INTERESTS

The authors declare no competing interests.

Figures

Extended Data Fig. 1.
Extended Data Fig. 1.. Enterocyte screen, hodor mutant validation and hodor knockdown phenotypes.
a, Design of enterocyte specific RNAi-screen and generation of hodor mutant. Distribution of the categories of genes targeted for intestinal knockdown and number of genes and lines tested in each round of the genetic screen. b, Larval gut expressing UAS-Stinger-GFP under the control of mex1-Gal4, showing expression in all enterocytes, including those in the copper cell region (#) and iron cell region (*). There is no expression in the Malpighian tubules (†). c, Flies carrying UAS-RNAi targeted against candidate genes were crossed to those carrying mex1-Gal4 to achieve enterocyte-specific knockdown in the resulting larval progeny, which were either placed on high or low yeast food and allowed to develop into pupae. d, Results from the first round of the RNAi screen using mex1-Gal4 with plots showing the average time to pupariation after egg laying (AEL). Blue stars represent four different control lines crossed to mex1-Gal4. Linear models for these control lines (analysed together) are displayed as dashed lines with a 90% prediction interval shown in dotted lines; knockdown of genes B (CG11340) and F (CG4797) frequently led to a delay to pupariation. See Source Data 1 for the lines/genes that specific letters correspond to, and Supplementary Information for details of – and reasons for – the percentage deviation data display. e, Strategy for generating hodor mutants using pTVcherry vector to direct homologous recombination. Candidate recombinants were recovered after several crosses, identified based on viability and eye colour. f, PCR verification of integration of pTVcherry construct at the hodor locus, no band is seen in w1118 controls (1,3), but a correctly-sized band of 3–4kbp (arrowheads) is seen in hodor +/− (2,4). g, Real-Time quantitative PCR of control and hodor mutant larvae relative to gapdh, showing absence of hodor transcripts in the mutant. h, Larval survival in low yeast conditions when hodor is knocked down in all enterocytes using mex1-Gal4. i, RNAi targeting a different segment of the hodor transcript also causes a developmental delay when expressed with mex1-Gal4. j, Limiting expression of hodor RNAi to interstitial cells and principal cells of the Malpighian tubules (using hodor-Gal4) causes a significant delay to development. See Supplementary information for sample sizes and full genotypes. Scale bar b: 1mm. Where more than two groups were compared, an ordinary one-way ANOVA test was performed with a Tukey post-hoc test. Significance values are denoted as follows: p< 0.05 *, p< 0.01 **, p< 0.001 ***. Box plots: line, median; box, 75th–25th percentiles; whiskers, minimum to maximum.
Extended Data Fig. 2.
Extended Data Fig. 2.. Gal4 driver lines used in this study.
a, Larval guts stained with anti-Hodor show immunoreactivity in the copper cell (#) and iron cell (*) regions of the gut and the Malpighian tubules (†) in control animals, whilst this staining pattern is absent in hodor mutants. b, RNAi-mediated hodor knockdown in enterocytes (using mex1-Gal4) substantially reduces Hodor protein levels. c, RNAi-mediated hodor knockdown using hodor-Gal4 reduces protein levels considerably in the copper cell region (#) but does not noticeably reduce levels in the iron cell region (*). d, Expression of UAS-Stinger-GFP in interstitial cells (#) and Malpighian tubules (†) using hodor-Gal4; note absence of GFP in the iron cell region (*). e, Staining of iron cells highlighted in green (Fer2LCH>mCD8-GFP) with Hodor antibody illustrating overlap between the two in the anterior portion. f, Expression of lab-Gal4 (visualised as lab>mCD8-GFP expression) is seen in the copper cells (but not the interstitial cells) of the copper cell region. The panel to the right shows a higher magnification image of the copper cell region. g, Expression of CtB-Gal4 (visualised as CtB>Stinger-GFP expression) is confined to the principal cells of Malpighian tubules. h, R2R4-Gal4 (visualised as R2R4>Stinger-GFP expression) is confined to a subset of enterocytes in the posterior midgut. Note its absence from the copper (#) and iron cell (*) regions as well as from Malpighian tubules (†). See Supplementary information for sample sizes and full genotypes. Scale bars: a, d, f and h: 1mm; e, b, 200μm; c, 300μm; g, 200μm; f inset, 50μm.
Extended Data Fig. 3.
Extended Data Fig. 3.. Hodor controls food intake and systemic growth.
a, Comparison of embryonic viability between control (w1118), heterozygous and homozygous hodor mutant larvae; there are no significant differences. b, Developmental progression of larvae lacking hodor compared to control animals (w1118). c, Pupal volume of hodor mutants compared to controls; each data point represents one pupa. d, Wing size measurements in control vs hodor mutant adults; no significant differences are apparent (see Methods for details of quantification, each data point represents one wing). e, Reduced pAkt relative to total protein in second-instar hodor mutants compared to controls, all raised on a low-yeast diet and repeated three times. pAkt in hodor mutants is comparable to that of wild-type larvae starved for 15h. f, Reduced food intake in hodor-Gal4-driven hodor knockdown when compared to control larvae. Experiments were performed using second-instar larvae raised on a low-yeast diet. g, Electron micrographs of the junctional region (arrow) between an interstitial cell and a copper cell, showing no obvious defects in first-instar hodor mutants. h, Smurf assay (see Methods) on second-instar control larvae and hodor mutants (examples are representative of at least 6 larvae per genotype). No leakage of blue dye from the intestine was seen in either group. i, Overexpression of hodor in interstitial cells using hodor-gal4 does not alter developmental rate in either high or low yeast conditions. j-k, Activation or inactivation of Tor signalling in hodor-expressing cells does not affect developmental rate (j) or food intake (k); none of the genetic manipulations are significantly different compared to their respective controls. l, Modulation of Rag and Gator1 complex components in the interstitial cells of hodor mutants (from hodor-Gal4) does not rescue/exacerbate their developmental delay. See Supplementary information for sample sizes and full genotypes. Scale bars: b, 0.5mm; d, 250μm; g, 500nm; h, 400μm. Where more than two groups were compared, an ordinary one-way ANOVA test was performed with a Tukey post-hoc test. Significance values are denoted as follows: p< 0.05 *, p< 0.01 **, p< 0.001 ***. Box plots: line, median; box, 75th–25th percentiles; whiskers, minimum to maximum.
Extended Data Fig. 4.
Extended Data Fig. 4.. Hodor sustains luminal acidity and luminal/cell volume.
a, The copper cell region (#) of Drosophila larvae is normally acidic (bromophenol blue dye appears yellow/orange, see Methods), but becomes less acidic (purple/blue) when using hodor RNAi in interstitial cells (hodor-gal4) or in hodor mutants. The latter phenotype can be rescued by re-expressing hodor in hodor-Gal4-expressing cells. Intestinal acidity is also lost by downregulating the gene coding for the Vha16–1 subunit of the V-ATPase proton pump in copper cells using lab-Gal4. b, Quantifications of intestinal acidity, depletion (by RNAi) or loss of hodor results in a reduction in the number of larvae with acidic middle midguts, as does depletion of the V-ATPase subunit Vha16–1 in copper cells using lab-gal4. c, Larval developmental rate is unaffected when acidity is lost due to reducing V-ATPase activity within copper cells (using lab-Gal4). d, Electron micrographs of interstitial cells of first-instar larvae, showing a reduction in their characteristic basal infoldings (arrows) in hodor mutants (* denotes basal lamina) relative to control cells. e, hodor-Gal4 driven mCD8-GFP expression in interstitial cells of control and hodor mutant larvae reveals an increase in luminal volume (*) and interstitial cell volume (insets with quantifications to the right) in first-instar mutant larvae when compared to controls (all raised on a low-yeast diet). See Methods for details of volume quantifications. f, Overexpression of the dominant-negative Shibire ShiK44A in hodor-expressing cells (using hodor-Gal4) reveals an increase in interstitial cell volume in hodor second-instar mutant larvae relative to controls (all raised on low-yeast diet). Lysotracker staining in green was used to reveal their cytoplasm. Quantifications are shown to the right. Second-instar larvae raised on a low-yeast diet were used for all experiments involving ShiK44A expression. g, This genetic manipulation also results in an increase in the width of the copper cell region (#) but does not affect the subcellular localisation of Hodor in interstitial cells (insets). h, Quantifications of copper cell region width in controls, hodor mutant larvae and larvae expressing ShiK44A from hodor-Gal4. i, Expression of Shikk44A in hodor-expressing cells (hodor> ShiK44A) does not alter developmental rate. See Supplementary information for sample sizes and full genotypes. Scale bars: a, 500μm; d, 500nm; e and f, 10μm; g: 250μm. For comparisons involving two groups, a non-parametric Mann Whitney U test was used. Where more than two groups were compared, an ordinary one-way ANOVA test was performed with a Tukey post-hoc test. Significance values are denoted as follows: p< 0.05 *, p< 0.01 **, p< 0.001 ***. Box plots: line, median; box, 75th–25th percentiles; whiskers, minimum to maximum.
Extended Data Fig. 5.
Extended Data Fig. 5.. The microbiota of hodor mutants.
a, Increased bacterial loads (CFU/larvae) in hodor mutants when compared to control larvae. Bacterial loads were assessed in third-instar larvae raised on a high-yeast diet. b-c, Developmental rate of control and hodor mutant larvae in germ-free conditions, or following re-colonisation with Acetobacter pomorum or Lactobacillus plantarum in either high (b) or low-yeast (c) conditions. hodor mutants remain developmentally delayed in germ-free conditions, particularly when reared on a low-yeast diet. Mono-association partially rescues the developmental delay of all larvae in low-yeast conditions, but the difference in developmental rate between control and hodor mutant larvae persists. d, Representative images of FluoZin-3AM stainings (a zinc dye) in the copper cell region of larvae reared in germ-free conditions or bi-associated with Acetobacter pomorum and Lactobacillus plantarum. More zinc is apparent in the copper cell region of high yeast-fed larvae relative to low yeast-fed larvae, but this is unaffected by the presence of microbiota. e, Quantifications of zinc staining in copper cell region. See Supplementary information for sample sizes and full genotypes. Scale bars: d, 30μm. For comparisons involving two groups, a non-parametric Mann Whitney U test was used. Where more than two groups were compared, an ordinary one-way ANOVA test was performed with a Tukey post-hoc test. Significance values are denoted as follows: p< 0.05 *, p< 0.01 **, p< 0.001 ***. Box plots: line, median; box, 75th–25th percentiles; whiskers, minimum to maximum.
Extended Data Fig. 6.
Extended Data Fig. 6.. Hodor gating, transport and effect on food intake.
a, Mutational free energy space, where each double mutant is plotted as zinc binding free energy and structural stability. The E255K-E296F mutant pair (black dot) was selected to increase the free energy of binding but keep the structural stability as low as possible to avoid refolding of the protein. b, Zinc-activated currents from oocytes expressing wild-type Hodor (top) or mutant Hodor-E255K-E296F (bottom) in response to the indicated concentrations (b). c, Activation (top) and deactivation (bottom) kinetics of currents elicited by 50μM ZnCl2 were significantly faster in Hodor-E255K-E296F (n=4–5, p<0.05 for ON, p<0.001 for OFF, Welch’s t-test). d, Concentration dependence of zinc-activated currents from oocytes expressing Hodor (sigmoidal fit from Figure 3B in gray) compared with that of Hodor-E255K-E296F (in red). The estimated EC50 for Hodor-E255K-E297F was comparable to wild-type Hodor (119.90μM, 95% confidence interval 104.70 to 137.10μM), with the only significant difference observed in response to 50μM ZnCl2 (p<0.05, two-way ANOVA with post hoc Bonferroni test, n = 5–9). Data represented as mean ± s.e.m., n denotes number of oocytes. e, Current-voltage (I-V) relationship of zinc-activated currents from uninjected oocytes in response to the indicated concentrations. f, Preference index plotted over time for larvae given a choice between high- and low-yeast diets. Both control and hodor mutant larvae develop a significant preference for a high-yeast diet (positive numbers) after 24h. g, hodor-Gal4-driven ClopHensor expression in live interstitial cells reveals a reduction in intracellular chloride levels (increased 458nm/543nm ratio) in first-instar larvae raised on a low-yeast diet supplemented with 0.4mM ZnSO4 compared to larvae raised on a low-yeast diet only. Chloride levels went from ca. 8.6mM in controls to ca. 5.7mM in larvae raised on a ZnSO4-supplemented diet, calculated based on calibration in Extended Data Fig. 6h. Representative 458nm fluorescence images are shown to the left. h, Calibration of the hodor-Gal4 driven ClopHensor in interstitial cells with eight different chloride concentrations (see Methods for details). The calibration graph to the left shows the sigmoidal curve interpolated from individual 458nm/543nm ratios obtained using the different chloride concentrations. This graph enables conversion of absorbance ratios to chloride concentration. Images to the right show representative 458nm signals for each concentration. See Supplementary information for sample sizes and full genotypes. Scale bars: g and h, 30μm. For comparisons involving two groups, a non-parametric Mann Whitney U test was used. Where more than two groups were compared, an ordinary one-way ANOVA test was performed with a Tukey post-hoc test. Significance values are denoted as follows: p< 0.05 *, p< 0.01 **, p< 0.001 ***. Boxplots show both minimum and maximum values. Box plots: line, median; box, 75th–25th percentiles; whiskers, minimum to maximum.
Extended Data Fig. 7.
Extended Data Fig. 7.. Intestinal zinc stainings.
a, Validation of the zinc-sensitive dye, FluoZin-3AM, in adult and larval Malpighian tubules. The tubules of w1118 adults have less zinc than those of wild-type (OrR) adults, which can be increased by supplementing their adult diet with 1mM ZnCl2 for 3 days (left panels). A more modest reduction in zinc levels is observed in larval tubules of second-instar w1118 larvae relative to wild-type OrR larvae (right panels). b, FluoZin-3AM staining in the middle midgut of second-instar wild-type larvae (OrR, which harbour a wild-type w gene), w mutant larvae (w1118), w mutant larvae with a mini-w transgene (UAS-Rheb/+) and hodor mutant larvae (which are mutant for w but carry mini-w transgenes). # denotes copper cell region, * denotes iron cell region. Panels to the right show higher magnification images of the copper cell region. Zinc levels are higher in the copper cell region of wild-type larvae relative to the other genotypes, which have comparable zinc. Bottom panel shows FluoZin-3AM staining of a wild-type (OrR) adult midgut. There is no apparent zinc enrichment in the copper cell region (#). c, Quantification of intestinal zinc intensity in the copper cell region. In both c and d, larvae were raised on a low-yeast diet. d, Wild-type OrR larvae are significantly faster to reach the pupal stage than w1118 in low yeast conditions, whilst hodor−/− still causes a significant developmental delay in either a genetic background with an intact w gene (w+; hodor−/−) or when backcrossed 8 times into a w mutant background lacking the w gene (w; hodor−/−). e, Heterozygous lines carrying mini-w are developmentally faster than w1118 larvae in low-yeast conditions. Scale bars; a: 50μm b: 500μm; insert 50μm. See Supplementary information for sample sizes and full genotypes. For comparisons involving two groups, a non-parametric Mann Whitney U test was used. Where more than two groups were compared, an ordinary one-way ANOVA test was performed with a Tukey post-hoc test. Significance values are denoted as follows: p< 0.05 *, p< 0.01 **, p< 0.001 ***. Boxplots show both minimum and maximum values. Box plots: line, median; box, 75th–25th percentiles; whiskers, minimum to maximum.
Extended Data Fig. 8.
Extended Data Fig. 8.. Subcellular localisation of Hodor.
a, Quantification of the fraction of Hodor-positive punctae that co-express Rab 5, 7, 11 (all of which are endogenously tagged with YFP), Lysotracker or Lamp1 (endogenously expressed Lamp1-mCherry). b-d, Co-expression analysis reveals limited overlap between Hodor immunoreactivity and the early endosome marker Rab5 (b) or the recycling endosome marker Rab11 (d), whilst more pronounced overlap is apparent with late endosome/lysosome marker Rab7 (c). e, The majority of Lamp1-positive structures co-expressed Hodor on the apical side of interstitial cells (* denotes the intestinal lumen). Larvae were briefly starved (4h) prior to dissection in order to visualise lysosomes as punctate structures. f, The endogenously expressed GFP-tagged Vha16–1 subunit of the V-ATPase complex is predominantly localised to the copper cell region (#) within the larval intestine. g, Expression of Vha16–1-GFP is apparent in both the copper cells and, to a lesser extent, the interstitial cells. See Supplementary information for sample sizes and full genotypes. Scale bars: b, c, d and e, 10μm; f, 200μm; g, 30μm. N: nucleus. Significance values are denoted as follows: p< 0.05 *, p< 0.01 **, p< 0.001 ***. Box plots: line, median; box, 75th–25th percentiles; whiskers, minimum to maximum.
Extended Data Fig. 9.
Extended Data Fig. 9.. Hodor regulates autophagy.
a, Representative expression of Lysosensor, Lysotracker, Lamp1-mCherry and hodor-Gal4-driven p62-GFP in the copper cell region of control larvae, larvae in which the V-ATPase subunit Vha44 has been downregulated in interstitial cells (using hodor-Gal4) or hodor mutant larvae. Vha44 knockdown and, to a lesser extent, hodor mutation result in an increase in the number of punctae positive for these markers. b, Quantifications of the number of punctae positive for the above mentioned markers in all three types of larvae shown in a. c, hodor mutants expressing the dual autophagosome/autolysosome marker UAS-GFP-mCherry-Atg8a in all enterocytes (using mex1-Gal4) show regional enrichment of autophagy in both the copper cell (#) and iron cell (*) regions when compared to an anterior portion of the gut (^). Note the appearance of GFP-positive punctae in the copper cell region (#), suggestive of defective autolysosomes unable to quench the GFP signal. d, hodor-Gal4-driven expression of GFP-mCherry-Atg8a in interstitial cells of starved hodor mutants. Large subcellular compartments positive for both GFP and mCherry are apparent. e, Quantification of GFP- and/or mCherry-positive Atg8a-expressing autophagosomes/autolysosomes in the copper cell region of fed or starved controls, and fed or starved hodor mutants (left graph, Atg8a reporter expressed from hodor-Gal4; right graph, Atg8a reporter expressed from mex1-Gal4 in fed hodor mutants). See Supplementary information for sample sizes and full genotypes. Scale bars: a, 30μm; c, 500μm; d, 45μm. Where more than two groups were compared, an ordinary one-way ANOVA test was performed with a Tukey post-hoc test. Significance values are denoted as follows: p< 0.05 *, p< 0.01 **, p< 0.001 ***. Box plots: line, median; box, 75th–25th percentiles; whiskers, minimum to maximum.
Extended Data Fig. 10.
Extended Data Fig. 10.. Hodor is an insect-specific gene, essential in A. gambiae.
a, Nucleotide-level maximum likelihood phylogeny of the hodor gene family highlighting successive duplication events at the base of the Schizophora (orange and red nodes, see Methods for details of phylogenetic reconstruction, and Extended Data Fig. 10 for a complete gene family tree). Bootstrap support is indicated along individual branches as a percentage of 1000 rapid bootstraps. b, gRNA target site within exon 2 of the Anopheles gambiae one-to-many orthologue AGAP009616 of fly hodor-like genes, the diagnostic primers used for genotyping and the three frameshift mutants recovered. PAM: protospacer adjacent motif. c, Recovering AGAP009616 mutants. d, Genotyping the progeny of crosses between verified heterozygote males and females revealed that AGAP009616 homozygous mutant adults are inviable. See Methods for details.
Extended Data Fig. 11.
Extended Data Fig. 11.. Current model of Hodor functions.
Hodor resides in the apical membrane and on the lysosomes of gut interstitial cells (highlighted in blue, adjacent to acid-secreting copper cells (#). Zinc sensing by Hodor promotes chloride transport and Tor signalling within interstitial cells. Hodor/Tor signalling in interstitial cells in turn promotes systemic growth through a neural relay, activating insulin-like signalling and thereby sustaining developmental rate, and 2) by promoting food intake via an as yet unknown mechanism independent of the brain insulin-producing cells. The reduced insulin signalling observed in hodor mutants may be secondary to their reduced food intake (hence the dashed arrow).
Fig. 1.
Fig. 1.
a, Intestinal Hodor sustains larval growth. Enterocyte-specific (mex1-Gal4 driven) hodor knockdown increases time to pupariation, particularly in nutrient-poor (low-yeast) conditions. b, Developmental delay of hodor mutants (increased time to pupariation) in both nutrient-rich (high yeast) and nutrient-poor (low-yeast) conditions, which can be fully rescued by overexpressing hodor in interstitial cells and Malpighian tubule principal cells (hodor-Gal4 driver), in migdut enterocytes (mex1-Gal4), but not in copper cells (labial (lab)-Gal4). c, The nutrient-dependent reduced viability of hodor mutants is rescued by hodor-Gal4-driven hodor re-expression. d, Hodor expression in copper (#) and iron cell (*) regions and Malpighian tubules (†) of a third-instar larval midgut. Expression in the large flat cell region flanked by the copper and iron cell regions was inconsistent. e, Hodor-expressing cell types: ItC – interstitial cells, IC – iron cells, CC – copper cells, PC – principal cells, SC – stellate cells. f, Hodor-positive interstitial cells are interspersed amongst copper cells (lab>mCD8-GFP-positive, Hodor-negative). g, Hodor is found on the apical (luminal, up) side of interstitial cells, flanked by lab>mCD8-GFP-expressing copper cells (outlined). h, Hodor in the anterior portion of the iron cell region (Fer1HCH-GFP-positive). i-k, Knockdown of hodor in principal cells (CtB-Gal4) (i), iron cells (Fer2LCH-Gal4) (j), or copper cells (lab-Gal4) (k) all fail to alter larval development. l, Post-embryonic hodor knockdown in interstitial and Malpighian tubule principal cells (by means of hodor-Gal4, tub-Ga80ts (hodorts in figure)-driven hodor RNAi) increases time to pupariation. See Supplementary information for sample sizes and full genotypes. One-way ANOVA with Tukey post-hoc tests were used for all graphs. Significance values: p< 0.05 *, p< 0.01 **, p< 0.001 ***. Box plots: line, median; box, 75th–25th percentiles; whiskers, minimum to maximum. Scale bars: d, 1mm; f, 40μm; g, 20μm; h, 100μm.
Fig. 2.
Fig. 2.. Intestinal Hodor/Tor signalling promotes food intake.
a, hodor mutants are more translucent than controls. b-c, Total triacylglycerides (TAG) normalised to weight in hodor (b) mutants and larvae overexpressing hodor (c). d, Lipid droplets within the fat body of hodor mutants and controls. e, Fat body lipid droplet (LD) size is reduced in hodor mutants. (L2 larvae were used in a-e). f, Reduced intestinal contents in L1 hodor mutants fed dye-laced food (45min). g-j, Food intake (g, h) or mouth hook contraction (i, j) quantifications for L1 hodor mutants (g, i) or L2 larvae overexpressing hodor in hodor-expressing cells (h,j). k-l, Ilp2 staining (quantification, k and representative images, l) of L2 brains of controls vs hodor mutants. m-n, Ectopic Ilp2 expression (hs-Ilp2) rescues the developmental delay of hodor mutants (m), but not their food intake (n). o, Reduced pAkt and pS6K in L2 hodor mutants compared to controls. p, The developmental delay of hodor knockdowns is exacerbated or rescued when the Tor pathway is simultaneously depleted (Tor-RNAi) or activated (S6KSTDETE), respectively, specifically in hodor-expressing cells. These manipulations did not affect the development of wild-type larvae (Extended Data Fig. 3j). q, The hodor mutant developmental delay is rescued by activation of the Tor pathway (S6KTE – weaker than S6KSTDETE – or UAS-Rheb) specifically in hodor-expressing cells. r, The reduced food intake of L2 hodor mutants is rescued by Tor pathway activation specifically in hodor-expressing cells (hodor>Rheb). See Supplementary information for sample sizes and full genotypes. Mann Whitney U tests or ordinary one-way ANOVA with Tukey post-hoc tests were used for two-group or more than two group comparisons, respectively. Significance values: p< 0.05 *, p< 0.01 **, p< 0.001 ***. Box plots: line, median; box, 75th–25th percentiles; whiskers, minimum to maximum. Scale bars: a, 500μm; b, 20μm; f, 100μm; k, 15μm.
Fig. 3.
Fig. 3.. Hodor is a zinc-gated chloride channel that controls dietary zinc preference and lysosomal functions.
a, Predicted pentameric complex; one monomer shown in blue. b, Left: only oocytes injected with Hodor respond to zinc. Middle graph: current-voltage (I-V) of zinc-activated currents. Right: zinc dose response (estimated EC50: 75.20μM, 95% confidence interval 58.63–94.65μM). c, Increased intracellular chloride (decreased 458nm/543nm ClopHensor ratio) in interstitial cells of L1 hodor mutants (20mM controls, 64mM in hodor mutants, calibration in Extended Data Fig. 6h). Representative 458nm images are shown. d, Zinc supplementation of a low-yeast diet increases food intake in controls, but not hodor mutants. e, Controls (but not hodor mutants) develop a preference (positive values) for a zinc-supplemented low-yeast diet, significant after 45h. ZnCl2 was used (ZnSO4 also elicited preference, not shown). f, Hodor is enriched on the apical (luminal) side of interstitial cells: on the brush border (arrow, phalloidin-positive) and intracellularly. g, h, A subpopulation of compartments positive for Lysotracker (g) and Lamp1-mCherry (h) co-express Hodor in interstitial cells (larvae were starved for 4h for improved lysosomal visualisation). i, A GFP-mCherry-Atg8a reporter reveals increased production of mCherry-positive autophagic punctae in interstitial cells; some are positive for GFP (normally quenched under acidic conditions). Single confocal slices for each channel are shown below. j, k, Knockdown of V-ATPase complex subunits from interstitial cells (hodor-Gal4) but not from other enterocytes (R2R4-Gal4) delays pupariation (j) and/or reduces food intake (k). See Supplementary information for sample sizes and full genotypes. Mann Whitney U tests or ordinary one-way ANOVA with Tukey post-hoc tests were used for two-group or more than two group comparisons, respectively. Significance values: p< 0.05 *, p< 0.01 **, p< 0.001 ***. Box plots: line, median; box, 75th–25th percentiles; whiskers, minimum to maximum. Some images were false-coloured for consistency. N: nucleus. Scale bars: e, 30μm; f, g and h, 10μm; i, j and k, 30μm: l, 50μm.

Comment in

References

    1. Miguel-Aliaga I Nerveless and gutsy: intestinal nutrient sensing from invertebrates to humans. Semin Cell Dev Biol 23, 614–620, doi:10.1016/j.semcdb.2012.01.002 (2012). - DOI - PMC - PubMed
    1. Feingold D, Starc T, O’Donnell MJ, Nilson L & Dent JA The orphan pentameric ligand-gated ion channel pHCl-2 is gated by pH and regulates fluid secretion in Drosophila Malpighian tubules. J Exp Biol 219, 2629–2638, doi:10.1242/jeb.141069 (2016). - DOI - PubMed
    1. Remnant EJ et al. Evolution, Expression, and Function of Nonneuronal Ligand-Gated Chloride Channels in Drosophila melanogaster. G3 (Bethesda) 6, 2003–2012, doi:10.1534/g3.116.029546 (2016). - DOI - PMC - PubMed
    1. Colombani J et al. A nutrient sensor mechanism controls Drosophila growth. Cell 114, 739–749 (2003). - PubMed
    1. Geminard C, Rulifson EJ & Leopold P Remote control of insulin secretion by fat cells in Drosophila. Cell Metab 10, 199–207, doi:10.1016/j.cmet.2009.08.002 (2009). - DOI - PubMed

Publication types

MeSH terms

LinkOut - more resources