. 2020 Apr;580(7802):288-293.
doi: 10.1038/s41586-020-2116-0. Epub 2020 Mar 18.

Ball-and-chain inactivation in a calcium-gated potassium channel

Affiliations

Ball-and-chain inactivation in a calcium-gated potassium channel

Chen Fan et al. Nature. 2020 Apr.

Abstract

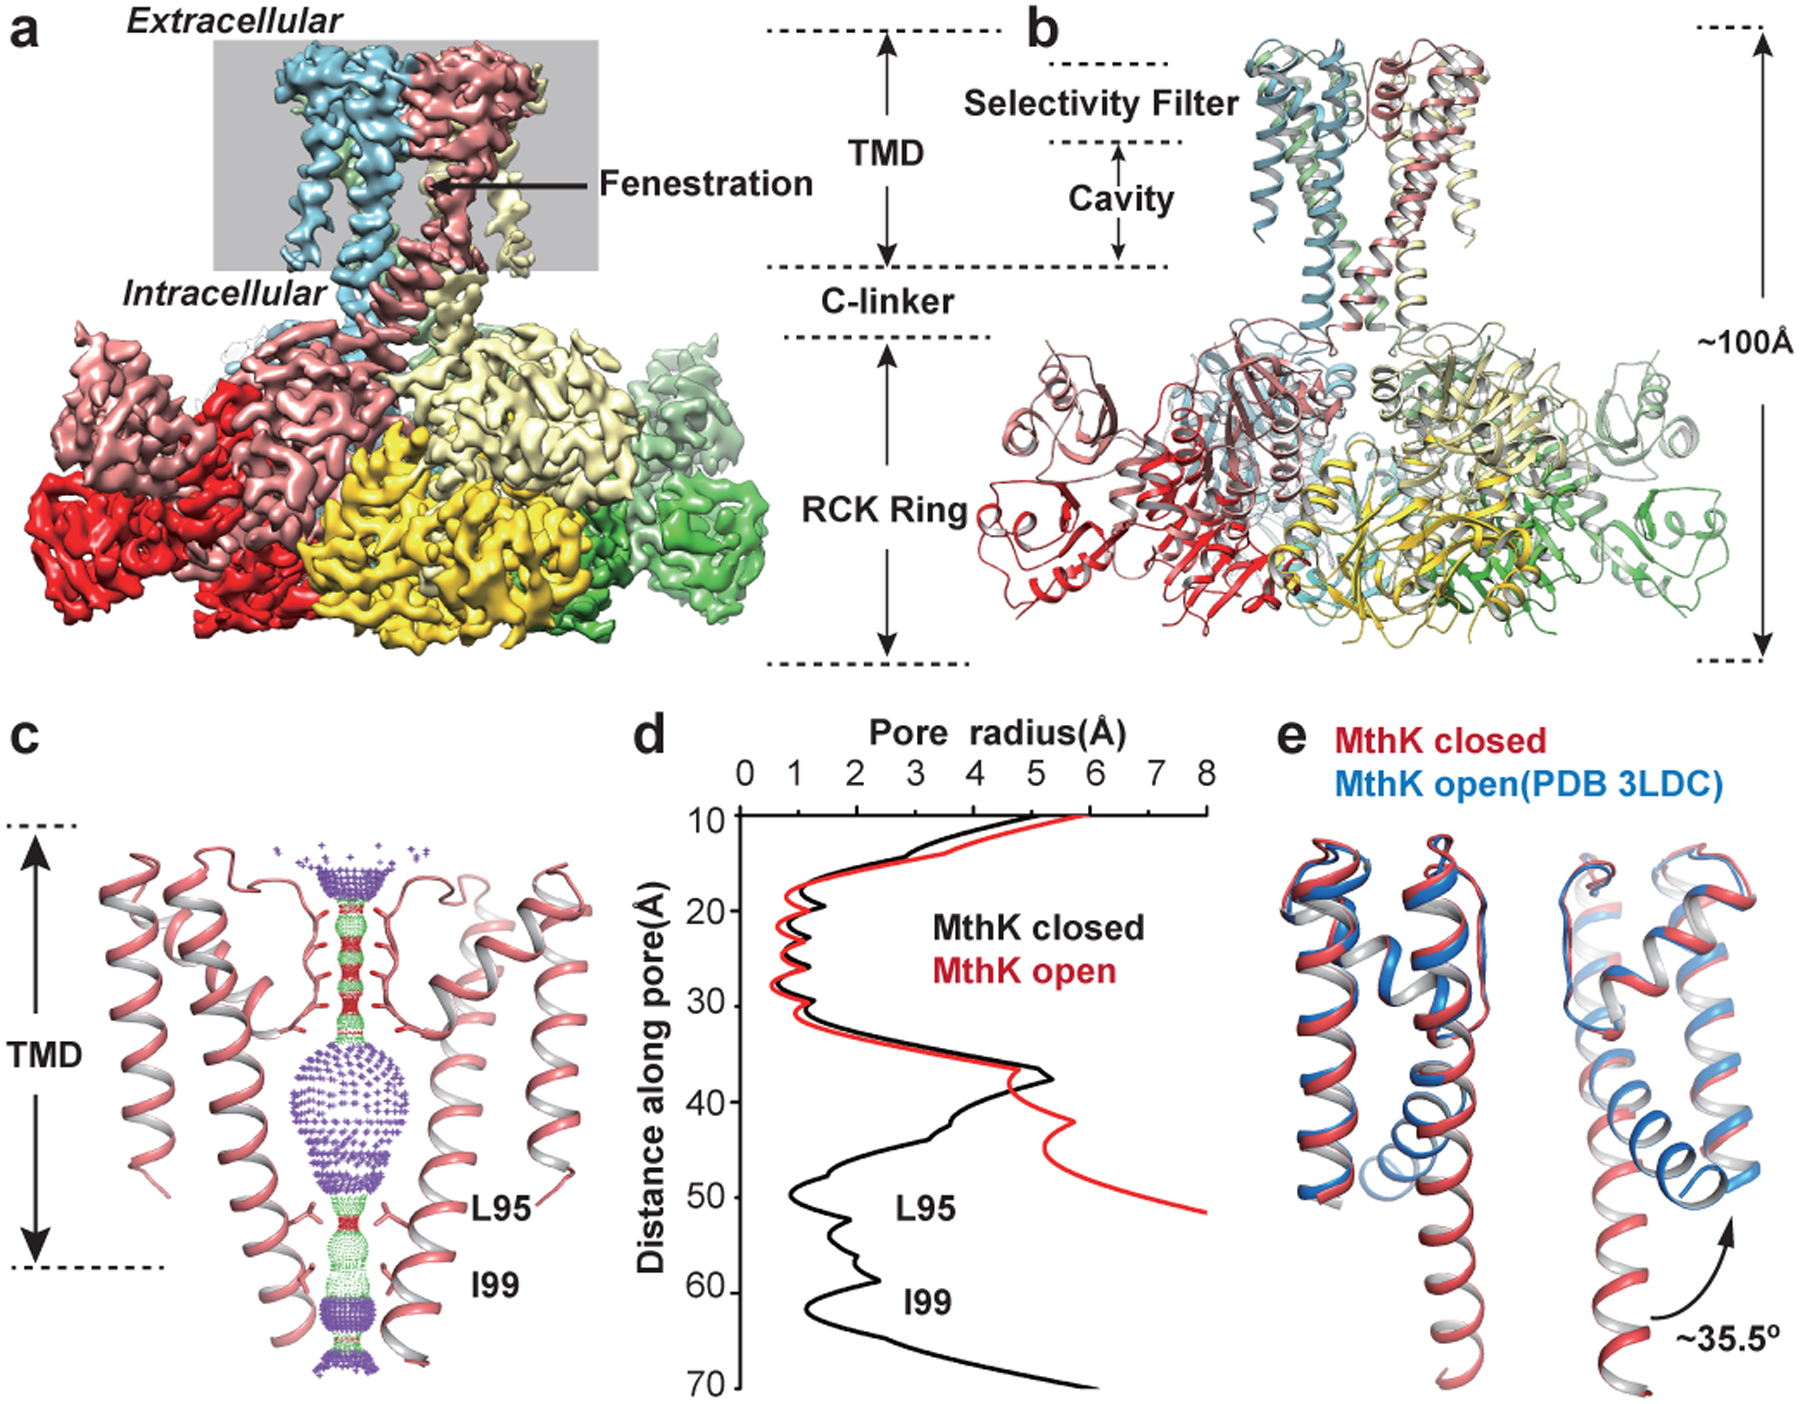
Inactivation is the process by which ion channels terminate ion flux through their pores while the opening stimulus is still present1. In neurons, inactivation of both sodium and potassium channels is crucial for the generation of action potentials and regulation of firing frequency1,2. A cytoplasmic domain of either the channel or an accessory subunit is thought to plug the open pore to inactivate the channel via a 'ball-and-chain' mechanism3-7. Here we use cryo-electron microscopy to identify the molecular gating mechanism in calcium-activated potassium channels by obtaining structures of the MthK channel from Methanobacterium thermoautotrophicum-a purely calcium-gated and inactivating channel-in a lipid environment. In the absence of Ca2+, we obtained a single structure in a closed state, which was shown by atomistic simulations to be highly flexible in lipid bilayers at ambient temperature, with large rocking motions of the gating ring and bending of pore-lining helices. In Ca2+-bound conditions, we obtained several structures, including multiple open-inactivated conformations, further indication of a highly dynamic protein. These different channel conformations are distinguished by rocking of the gating rings with respect to the transmembrane region, indicating symmetry breakage across the channel. Furthermore, in all conformations displaying open channel pores, the N terminus of one subunit of the channel tetramer sticks into the pore and plugs it, with free energy simulations showing that this is a strong interaction. Deletion of this N terminus leads to functionally non-inactivating channels and structures of open states without a pore plug, indicating that this previously unresolved N-terminal peptide is responsible for a ball-and-chain inactivation mechanism.


Conflict of interest statement

COMPETING INTERESTS

The authors declare no competing interests.

Figures

Extended Data Fig. 1
Extended Data Fig. 1. Sequence alignments.
a, Sequence alignment of MthK with human Slo1 and Aplysia californica (Ac) Slo1. Secondary structures of closed state MthK are labeled on top. b, Sequence alignment of MthK RCK domain with human Slo1 RCK1 and RCK2 domain. Blue regions indicate similarity and dark blue regions indicate identity. c, Sequence alignment shows inactivation N-terminal from MthK(accession number CEP 36137), Shaker B(accession number CAA 29917), Kv-β1.1(accession number CAA 50000), BK-β3a(accession number NP_741979), BK-β2a(accession number NP_001265840). d, Secondary structure prediction (PSIPRED server(see method)) indicates that the N-terminal 17 residues of MthK form a helix.
Extended Data Fig. 2 |
Extended Data Fig. 2 |. Single particle cryo-EM characterization of closed MthK in the absence of Ca2+.
a, Size exclusion chromatography (SEC) of MthK reconstituted in nanodiscs composed of 3:1 POPE:POPG lipids with MSP1E3. The main (highest amplitude) peak from SEC was separated using SDS-PAGE (inset), showing the components of MthK nanodiscs (indicated). b, Representative micrograph of the MthK-nanodisc sample in 0 Ca2+ and 5 mM EDTA (left). Selected 2D class averages (right). c, Final cryo-EM map of closed MthK colored by local resolution. d, Fourier shell correlation (FSC) curves between the two independently-refined half-maps after masking (black curve) and from cross validation between the atomic model, refined against half-map 1, against masked sum of both half-maps (red). e, Angular distribution of particles used in the reconstitution. f, Density of MthK EDTA closed state. Segmented cryo-EM density maps (grey mesh) of closed MthK in the absence of Ca2+. The fitted corresponding atomic model is in cyan.
Extended Data Fig. 3 |
Extended Data Fig. 3 |. Fenestrations and C-linker in closed MthK.
a-b, Surface representation of MthK closed (a) and open (pdb 3ldc) (b) state TM domains, colored by amino acid hydrophobicity. The membrane boundaries are indicated. No fenestration was observed in the open state. c-d, A tunnel drawn with HOLE, shows how fenestrations (drawn through only two opposing subunits) connect the lipid bilayer with the inside of the cavity (grey). e, The resolved C-linker domain and two extra helical turns of TM2 (blue) shown in one MthK subunit. f, Zoomed-in dashed square in e, showing direct interactions between residues in C-linker (blue) and the RCK N-lobe (green). The neighboring subunit is in beige. The residues that may contribute to C-linker stabilization via hydrophobic and electrostatic interactions are indicated.
Extended Data Fig. 4 |
Extended Data Fig. 4 |. Summary of RCK tilt, TM2 bend, conformational changes and lipid interactions from simulations.
a, Snapshot from one (out of the 10) representative simulation showing the maximum RCK tilt. Membrane deformations are indicated by the displacements of lipid phosphates (white spheres). Black dotted line highlights the bend of the front TM2 helix. b, Graphs showing variations in RCK tilt and TM2 bend shown for each of the 10 simulations where a positive/negative value represents tilting towards the subunit with TM2 located at the front/back. c, Detail showing the bend of TM2 helices. d, The mean time-lagged cross-correlation of RCK tilt and TM2 bend obtained from analysis of all 10 simulations shows how the correlation occurs instantaneously (zero lag) with a value of 0.25±0.05. Error bars are represented by ± 1 standard error of means based on n=10 independent simulations. e, Alignment on all four RCK domains. RCK dimers rotated upward (red arrows) within the gating-ring. f, Timeseries of RMSD of each subunit reveals slow relaxation over 300 ns, increasing due to the vertical rotations of the subunits as membrane interactions are formed, with asymmetric fluctuations seen during the simulation. g, RMSD time series of individual RCK dimers, revealing some maintained asymmetry. These changes occur due to changes in loops, although overall the structure is preserved, with lower RMSD values. All RMSD errors are between 0.01 and 0.04 Å, not shown. h, Channel structure at the end of a 500 ns simulation showing membrane interactions, indicating acidic and basic residues involved. i, Vertical movements of the C-lobe relative to the membrane (top panel) are well-correlated with tilting movements, and they lead to increased number of contacts between C-lobes and lipids (bottom panel), with similar results for N-lobes (not shown). j, There is little change in gate size at L95 (orange) and I99 (purple) during the simulation (top panel), however, the gate grows rapidly during the first several nanoseconds at Q103 (green). This growth is preceded by the upwards movement of K114 sidechain, positioned on the C-linker (bottom panel). This figure shows representative time series from 1 of the 10 independent simulations performed. See Supplementary Video 4.
Extended Data Fig. 5 |
Extended Data Fig. 5 |. Cryo-EM data processing workflow for the MthK Ca2+ dataset.
After refinement, the classes without clear TM density were discarded and marked by X. The classes were classified into 4 groups according to the tilting degree and colored according to the class name. Red for highly tilted classes, blue for medium tilted classes, green for mildly tilted classes and yellow for the closed state.
Extended Data Fig. 6 |
Extended Data Fig. 6 |. Overview of all the structures obtained from the MthK Ca2+ dataset.
a, The structures with clear TM density were kept, they were classified into 4 groups according to the tilt angle between the nanodisc (TMD) and RCK ring: highly tilted (red), medium tilted (blue), mildly tilted (green) and closed state (yellow). Finally, there are nine structures in total: three different structures in the highly tilted group (MthK Ca2+ states 1, 1.2, and 1.3), two different structures in the medium tilted group (MthK Ca2+ state 2, and 2.2), three different structures in the mildly tilted group (MthK Ca2+ state 3, 3.2, and 3.3), and one closed state. b, Cryo-EM data processing workflow for only the gating ring structures of the MthK Ca2+ dataset, excluding the closed state. Two different structures were identified by Relion 3D classification (named RCK state 1 and RCK state 2). c, Overlay of RCK states 1 and 2. Slight differences are observed between the 2 structures.
Extended Data Fig. 7 |
Extended Data Fig. 7 |. Single-particle cryo-EM characterization of MthK Ca2+-bound states.
a-d, MthK Ca2+ state 1 (highly-tilted) a, Final cryo-EM map colored by local resolution. b, FSC curve between two independently refined half-maps, after masking. c, Selected 2D class averages. d, Angular distribution of particles used in the reconstitution. e-h, MthK Ca2+ state 2 (medium-tilted) e,Final cryo-EM map colored by local resolution. f, FSC curve between two independently refined half-maps, after masking. g, Selected 2D class averages. h, Angular distribution of particles used in the reconstitution. i-l, MthK Ca2+ state 3 (mildly-tilted) i, Final cryo-EM map colored by local resolution. j, FSC curve between two independently refined half-maps, after masking. k, Selected 2D class averages. l, Angular distribution of particles used in the reconstitution. m-p, Ca2+-bound closed MthK. m, Final cryo-EM map colored by local resolution. n, FSC curve between two independently refined half-maps, after masking. o, Selected 2D class averages from particles. p, Angular distribution of particles used in the reconstitution.
Extended Data Fig.8 |
Extended Data Fig.8 |. Single particle cryo-EM characterization of the gating ring structures in the MthK Ca2+ dataset.
a, Final cryo-EM map of RCK state 1 colored by local resolution. b, FSC curves between the two independently-refined half-maps of MthK Ca2+ RCK state 1 (black), and from cross validation between the atomic model refined against the final cryo-EM map (red). c, Angular distribution of particles used in the reconstitution of RCK state 1. d, Final cryo-EM map of RCK state 2 colored by local resolution. e, FSC curves between the two independently-refined half-maps of MthK Ca2+ RCK state 2 (black), and from cross validation between the atomic model refined against the final cryo-EM map (red). f, Angular distribution of particles used in the reconstitution of RCK state 2. g, Segmented cryo-EM density maps (grey mesh) of RCK state2. The fitted corresponding atomic model is in cyan.
Extended Data Fig. 9 |
Extended Data Fig. 9 |. Functional characteristics of MthK.
a, Single-channel characteristics of MthK Δ2–17 are similar to WT. Top, representative single-channel recording traces from MthK Δ2–17 in horizontal lipid bilayers made of POPE:POPG (3:1) liposomes in decane at +100 mV without and with 5 mM Ca2+. Traces are filtered at 200 Hz for display. Single-channel current-voltage curves (bottom left) and Po as a function of voltage (bottom right) for MthKΔ2–17 (red symbols) compared to WT (dashed black lines). For MthK WT, the symbols are mean ± s.e.m. of five measurements for all membrane potentials except at −100, 75, and 100 mV, which contained six measurements. For MthK Δ2–17, the symbols are mean ± s.e.m. of five (−50 mV), six (−75, 50, 125 mV), seven (−125 mV), eight (−25, 75 mV), and nine (25, 100 mV) measurements. Each measurement is from a separate bilayer. b, Relative Tl+ flux rates as a function of incubation time of MthK WT (blue) and MthK Δ2–17 (red)-containing POPE:POPG (3:1) liposomes with 5 mM Ca2+. Symbols are the mean ± s.d. from three independent experiments. c, Fluorescence quench curves for MthK WT-containing DOPC:POPG (3:1) liposomes after 1 or 10 s (dark and light blue, respectively) incubation with 5 mM Ca2+. Control fluorescence is in the absence of Tl+ (black). A small leak of Tl+ into liposomes was observed in the absence of Ca2+ (light grey) and in the MthK-free liposomes (dark grey). 3 times of experiments were done with similar results. d, Fluorescence quench curves for MthK Δ2–17-containing DOPC:POPG (3:1) liposomes after 1 or 10 s (brown and pink, respectively) incubation with 5 mM Ca2+. The control was performed similarly as that for the experiment with the MthK WT liposomes. Experiments were performed 3 times with similar results. e-f, Simulation snapshots illustrating salt bridges between the basic residues on the N-terminus (blue) and the ring of glutamates at the intracellular pore entrance (e), and hydrophobic interactions between the N-terminus (blue) and hydrophobic residues lining the pore cavity (f). Only three subunits of the MthK TMD are shown for clarity. The residues in stick representation are colored the same as the individual subunits. The calibration bar indicates the position of the COM of the peptide parallel to the channel pore axis (see Methods). g, Convergence of the free energy profile from umbrella sampling simulations for the N-termini peptide plugging the MthK pore (Fig. 4f). Convergence to within 1 kcal/mol was achieved in 23 ns.
Extended Data Fig. 10 |
Extended Data Fig. 10 |. Single-particle cryo-EM characterization of MthK Δ2–17 in the presence of Ca2+.
a-c,Cryo-EM map colored by local resolution, FSC curve between two independently-refined half-maps and angular distribution of particles for state 1. d-f,Cryo-EM map colored by local resolution, FSC curve between two independently-refined half-maps and angular distribution of particles for state 2. g-i,Cryo-EM map colored by local resolution, FSC curve between two independently-refined half-maps and angular distribution of particles for state 3. j-l, Cryo-EM map colored by local resolution, FSC curve between two independently-refined half-maps and angular distribution of particles for RCK state 1. m-o, Cryo-EM map colored by local resolution, FSC curve between two independently-refined half-maps and angular distribution of particles for RCK state 2.
Extended Data Fig. 11 |
Extended Data Fig. 11 |. Gating ring assembly in the open MthK structures and pore densities.
Cryo-EM density map top (a) and side (c) views, and b, atomic model of the gating ring structure. Interfaces and Ca2+ binding sites are indicated. The UP RCK dimers are in red-blue and the DOWN RCK dimers are in green-yellow. d, Cartoon illustrating the RCK dimer packing within the gating ring of the MthK crystal structure (pdb 1lnq, left, 4-fold symmetry) and our MthK open state (right, 2-fold symmetry). Illustrations of the assembly interface 1 (e) and assembly interface 2 (f), where the MthK gating ring from the crystal structure is in beige (pdb 1lnq), and from the cryo-EM open structure in green, blue, yellow, and red. The structures are aligned by blue subunit in (e) and red subunit in (f). g, TM domains of MthK open state 2, and open state 3. Density maps (gray mesh) from only 2 subunits are shown with overlaid model in blue and yellow cartoon. The N-terminal plug is in dark blue. h, TM domains of MthK Δ2–17 state 2 and state 3. Colors as in g.
Extended Data Fig. 12 |
Extended Data Fig. 12 |. The Ca2+ binding sites in the Ca2+-bound closed MthK and RCK state 2 gating ring structures.
a, Overlay of Ca2+ bound closed MthK (red) and Ca2+-free closed MthK (EDTA structure, blue). The two structures are very similar. b, Ca2+ binding sites in the Ca2+-bound closed MthK. Site 1a and 1b are indicated. Density map of Ca2+ binding site 1a (c) and 1b (d). Ca2+ is in orange. The water near the Ca2+ is in red. e, Overview of RCK state 2 structure. Color scheme is the same as in Fig 5. The RCK dimer is indicated and shown in detail in (f). f, Overlay of the RCK dimer from RCK state 2 detailed in e with the crystal structure of the Ca2+-bound RCK dimer (PDB 4L73, beige). g, The RCK dimer from RCK state 2 with the 6 Ca2+ binding sites indicated. Density map of Ca2+ binding site 1a (h), 1b (i), 2a (j), 2b (k), 3a (l), 3b (m). Ca2+ is colored in orange. The water close to Ca2+ is colored red. Residues forming the binding sites (indicated) are rendered in pink and blue sticks as they originate from adjacent subunits.
Figure 1|
Figure 1|. MthK structure in the closed state in the absence of Ca2+.
a, Cryo-EM map of closed state MthK viewed parallel to the membrane. Each subunit is in a different color. b, Atomic model of closed MthK in the absence of Ca2+. Same orientation and colors as in (a). c, Selectivity filter and bundle crossing gate radii calculated with HOLE. Only two opposing subunits are shown. d, Pore radii as a function of the distance along the pore, plotted to scale with the pore position in panel c, calculated with HOLE. e, Comparison of the intracellular gate of MthK closed state (red) with open state (blue, PDB 3LDC). Open state TM2 is tilted by ~35.5 degrees compared with closed state.
Figure 2 |
Figure 2 |. Atomistic simulations of closed MthK.
a, Sample system with MthK embedded in a hydrated POPE:POPG (3:1) lipid bilayer. Gating ring tilts (blue dashed arrows; seen in all 10 simulations), RCK domain and C-linker interactions with membrane, inducing curvature (dashed line on inner bilayer), are indicated. TM2 bends (black dotted line). Inset shows five lipid tails (yellow) entering through fenestrations. b, Gating ring rocking appears correlated to the bend of TM2, illustrated here for RCK subunit A and C tilt against TM2 subunit A bend. c, Sample time series of gate size at positions L95, I99 and Q103 on TM2 during this simulation (early changes in Extended Data Fig.4j). 10 independent simulations were performed showing large variations and correlations in tilt and bend and gate size.
Figure 3 |
Figure 3 |. Multiple MthK structures in the presence of Ca2+.
a-d, Cryo-EM maps of MthK in 5 mM Ca2+. Each subunit is colored as in Fig. 1. The soluble RCK densities are shown in stronger shades. The nanodisc density is shown in white transparent. a-c are the open-inactivated states and d is the closed state. e-h, Corresponding atomic models. Colors are the same as in a-d.
Figure 4 |
Figure 4 |. MthK inactivates via N-terminus plugging the open state pore.
a, TM domains of MthK Ca2+ state 1. Density map (gray mesh) from 2 subunits with overlaid model in blue and yellow cartoon. N-terminal plug is in dark blue. b-c, Overlay between MthK crystal structure (PDB 3LDC, beige) and MthK Ca2+ open-inactivated state 1 with only subunits A and C (b) or only subunits B and D (c). Subunits are colored differently. d, TM domains of MthK Δ2–17 state 1. Colors as in (a). No density is observed inside the pore. e, Stopped-flow flux assays indicating MthK Δ2–17 no longer inactivates (red symbols). Blue symbols display flux rates in WT MthK (blue dash line is an exponential fit with τ=1.9±0.2 sec). LUVs composed of DOPC:POPG 3:1. Three independent experiments were performed for each construct. Symbols represent mean±s.d. (n=3). f, Free energy profile from atomistic umbrella sampling simulations of the N-terminus plugging the pore. The z axis indicates the position of the N-terminus inside the pore relative to the channel axis, calibrated as indicated in the inset and detailed in methods. Umbrella sampling trajectories were divided into n=4 blocks and error bars represented by ± 1 s.e.m. (Methods).
Figure 5 |
Figure 5 |. Scheme of Ca2+-gating and inactivation cycle in MthK.
a, MthK structures, and b, cartoons of closed, open, and open-inactivated conformations.

References

    1. Hille B Ion Channels of Excitable Membranes. 3rd edn, (Sinauer Associates, Inc., 2001).
    1. Yellen G The moving parts of voltage-gated ion channels. Q Rev Biophys 31, 239–295 (1998). - PubMed
    1. Hoshi T, Zagotta WN & Aldrich RW Biophysical and molecular mechanisms of Shaker potassium channel inactivation. Science (New York, N.Y.) 250, 533–538 (1990). - PubMed
    1. Armstrong CM, Bezanilla F & Rojas E Destruction of sodium conductance inactivation in squid axons perfused with pronase. J Gen Physiol 62, 375–391, doi: 10.1085/jgp.62.4.375 (1973). - DOI - PMC - PubMed
    1. Bezanilla F & Armstrong CM Inactivation of the sodium channel. I. Sodium current experiments. J Gen Physiol 70, 549–566, doi: 10.1085/jgp.70.5.549 (1977). - DOI - PMC - PubMed

Publication types

MeSH terms