. 2020 Apr;580(7802):245-251.
doi: 10.1038/s41586-020-2140-0. Epub 2020 Mar 25.

Integrating genomic features for non-invasive early lung cancer detection

Affiliations

Integrating genomic features for non-invasive early lung cancer detection

Jacob J Chabon et al. Nature. 2020 Apr.

Abstract

Radiologic screening of high-risk adults reduces lung-cancer-related mortality1,2; however, a small minority of eligible individuals undergo such screening in the United States3,4. The availability of blood-based tests could increase screening uptake. Here we introduce improvements to cancer personalized profiling by deep sequencing (CAPP-Seq)5, a method for the analysis of circulating tumour DNA (ctDNA), to better facilitate screening applications. We show that, although levels are very low in early-stage lung cancers, ctDNA is present prior to treatment in most patients and its presence is strongly prognostic. We also find that the majority of somatic mutations in the cell-free DNA (cfDNA) of patients with lung cancer and of risk-matched controls reflect clonal haematopoiesis and are non-recurrent. Compared with tumour-derived mutations, clonal haematopoiesis mutations occur on longer cfDNA fragments and lack mutational signatures that are associated with tobacco smoking. Integrating these findings with other molecular features, we develop and prospectively validate a machine-learning method termed 'lung cancer likelihood in plasma' (Lung-CLiP), which can robustly discriminate early-stage lung cancer patients from risk-matched controls. This approach achieves performance similar to that of tumour-informed ctDNA detection and enables tuning of assay specificity in order to facilitate distinct clinical applications. Our findings establish the potential of cfDNA for lung cancer screening and highlight the importance of risk-matching cases and controls in cfDNA-based screening studies.


Figures
Extended Data Figure 1.
Extended Data Figure 1.. Development and experimental validation of an in silico simulation of the CAPP-Seq molecular biology workflow.
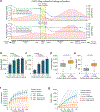
(a) The fraction of original unique (blue line) and duplex (green line) cfDNA molecules (‘Unique depth’, right axis) and total molecules including PCR duplicates (‘Nondeduped depth’, left axis) at each step in the CAPP-Seq molecular biology workflow were tracked using an in silico model based on random binomial sampling. In this model, only on-target molecules are considered, with both individual DNA strands from original DNA duplexes tracked. Two simulations are shown, with 8.3% (top) and 100% (bottom) of amplified sequencing library input into the hybridization reaction for target enrichment. Additional details on the model are provided in the Supplementary Methods. (b-c) Empirical validation of simulation models. Comparison of median unique (b) de-duplicated (i.e. “deduped”) and (c) duplex depths recovered by sequencing following input of different fractions of sequencing library into the hybrid capture reaction. A total of 32 ng of cfDNA from each of 4 healthy adults was used as input in each condition and each sample was downsampled to 100 million sequencing reads prior to barcode-deduplication to facilitate comparison. Comparisons were performed with a paired two-sided t-test. (d-e) Comparison of (d) deduped and (e) duplex sequencing depths achieved following input of 8.3% (n=138 cfDNA samples) compared to ≥ 25% (n=145 cfDNA samples) of each sequencing library into the hybrid capture reaction. All samples had 32 ng of cfDNA as input to library preparation and were downsampled to 25 million reads prior to barcode-deduplication to facilitate comparison. In box plots the center line denotes the median, the box contains the interquartile range, and the whiskers denote the extrema that are no more than 1.5 × IQR from the edge of the box (Tukey style). (f-g) Comparison of deduped (f) and duplex (g) sequencing depths predicted by the model to that observed experimentally when 8.3% vs. 100% of a sequencing library is input into the hybrid capture reaction. A range of capture efficiencies (7.5 – 75% hybrid capture efficiency) were considered in the simulation, where the confidence envelope denotes the resultant range of model predictions. The experimental data depicted in panels b-c (n=4 cfDNA samples per capture condition) was downsampled prior to barcode deduplication to enable comparisons across different sequencing read yields (x-axis). Dots denote the median and error bars denote the minimum and maximum.
Extended Data Figure 2.
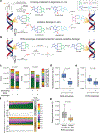
Extended Data Figure 2.. The ROS scavenger hypotaurine reduces oxidative damage arising in vitro.
(a) Diagram illustrating the chemical mechanism by which carcinogens in cigarette smoke in vivo (top) or reactive oxygen species (ROS) in vitro (bottom) cause damage to DNA leading to the generation of 8-oxoguanine, which subsequently results in the generation of G>T transversions. (b) Diagram illustrating the proposed mechanism by which the addition of a ROS scavenger reduces oxidative damage-derived G>T artifacts in vitro. (c) Comparison of base substitution distributions in healthy control cfDNA samples (n=12 individuals) captured with and without the ROS scavenger hypotaurine present in the hybrid capture reaction. The number of errors that are G>T transversions was compared using a paired two-sided t-test (P < 1×10⁻⁸). (d-e) Aggregate selector-wide nondeduped (d) and deduped (e) background error rates summarizing results in panel c. Grouped comparisons were performed with a paired two-sided t-test. (f) Comparison of selector-wide error rates and base substitution distributions across two cohorts of healthy controls, where cfDNA samples were profiled with (“present,” bottom, n=104) or without (“absent,” top, n=69) the ROS scavenger hypotaurine present in the hybrid capture reaction. (g) Aggregate selector-wide error rates summarizing results from panel f. In box plots the center line denotes the median, the box contains the interquartile range, and the whiskers denote the extrema that are no more than 1.5 × IQR from the edge of the box (Tukey style).
Extended Data Figure 3.
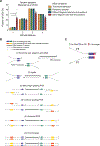
Extended Data Figure 3.. Rationale for and overview of dual-index duplex adapters with error-correcting barcodes (i.e. FLEX adapters).
(a) An excess of molecular barcodes (i.e. unique identifier or “UIDs”) differing by 1 bp in cfDNA molecules with the same the start and end positions indicates that sequencing errors in UIDs can create erroneous UID families. Depicted is the expected and observed distribution of barcode Hamming edit distances (“UID edit distance”) when comparing UIDs from different groups of barcode-deduped (i.e. unique) cfDNA molecules sequenced using our previously described tandem adapters. Tandem adapters utilize random 4-mer UIDs, resulting in 256 distinct UIDs that cannot be error corrected. The theoretical distribution of UID edit distances across all 256 UIDs is shown in orange (i.e. the fraction of UIDs that differ from one another by 1, 2, 3, and 4 bp). The green, red and blue bars represent the distribution of UID edit distances observed in healthy control cfDNA samples sequenced with tandem adapters (n=24 individuals). Green indicates randomly sampled UIDs, blue indicates UIDs from cfDNA molecules with different genomic start/end positions, and red indicates cfDNA molecules sharing the same start/end positions. UIDs differing by only one base are significantly overrepresented when comparing cfDNA molecules with the same start/end position (red bars) to each of the other UID distributions, suggesting that 1 bp errors are erroneously creating new UID families. Group comparisons were performed with a paired two-sided t-test, except when comparing to the theoretical distribution, for which an un-paired two-sided t-test was used (P < 1×10⁻⁸). Bars denote the mean and error bars denote the standard error. (b) Schematic overview of custom FLexible Error-correcting dupleX (‘FLEX’) sequencing adapters, enabling independent tailoring of UID diversity and multiplexing capacity. Shown is an initial DNA molecule to which ‘partial Y adapters’ containing duplex UIDs are ligated (1–2). Next, the two molecules derived after one round of ‘grafting PCR’ (which adds the first of two sample barcodes) are shown (3). This is followed by additional rounds of grafting PCR which add the second sample barcode and continues to amplify the library (4). Following grafting PCR, a magnetic bead cleanup is performed (not shown) which is followed by universal PCR (5), after which final sequencing libraries compatible with Illumina sequencers are shown (6). Dual index sample barcodes types are indicated in yellow (‘index 1’ or ‘i7’) and orange (‘index 2’ or ‘i5’) and UIDs are indicated by purple/green blocks. (c) Diagram depicting a detailed view of the ‘partial Y adapters’ used for initial ligation to cfDNA. The adapters contain a ‘1 bp offset’ indicated in green, followed by a 6 bp error correcting UID indicated in purple (Hamming edit distances ≥ 3), followed by 0–3 ‘stagger’ bases indicated in red, followed by a 3’ ‘T-overhang’ for ligation. The 0–3 bp stagger bases increase sequence complexity early in the sequencing reads to obviate the need for PhiX (used for spectral diversity). Additional details on the FLEX adapters are provided in the Supplementary Methods.
Extended Data Figure 4.
Extended Data Figure 4.. Study and cohort overview.
(a) Study Overview. (b) Clinical and demographic information pertaining to the NSCLC patient and non-cancer control cohorts considered in this study. For categorical variable, the count is provided with the percent of the cohort in parentheses. For continuous variables, the median value is provided with the range of values in parentheses. NOS = not otherwise specified, a = AJCC v7 staging, b = Low-risk controls were considered for feature discovery and CH analysis only and were not used for Lung-CLiP model training, c = Sex was compared with a two-sided Fisher’s Exact Test and continuous variables (age and pack-years) were compared with an un-paired two-sided t-test, d = Lung CLiP NSCLC patients and risk-matched controls were compared.
Extended Data Figure 5.
Extended Data Figure 5.. Biological determinants of tumor-informed ctDNA detection.
(a) Association between tumor-informed ctDNA detection and the number of mutations tracked using the population-based lung cancer-focused CAPP-Seq panel. All patients were considered and binned by the number of mutations identified in matched tumor biopsy samples. (b) Association between the number of mutations identified in matched tumor samples and tumor-informed ctDNA detection using the population-based lung cancer-focused CAPP-Seq panel. (c) ctDNA detection statistics in 17 early-stage NSCLC patients profiled both with the population-based lung cancer-focused CAPP-Seq panel (left), and customized capture panels designed using tumor exome sequencing data (right). While all 17 patients were undetectable using the population-based method, 10 (59%) were detected using customized panels. For samples without detectable ctDNA (open circles), the corresponding patient-specific analytical limit of detection (LOD) is shown. For patients with detectable ctDNA, the mean variant allele frequency (VAF) observed across all tracked mutations is depicted (blue circles). (d) Comparison of the patient-specific analytical limit of detection (LOD) in patients with and without detectable ctDNA using tumor-informed CAPP-Seq. LOD was determined based on the binomial distribution, number of mutations tracked, and the number of cfDNA molecules sequenced (e.g. unique depth). The LOD from patients sequenced with the population-based lung cancer-focused CAPP-Seq panel only (n=68) and patients sequenced with customized capture panels designed using tumor exome sequencing data (n=17 patients) are displayed. (e) Detection of clonal and subclonal SNVs in cfDNA. The fraction of all clonal and subclonal SNVs detected in plasma are depicted in pie charts (two-sided Fisher’s Exact Test, P = 0.039) and the VAFs of clonal and subclonal SNVs detectable in plasma are compared using violin plots in which horizontal dashed lines depict the median and interquartile range. All mutations identified using the population-based lung cancer-focused CAPP-Seq panel are considered. (f) The fraction of all mutant and wild-type cfDNA molecules (defined as in Fig. 1d) with fragment sizes falling within the size windows found to be ctDNA-enriched in Fig. 1e. (g) Violin plot displaying the enrichment of SNV VAFs following in silico size selection for the cfDNA fragment sizes found to be ctDNA-enriched in Fig. 1e. Enrichment is defined as the ratio of the SNV VAF following size selection to that observed prior to size selection. All mutations detectable in plasma prior to size selection (n=323 mutations) were considered. In the boxplot the center line denotes the median, the box contains the interquartile range, and the whiskers denote the extrema that are no more than 1.5 × IQR from the edge of the box (Tukey style). (h) Comparison of SNV VAFs before and after size selection. The dot plot displays the VAF of SNVs in plasma before and after size selection. The bar plot depicts the fraction of SNVs for which the VAF increased, decreased, or became un-detectable following size selection. All mutations detectable in plasma prior to size selection were considered. (i) Comparison of SNV VAFs prior to size selection in SNVs for which the VAF increased, decreased, or became un-detectable following size selection. (j) Tumor-informed ctDNA detection rates before and after size selection in patients sequenced with the population-based lung cancer-focused CAPP-Seq panel (n=85 patients) and customized capture panels designed using tumor exome sequencing data (n=17 patients).
Extended Data Figure 6.
Extended Data Figure 6.. Clinical correlates of tumor-informed ctDNA detection.
(a) Relationship between metabolic tumor volume (MTV) measured by PET-CT and pretreatment ctDNA concentration measured in haploid genome equivalents per mL plasma (hGE/mL). All patients with detectable ctDNA and MTV measurements available were considered (n=46). Comparison performed by Spearman correlation. (b) Comparison of MTV in patients with and without detectable ctDNA. All patients with MTV measurements (n=81) were considered. (c) Multivariable linear regression was performed to associate the predictor variables (MTV, histology, and stage) with mean ctDNA VAF. For patients without detectable ctDNA, a VAF of 0.001% was used. All patients with MTV measurements (n=81) were considered. Additional details are provided in the Methods. (d) Comparison of pretreatment ctDNA levels in patients with adenocarcinoma histology and varying amounts of ground glass opacity (GGO) on pre-treatment CT scans. Brackets above depict comparison by Fisher’s Exact Test for ctDNA detection in patients with < 25% GGO (24/48 patients with ctDNA detected) vs. those with ≥ 25% GGO (2/13 patients with ctDNA detected). ND = not detected. All patients with adenocarcinoma histology and pre-treatment CT scans available were considered (n=61). (e) ctDNA detection rates in all patients (n=82, blue bars) and only those with adenocarcinoma histology (n=61, grey bars) with tumors that do or do not have evidence of necrosis on pre-treatment CT scans. Detection rates were compared by Fisher’s Exact Test. All patients with pre-treatment CT scans available were considered (n=82).
Extended Data Figure 7.
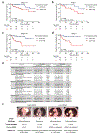
Extended Data Figure 7.. Pretreatment ctDNA burden is prognostic in early-stage NSCLC.
(a-d) Kaplan–Meier analysis for recurrence-free survival (a,b) and freedom from metastasis (c,d) stratified by pretreatment ctDNA level in all stage I-III patients (a,c, n=85) and stage I patients only (b,d, n=48). The median ctDNA level across the cohort (0.0031%) was used to stratify patients into ctDNA high and ctDNA low groups. P-values were calculated using the log-rank test. HR = hazard ratio. (e) Table summarizing the results of univariable and multivariable Cox proportional hazards models. Metabolic tumor volume (MTV) measured by PET-CT and ctDNA measurements (mean SNV VAF) were log transformed. Significant P-values (< 0.05) are bolded. For univariable analysis of ctDNA level and stage, all patients (n=85) were considered. For the univariable analysis of MTV, and for all multivariable analysis, only patients with MTV measurements available (n=81) were considered. Univariable and multivariable P-values were assessed using the log-likelihood test. (f) Example patients with stage I adenocarcinoma. On the left are two patients with high pretreatment ctDNA levels who developed distant metastases following surgery. On the right are two patients with undetectable ctDNA who achieved long term remissions following surgery.
Extended Data Figure 8.
Extended Data Figure 8.. Biological features of cfDNA mutations reflecting clonal hematopoiesis.
(a) Flow chart depicting the fraction of WBC+ and WBC- cfDNA mutations affecting canonical CH genes in NSCLC patients and controls. WBC+ cfDNA mutations present at ≥ 1% VAF in matched leukocytes more frequently affect canonical CH genes than those below 1% (51/64 vs. 223/460 WBC+ cfDNA mutations present at ≥ 1% vs. < 1% VAF in matched leukocytes affect canonical CH genes, respectively; P = 1.9×10⁻⁶ Fisher’s Exact Test). Only mutations identified de novo in the cfDNA for which presence in the matched WBCs could be confidently assessed are considered (Methods). (b) The percent of mutations genotyped de novo from WBC DNA at VAFs < 2% and ≥ 2% affecting canonical CH genes in patients and controls (all patients and controls are considered. Comparison was performed by Fisher’s Exact Test. (c) The percent of controls (left) and patients (right) with one or more mutations in the 10 genes that most frequently contained WBC+ cfDNA mutations. NSCLC patients and controls with only WBC+ mutations, only WBC- mutations, or both WBC+ and WBC- mutations in a gene are depicted in red, grey, and pink, respectively. The numbers next to each bar represent the percent of all cfDNA mutations in that gene that are WBC+ in NSCLC patients (right) or controls (left). NSCLC patients had significantly more WBC- cfDNA mutations in TP53 than controls (19/32 vs. 0/4 in patients vs. controls, respectively. * = Fisher’s Exact Test, P = 0.04). (d) Mutation frequency by gene for WBC+ cfDNA mutations observed across all NSCLC patients (n=104) and controls (n=98). The y-axis depicts the percent of the combined cohort with WBC+ cfDNA mutations affecting a given gene. All genes with mutations in 4 or more individuals in the combined cohort are depicted. (e) Scatterplot comparing the VAFs of WBC+ cfDNA mutations across multiple timepoints in NSCLC patients (left panel, n=54 mutations, n=8 individuals) and controls (right panel, n=12 mutations, n=6 individuals). Statistical comparison was performed by Pearson correlation on mutations detected at both time points. (f) Positive selection analysis was carried out on all synonymous and nonsynonymous WBC+ (n=693 mutations, red) and WBC- (n=526 mutations, grey) cfDNA mutations observed in NSCLC patients and controls using the dNdScv R package with a modification to account for the fraction of a given gene covered by our sequencing panel. The x-axis indicates the dNdScv adjusted P-value (Q-value) for all substitution types. Genes were considered under positive selection if the Q-value was < 0.05. All genes meeting this threshold are displayed. Additional details are provided in the Methods. (g) distribution of WBC+ and WBC- cfDNA mutations across the p53 protein in NSCLC patients and controls. (h) Short fragment enrichment of WBC+ and WBC- cfDNA mutations in NSCLC patients and controls, defined as the fold change in VAF for a given mutation following in silico size selection for the cfDNA fragment sizes found to be ctDNA-enriched in Fig. 1e. The center line denotes the median, the box contains the interquartile range, and the whiskers denote the 10th and 90th percentile values.
Extended Data Figure 9.
Extended Data Figure 9.. Feature importance and performance of Lung-CLiP.
(a) Biological and technical parameters specific to each individual variant used as features in a dedicated logistic regression ‘SNV model’. The feature names are depicted on the y-axis and the negative log10 of the P-value derived from comparing all post-filtered SNVs in NSCLC patients (n=574 mutations from n=104 individuals) vs. those in risk-matched controls (n=64 mutations from n=56 individuals) in a univariable linear model in the training set is shown on the x-axis. All features with a P-value < 0.01 are shown, P-values were calculated using an un-paired two-sided t-test. Additional information about each feature is provided in the Supplemental Methods. (b) Receiver operator characteristic (ROC) curves for the Lung-CLiP model depicting performance stratified by tumor stage in the training set (n=104 NSCLC patients and n=56 risk-matched controls). (c) Spectrum of clinicopathologic correlates and selected features observed across the 46 early-stage NSCLC patients and 48 risk-matched controls undergoing annual lung cancer screening in a prospectively enrolled independent validation cohort. (d) ROC curves for the Lung-CLiP model depicting performance stratified by tumor stage in the validation set (n=46 NSCLC patients and n=48 risk-matched controls). (e) Comparison of the specificity observed in the validation cohort at different thresholds defined in the training cohort. Dots denote the median specificity across 1,000 bootstrap re-samplings and error bars depict the interquartile range. Statistical comparison was performed by Pearson correlation on the non-bootstrapped data. (f-i) Comparison of (f) metabolic tumor volume, (g) cfDNA input to library preparation, (h) plasma volume used, and (i) unique sequencing depth in NSCLC patients correctly classified at 98% specificity (“Positive”) to those in patients incorrectly classified (“Negative”). All NSCLC patients in the training and validation cohorts were considered (n=103 patients with metabolic tumor volume measurements in f and n=150 patients in g-i and). In box plots the center line denotes the median, the box contains the interquartile range, and the whiskers denote the extrema that are no more than 1.5 × IQR from the edge of the box (Tukey style).
Extended Data Figure 10.
Extended Data Figure 10.. Technical reproducibility and benchmarking of CAPP-Seq and the Lung-CLiP model.
(a-j) Blood was drawn from each of three healthy donors into two STRECK tubes and two K2EDTA tubes and processed using the protocols used in our study. cfDNA extraction and library preparation were performed as described in the Methods with 25 ng of cfDNA input for each sample. Sequencing and data processing were performed as described in the Methods and each sample was downsampled to 80 million reads prior to barcode-deduplication to facilitate comparison. (a) The Lung-CLiP model was trained on the 104 NSCLC patients and 56 risk-matched controls in the training cohort and applied to the cfDNA samples extracted from plasma drawn into STRECK and K2EDTA tubes. The fraction of donors classified as negative by Lung-CLiP at the 98% (blue bars) and 80% (red bars) specificity thresholds defined in the training data are depicted. (b-h) Comparison of (b) median cfDNA fragment size, (c) cfDNA concentration in ng/ml, (d) deduped depth, (e) duplex depth, and (f-h) error metrics in cfDNA samples extracted from plasma drawn into the two tube types. cfDNA samples from the same donor are connected with dashed lines, comparisons were performed using a paired two-sided t-test. (i) Comparison of the fragment size distribution of cfDNA samples extracted into the two tube types. (j) Genotyping was performed as described in the Methods on cfDNA samples extracted from plasma drawn into the two tube types from the three donors. Donor #1 and donor #3 each had one mutation identified in cfDNA which was present in samples extracted from plasma drawn into both tube types and was also present in matched WBCs (WBC+). Donor #2 had no mutations identified in cfDNA samples extracted from plasma drawn into either tube type. (k) Orthogonal validation of WBC+ cfDNA mutations (n=15) using droplet digital PCR (ddPCR). Comparison of the VAF of WBC+ cfDNA mutations as measured by CAPP-Seq (x-axis) and ddPCR (y-axis). ddPCR was performed in triplicate on cfDNA (left) or WBC DNA (right) sequencing libraries. All 15 mutations (100%) were validated by ddPCR in both the cfDNA and WBC compartments. Triangles represent recurrent “hotspot” mutations in canonical CH genes and squares represent private mutations in non-CH genes. Statistical comparison was performed by Pearson correlation. (l-n) Tumor-informed ctDNA levels in NSCLC patients with and without adjustments for copy number state and clonality of tumor mutations. (l) VAFs of individual mutations (n=323) observed in cfDNA with different SNV VAF adjustment strategies. Comparisons were performed using a paired two-sided t-test. (m) The mean cfDNA VAF across all tracked mutations tracked in patients with detectable ctDNA (n=48) with the different adjustment strategies. Comparisons were performed using a paired two-sided t-test. (n) The same data as in m separated by stage. In box plots the center line denotes the median, the box contains the interquartile range, and the whiskers denote the extrema that are no more than 1.5 × IQR from the edge of the box (Tukey style). In l-n, copy number and clonality adjustment was performed as described in the Supplementary Methods.
Figure 1.
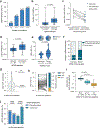
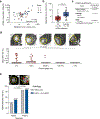
Figure 1.. Biological and clinical correlates of ctDNA burden in early-stage lung cancer patients.
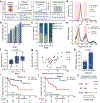
(a) Summary of key methodical improvements to the CAPP-Seq workflow. (b) Tumor-informed ctDNA detection rates across all patients (grey bars, n=85) and the subset of patients with an analytical limit of detection (LOD) < 0.01% (blue bars, n=43). (c) Pretreatment ctDNA levels, quantified as the mean variant allele frequency (VAF) across all mutations tracked, summarized by stage in NSCLC patients with detectable ctDNA or a LOD < 0.01%. (d) Fragment size distribution of cfDNA molecules containing mutations present in matched tumor samples (red line) and wild-type molecules overlapping the same genomic positions in the same patients (black line). Size distributions were compared by the Kolmogorov-Smirnov test. Fragment size regions enriched for ctDNA are shaded in red. (e) The relative enrichment of mutant vs. wild-type cfDNA molecules (i.e. “ctDNA enrichment”) calculated from the data depicted in panel d. Fragment size regions enriched for ctDNA are shaded in red. (f) Pretreatment ctDNA levels summarized by stage in patients with detectable ctDNA. Brackets depict comparison of stage I (n=20) vs. stage II-III (n=28) patients. (g) Relationship between metabolic tumor volume (MTV) and pretreatment ctDNA level. All patients with detectable ctDNA and MTV measurements available were considered (n=46). Comparison performed by Spearman correlation. (h) ctDNA detection rates in patients with adenocarcinoma and non-adenocarcinoma histology. Comparison performed by Fisher’s Exact Test. (i-j) Kaplan–Meier analysis for freedom from recurrence stratified by pretreatment ctDNA level in (i) all stage I-III patients (n=85) and (j) stage I patients only (n=48). The median ctDNA level across the cohort (0.0031%) was used to stratify patients into ctDNA low and ctDNA high groups. HR=hazard ratio. (k) Results of multivariable Cox proportional hazards model for freedom from recurrence in patients with MTV measurements available (n=81). Points denote the hazard ratio and error bars depict the 95% CI.
Figure 2.
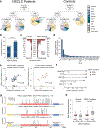
Figure 2.. Clonal hematopoiesis (CH) is a major source of cfDNA variants and molecular features distinguish CH-derived from tumor-derived cfDNA variants.
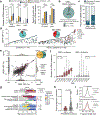
(a) Left: Count of total, WBC+, and WBC- nonsynonymous cfDNA mutations in NSCLC patients, risk-matched controls, and low-risk controls. (*, P < 0.01; **, P < 0.001; ***, P < 0.0001). Right: Percent of each cohort with one or more WBC+ cfDNA mutations in a canonical CH gene or in any gene. Comparisons performed using Fisher’s Exact Test (***, P < 1×10⁻⁵). (b) Percent of WBC+ cfDNA mutations that were private vs. those observed in two or more individuals. All NSCLC patients and controls were considered (n=202). (c) Percent of WBC- and WBC+ cfDNA mutations affecting canonical CH genes vs. other genes in controls. Comparison performed using Fisher’s Exact Test between WBC+ (n=200) and WBC- (n=22) cfDNA mutations. All controls were considered (n=98). (d) Variant allele frequencies (VAFs) of cfDNA mutations observed in controls (left), and NSCLC patients (right). The color denotes whether a cfDNA mutation was WBC- (red) or WBC+ (blue) and the shape denotes the type of gene. Individuals with one or more cfDNA mutations are shown. Pie charts display counts of WBC- and WBC+ cfDNA mutations pooled by cohort. (e) Scatterplot depicting the VAFs of mutations in cfDNA and matched WBCs. The color denotes the type of gene and the shape denotes whether the mutation was observed in a NSCLC patient or control. All mutations genotyped de novo in the cfDNA or WBCs for which presence in the other compartment could be confidently assessed are shown. Marginal histograms display the VAF distribution of all mutations in cfDNA or WBCs. Comparison performed by Pearson correlation on mutations detected in both compartments (n=575). (f) Association between age and number of WBC+ or WBC- cfDNA mutations. All patients (n=104) and controls (n=98) were considered. Comparison performed by Pearson correlation on the un-binned data. (g) Mutational signature contributions in WBC+ and WBC- cfDNA mutations in NSCLC patients and controls compared to the CH and lung cancer literature. Statistical significance was assessed for differences in signature 4 (smoking) as described in the Methods (*, P = 0.005; **, P < 1×10⁻⁸). (h) Smoking signature contribution in WBC+ (n=13) vs. WBC- (n=19) TP53 mutations in NSCLC patients. (i) Fragment size distributions of cfDNA molecules containing mutations present in matched WBC DNA (“CH mutations,” top) or matched tumor samples (“tumor-adjudicated,” bottom) compared to wild-type cfDNA molecules overlapping the same genomic positions in the same patients. Size distributions compared using the Kolmogorov-Smirnov test.
Figure 3.
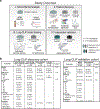
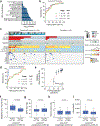
Figure 3.. Development of the Lung Cancer Likelihood in Plasma (Lung-CLiP) method.
(a) Schematic of the Lung-CLiP classification framework. (b-c) Sensitivity of detection by stage at (b) 98% and (c) 80% specificity as determined in a leave-one-out cross validation in the training cohort. Bars denote the median sensitivity across 1,000 bootstrap re-samplings and error bars depict the interquartile range. (d) Clinicopathologic correlates and selected molecular features observed in the NSCLC patients and risk-matched controls undergoing annual lung cancer screening in the training cohort. (e) Sensitivity of ctDNA detection summarized by stage using tumor-informed CAPP-Seq and Lung-CLiP in patients with matched tumor tissue (n=67). Detection thresholds achieving ≥ 98% specificity were used for both approaches. Data is depicted as in panels b-c. Sensitivity comparisons performed by Fisher’s Exact Test on the non-bootstrapped data. (f) Relationship between ctDNA level and Lung-CLiP score in patients with detectable ctDNA by tumor-informed CAPP-Seq (n=39). The x-axis depicts the mean variant allele frequency (VAF) across all mutations tracked by tumor-informed CAPP-Seq and the y-axis depicts the log odds of the Lung-CLiP score. Comparison performed by Spearman correlation. (g) Metabolic tumor volume in NSCLC patients correctly classified at 98% specificity (“Positive,” n=40) and those incorrectly classified (“Negative,” n=40). (h) Sensitivity of detection by Lung-CLiP at 98% specificity in patients with adenocarcinoma vs. non-adenocarcinoma histology. Comparison performed by Fisher’s Exact Test.
Figure 4.
Figure 4.. Validation of Lung-CLiP in a prospectively collected independent cohort.
(a-c) Comparison of (a) AUC and sensitivity at (b) 98% and (c) 80% specificity stratified by stage in the training (blue) and validation (red) cohorts. Bars denote the median value observed across 1,000 bootstrap re-samplings and error bars depict the interquartile range. AUC comparisons were performed using Delong’s method and sensitivity comparisons were performed using Fisher’s Exact Test on the non-bootstrapped data. The 98% and 80% specificity thresholds were defined in the training data. (d) Relationship between metabolic tumor volume (MTV) and sensitivity of Lung-CLiP at 98% specificity. Using 1,000 bootstrap re-samplings, sensitivity was calculated over a 25-patient sliding window of MTVs (lower x-axis). The upper x-axis depicts the theoretical tumor diameter of a single lesion corresponding to the MTVs on the lower x-axis assuming a spherical geometry. All NSCLC patients with MTV measurements in the training (n=80) and validation (n=23) were considered. The blue line represents a linear fit of log10(MTV) vs. sensitivity and red shaded regions depict the 95%, 85%, 75%, 65%, and 55% confidence intervals. Comparison of sensitivity in a given window to the average MTV in that window was performed by Spearman correlation using the non-bootstrapped data.

Comment in

References

    1. National Lung Screening Trial Research Team et al. Results of initial low-dose computed tomographic screening for lung cancer. N. Engl. J. Med 368, 1980–91 (2013). - PMC - PubMed
    1. de Koning HJ et al. Reduced Lung-Cancer Mortality with Volume CT Screening in a Randomized Trial. N. Engl. J. Med NEJMoa1911793 (2020). doi:10.1056/NEJMoa1911793 - DOI - PubMed
    1. Moyer VA Screening for Lung Cancer: U.S. Preventive Services Task Force Recommendation Statement. Ann. Intern. Med 160, 330–338 (2014). - PubMed
    1. Jemal A & Fedewa SA Lung Cancer Screening With Low-Dose Computed Tomography in the United States—2010 to 2015. JAMA Oncol. 3, 1278 (2017). - PMC - PubMed
    1. Doria-Rose VP et al. Use of lung cancer screening tests in the United States: Results from the 2010 National Health Interview Survey. Cancer Epidemiol. Biomarkers Prev 21, 1049–1059 (2012). - PMC - PubMed

Publication types

Substances