. 2020 Apr;580(7802):235-238.
doi: 10.1038/s41586-020-2153-8. Epub 2020 Apr 1.

The dental proteome of Homo antecessor

Affiliations

The dental proteome of Homo antecessor

Frido Welker et al. Nature. 2020 Apr.

Erratum in

  • Author Correction: The dental proteome of Homo antecessor.
    Welker F, Ramos-Madrigal J, Gutenbrunner P, Mackie M, Tiwary S, Jersie-Christensen RR, Chiva C, Dickinson MR, Kuhlwilm M, de Manuel M, Gelabert P, Martinón-Torres M, Margvelashvili A, Arsuaga JL, Carbonell E, Marques-Bonet T, Penkman K, Sabidó E, Cox J, Olsen JV, Lordkipanidze D, Racimo F, Lalueza-Fox C, de Castro JMB, Willerslev E, Cappellini E. Welker F, et al. Nature. 2020 Aug;584(7820):E19. doi: 10.1038/s41586-020-2580-6. Nature. 2020. PMID: 32724207

Abstract

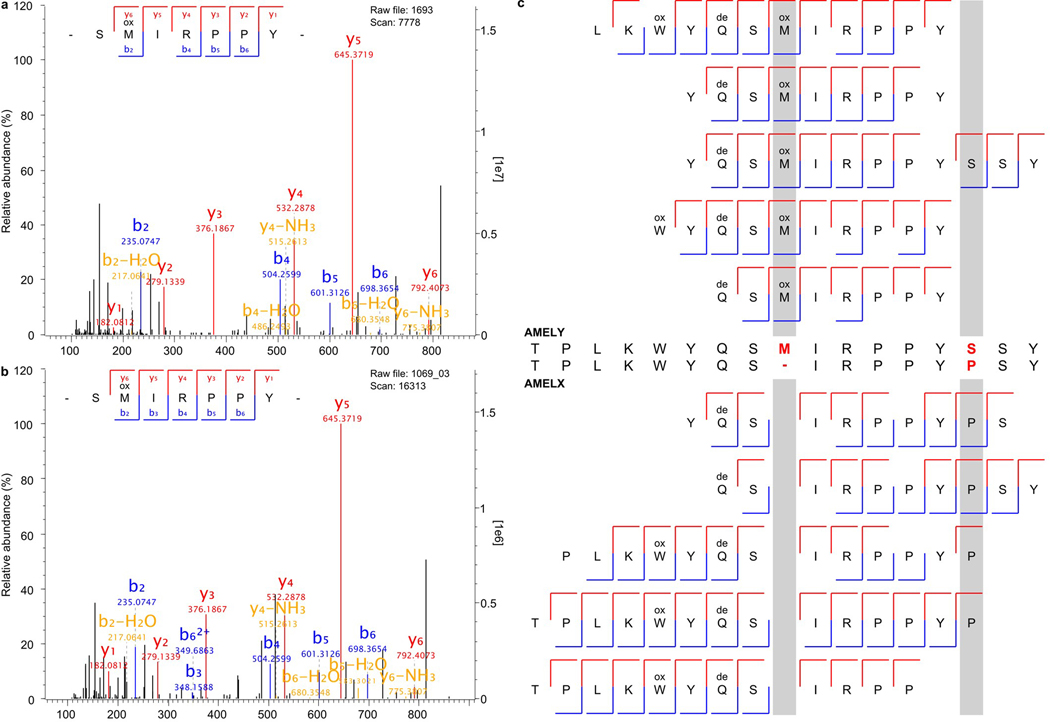
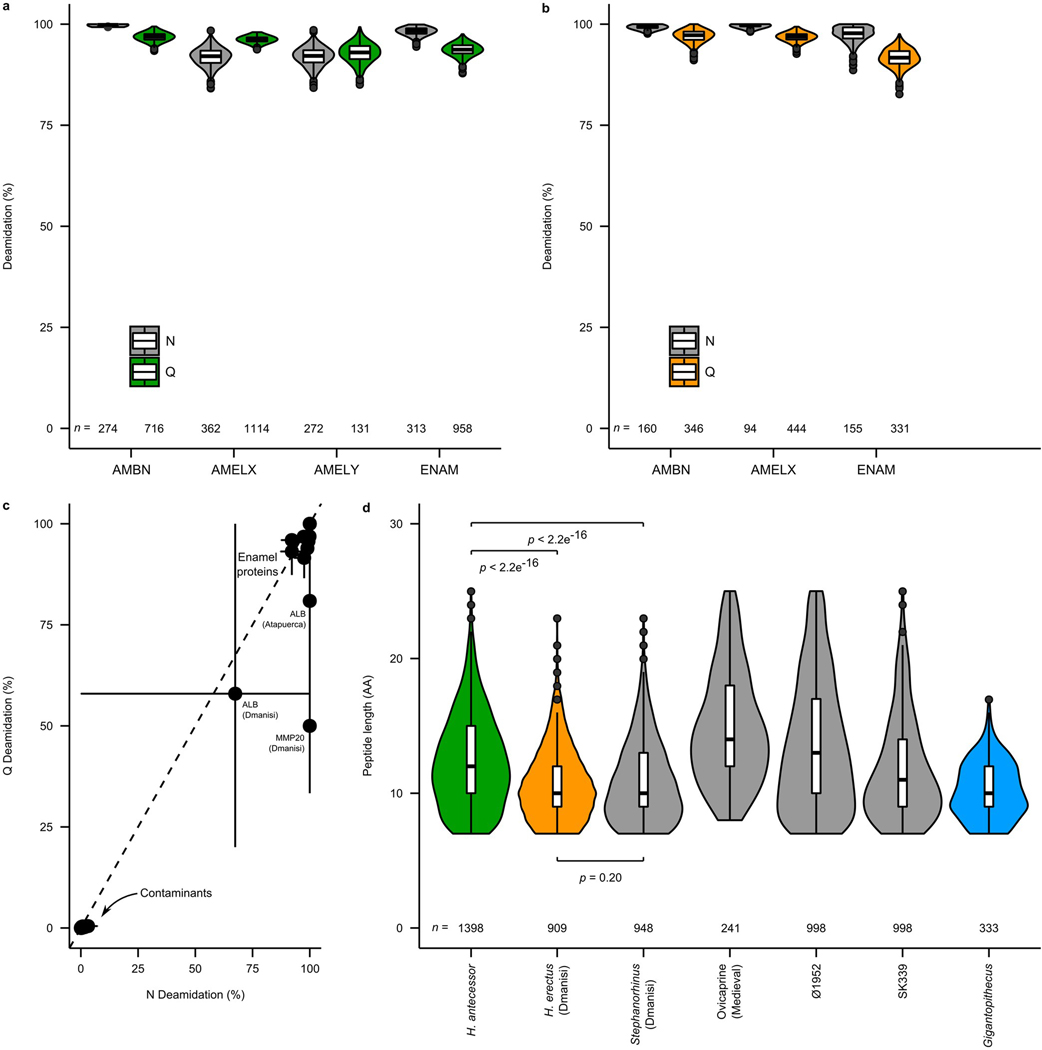
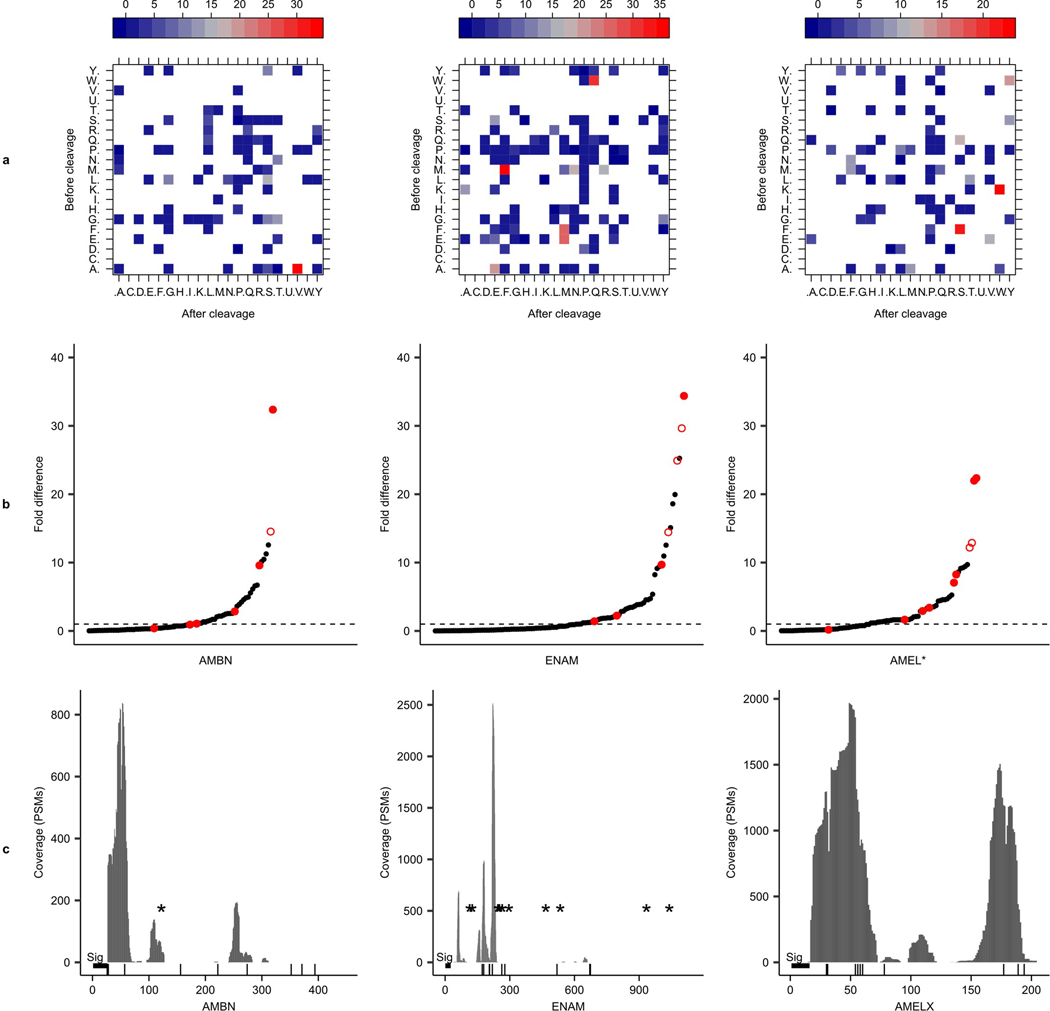
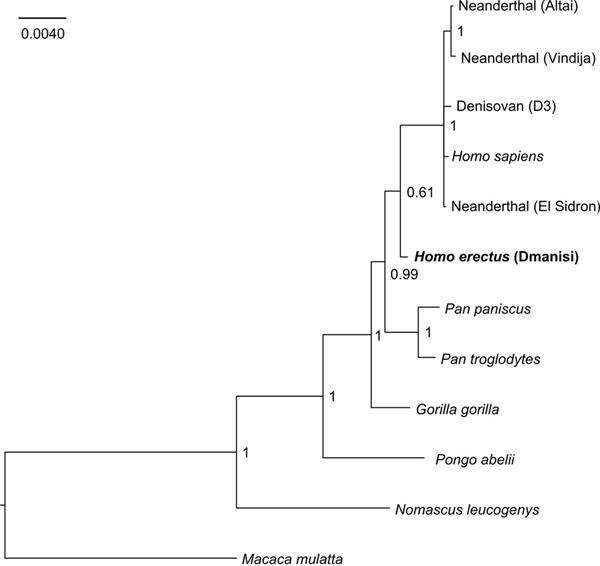
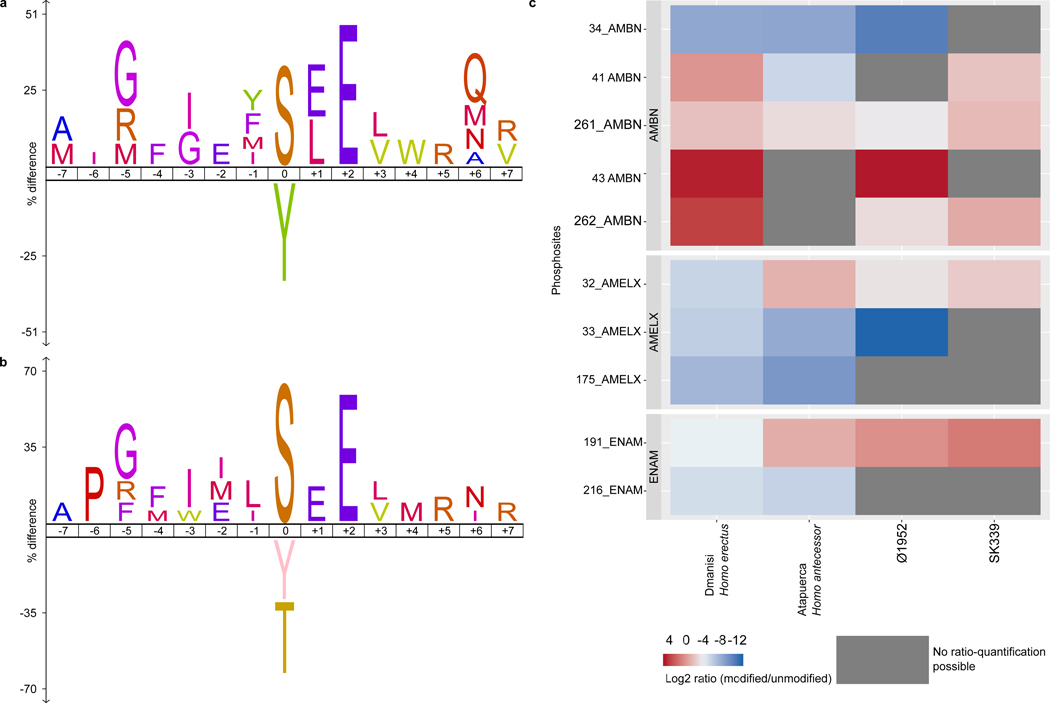
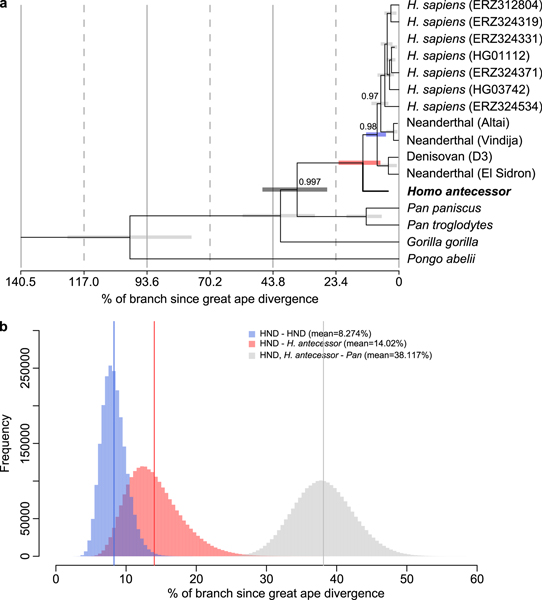
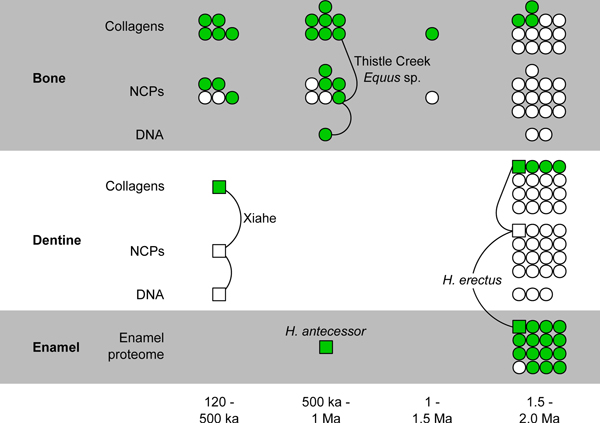
The phylogenetic relationships between hominins of the Early Pleistocene epoch in Eurasia, such as Homo antecessor, and hominins that appear later in the fossil record during the Middle Pleistocene epoch, such as Homo sapiens, are highly debated1-5. For the oldest remains, the molecular study of these relationships is hindered by the degradation of ancient DNA. However, recent research has demonstrated that the analysis of ancient proteins can address this challenge6-8. Here we present the dental enamel proteomes of H. antecessor from Atapuerca (Spain)9,10 and Homo erectus from Dmanisi (Georgia)1, two key fossil assemblages that have a central role in models of Pleistocene hominin morphology, dispersal and divergence. We provide evidence that H. antecessor is a close sister lineage to subsequent Middle and Late Pleistocene hominins, including modern humans, Neanderthals and Denisovans. This placement implies that the modern-like face of H. antecessor-that is, similar to that of modern humans-may have a considerably deep ancestry in the genus Homo, and that the cranial morphology of Neanderthals represents a derived form. By recovering AMELY-specific peptide sequences, we also conclude that the H. antecessor molar fragment from Atapuerca that we analysed belonged to a male individual. Finally, these H. antecessor and H. erectus fossils preserve evidence of enamel proteome phosphorylation and proteolytic digestion that occurred in vivo during tooth formation. Our results provide important insights into the evolutionary relationships between H. antecessor and other hominin groups, and pave the way for future studies using enamel proteomes to investigate hominin biology across the existence of the genus Homo.


Figures

Extended Data Figure 1.
Extended Data Figure 1.. Location and stratigraphy of the hominin fossils studied.
a, Geographic location of Gran Dolina, Sierra de Atapuerca (Spain) and Dmanisi (Georgia). Base map was generated using public domain data from www.naturalearthdata.com. b, Summarized stratigraphic profile of Gran Dolina, Sierra de Atapuerca, including the location of hominin fossils in sublayers “Pep” and “Jordi” of unit TD6.2.
Extended Data Figure 2.
Extended Data Figure 2.. Hominin specimens studied.
a, Specimen ATD6–92 from Gran Dolina, Atapuerca (Spain), in buccal view. The fragment represents a portion of a permanent lower left first or second molar. b, Specimen D4163 from Dmanisi (Georgia), in occlusal view. The specimen is a fragmented right upper first molar. Note differences in scale bar between a and b.
Extended Data Figure 3.
Extended Data Figure 3.. Amino acid racemization of D4163 (Homo erectus from Dmanisi).
The extent of intra-crystalline racemization in enamel for the free amino acid (FAA, x-axis) fraction and the total hydrolysable amino acids (THAA, y-axis) fraction for aspartic acid plus asparagine (here denoted Asx, a), and glutamic acid plus glutamine (here denoted Glx, b), demonstrates endogenous amino acids breaking down within a closed system. The hominin value is displayed in relation to values for enamel samples from other fauna from Dmanisi (blue squares) and a range of UK Pleistocene and Pliocene Proboscidea obtained previously (grey diamonds). Fauna species are shown for comparison, but different rates in their protein breakdown mean that they will show different extents of racemization. Note differences in x- and y-axis scales.
Extended Data Figure 4.
Extended Data Figure 4.. Sequence coverage for five enamel-specific proteins across Pleistocene samples and recent human controls.
For each protein, the bars span protein positions covered, with positions remapped to the human reference proteome. The top row indicates the position of a selection of known MMP20 and KLK4 cleavage products of the enamel-specific proteins AMELX, AMBN, and ENAM. Several in vivo proteolytic degradation fragments of ENAM share the same N-terminus, but have unknown C-termini. Dotted line for AMBN indicates a putative cleavage product based on known MMP20 (squares) and KLK4 (circles) in vivo cleavage positions. For AMTN, serines (S) at positions 115 and 116 (indicated by asterisks, *) are conserved amongst vertebrates and involved in mineral-binding,. Additional cleavage products and MMP20/KLK4 cleavage sites are known in all enamel-specific proteins. SK339 and Ø1952 represent two recent human control samples (see Methods). Steph. = Stephanorhinus. TRAP = tyrosine-rich amelogenin polypeptide. AA = amino acids. kDa = kilodalton.
Extended Data Figure 5.
Extended Data Figure 5.. Homo antecessor specimen ATD6–92 represents a male hominin.
a, AMELY-specific peptide from the recent human control Ø1952. b, The same AMELY-specific peptide from Homo antecessor. c, Alignment of a selection of AMELY- and AMELX-specific peptide fragment ion series deriving from Homo antecessor. The alignment stretches along AMELX_HUMAN isoform 1, positions 37 to 52 only (AMELX: Uniprot accession Q99217; AMELY: Uniprot accession Q99218). See Figure S5 for another example of an AMELY-specific MS2 spectrum.
Extended Data Figure 6.
Extended Data Figure 6.. Enamel proteome damage.
Glutamine (Q) and asparagine (N) deamidation of enamel-specific proteins from Homo antecessor (Atapuerca, a), and Homo erectus (Dmanisi, b). Values based on 1,000 bootstrap replications of protein deamidation. c, Relation between mean asparagine (N) and glutamine (Q) deamidation for all proteins in both the Atapuerca and Dmanisi hominin datasets. Error bars represent 95% CI interval window of 1,000 bootstrap replications of protein deamidation. Dashed line is x=y. d, Peptide length distribution of Homo antecessor (Atapuerca), Homo erectus (Dmanisi), four previously published enamel proteomes,,, and one additional human Medieval control sample (Ø1952). For a, b, and d, the number of peptides (n) is given for each vioplot. The boxplots within define the range of the data (whiskers extending to 1.5x the interquartile range), outliers (black dots, beyond 1.5x the interquartile range), 25th and 75th percentiles (boxes), and medians (centre lines). P-values of two-sided t-tests conducted between sample pairs are indicated. No independent replication of these experiments was performed.
Extended Data Figure 7.
Extended Data Figure 7.. Survival of in vivo MMP20 and KLK4 cleavage sites in the Atapuerca enamel proteome.
a, Experimentally observed cleavage matrices for ameloblastin (AMBN), enamelin (ENAM), and amelogenin (AMELX+AMELY; see Methods). Fold differences are color-coded by comparing observed PSM cleavage frequencies to a random cleavage matrix for each protein separately. b, Fold differences for all observed cleavage pairs per protein. Red filled circles represent MMP20, KLK4 and signal peptide cleavage sites mentioned in the literature. Red open circles indicate cleavage sites located up to two amino acid positions away from such sites. c, Peptide-spectrum-matches (PSM) coverage for each protein. The signal peptide (thick horizontal bar labelled ”Sig.”), known MMP20 and KLK4 cleavage sites (vertical bars), and O- and N-linked glycosylation sites (asterisks) are also indicated. For AMELX, peptide positions for all three known isoforms where remapped to the coordinates of isoform 3, which represents the longest isoform (UniProt accession Q99217–3). Note differences in x- and y-axis between the three panels of c.
Extended Data Figure 8.
Extended Data Figure 8.. Phylogenetic position of Homo erectus (D4163, Dmanisi) through Bayesian analysis.
Nomascus leucogenys and Macaca mulatta were used as outgroups.
Figure 1.
Figure 1.. Hominin enamel proteome phosphorylation.
a, Phosphorylation sequence motif analysis of specimen ATD6–92 (Homo antecessor from Atapuerca). b, Phosphorylation sequence motif analysis of specimen D4163 (Homo erectus from Dmanisi). c, Phosphorylation occupancy comparison, expressed as the log2 of the summed intensity ratio of modified and unmodified peptides, for amino acid sites where data is available for at least two specimens. Y-axis labels indicate phosphorylated amino acid position per protein (UniProt accession numbers Q9NP70 (AMBN), Q99217 (AMELX), and Q9NRM1 (ENAM)).
Figure 2.
Figure 2.. Phylogenetic analysis of Homo antecessor (ATD6–92, Gran Dolina, Atapuerca).
a, Maximum credibility tree estimated using BEAST and a concatenated alignment of seven protein sequences recovered for the ancient sample. Posterior Bayesian probabilities are indicated at nodes with a probability of ≤ 1. Horizontal error bars at each node indicate the 95% highest posterior density (HPD) intervals for the split time estimates. The position of Homo antecessor is consistent with that obtained via maximum-likelihood (Fig. S13) and Bayesian analysis (Fig. S16). b, Histograms of the divergence times obtained for the Homo antecessor – HND split (red), the HND – HND split (blue), and the Pan – (HND + Homo antecessor) split (grey). Divergence times a and b are shown as percentages since the divergence of all great apes.
Figure 3.
Figure 3.. Skeletal proteome preservation in the Middle and Early Pleistocene (0.12 – 2.6 Ma).
For each sample, the presence (green) or absence (blank) of endogenous DNA, collagens, non-collagenous proteins (NCPs), or an enamel proteome is given. Only samples for which mammalian proteomes are published are considered–,–. Hominin samples are indicated with squares, other mammalian samples with circles. Selected specimens have their separate molecular components joined and are named.

References

    1. Gabunia L et al. Earliest Pleistocene hominid cranial remains from Dmanisi, Republic of Georgia: taxonomy, geological setting, and age. Science 288, 1019–1025, doi:10.1126/science.288.5468.1019 (2000). - DOI - PubMed
    1. Zhu Z et al. Hominin occupation of the Chinese Loess Plateau since about 2.1 million years ago. Nature 559, 608–612, doi:10.1038/s41586-018-0299-4 (2018). - DOI - PubMed
    1. Stringer C The origin and evolution of Homo sapiens. Philosophical Transactions of the Royal Society B: Biological Sciences 371, doi:10.1098/rstb.2015.0237 (2016). - DOI - PMC - PubMed
    1. Hublin JJ The origin of Neandertals. Proceedings of the National Academy of Sciences 106, 16022, doi:10.1073/pnas.0904119106 (2009). - DOI - PMC - PubMed
    1. Rightmire G Human evolution in the Middle Pleistocene: the role of Homo heidelbergensis. Evolutionary anthropology 6, 218–227, doi:10.1002/(SICI)1520-6505(1998)6:6<218::AID-EVAN4>3.0.CO;2-6 (1998). - DOI

Publication types

MeSH terms