. 2020 Mar 18;7(3):191848.
doi: 10.1098/rsos.191848. eCollection 2020 Mar.

Modelling stem cell ageing: a multi-compartment continuum approach

Affiliations

Modelling stem cell ageing: a multi-compartment continuum approach

Yanli Wang et al. R Soc Open Sci. .

Erratum in

Abstract

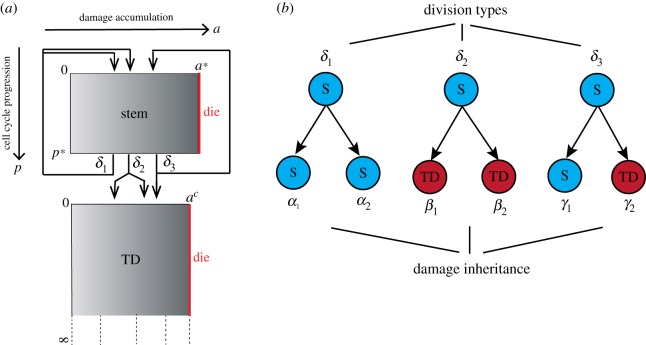
Stem cells are important to generate all specialized tissues at an early life stage, and in some systems, they also have repair functions to replenish the adult tissues. Repeated cell divisions lead to the accumulation of molecular damage in stem cells, which are commonly recognized as drivers of ageing. In this paper, a novel model is proposed to integrate stem cell proliferation and differentiation with damage accumulation in the stem cell ageing process. A system of two structured PDEs is used to model the population densities of stem cells (including all multiple progenitors) and terminally differentiated (TD) cells. In this system, cell cycle progression and damage accumulation are modelled by continuous dynamics, and damage segregation between daughter cells is considered at each division. Analysis and numerical simulations are conducted to study the steady-state populations and stem cell damage distributions under different damage segregation strategies. Our simulations suggest that equal distribution of the damaging substance between stem cells in a symmetric renewal and less damage retention in stem cells in the asymmetric division are favourable strategies, which reduce the death rate of the stem cells and increase the TD cell populations. Moreover, asymmetric damage segregation in stem cells leads to less concentrated damage distribution in the stem cell population, which may be more robust to the stochastic changes in the damage. The feedback regulation from stem cells can reduce oscillations and population overshoot in the process, and improve the fitness of stem cells by increasing the percentage of cells with less damage in the stem cell population.

Keywords: feedback regulation; modelling; stem cell ageing.


Conflict of interest statement

We declare we have no competing interests.

Figures

Figure 1.
Figure 1.
Cell divisions and damage segregation in stem cells. (a) Three types of division in stem cell population: SR stands for symmetric renewal, ASR & D stands for asymmetric renewal and differentiation and SD stands for symmetric differentiation. (b) Commonly recognized ageing factors, such as protein aggregates, dysfunction organelles and DNA damage are segregated asymmetrically between two cells during division.
Figure 2.
Figure 2.
Model descriptions of two-compartment stem cell system. Stem cells (mitotic cells) and TD cells (post-mitotic cells) are modelled as two compartments. (a) Stem cells renew themselves and replenish TD cells. The cell cycle progression (p) and damage accumulation (a) are modelled as continuous processes. Stem cell division and damage segregation take place at the end of its cell cycle (p = p*). Cells die when damage reaches a lethal threshold (a* or ac). (b) In the simple model in §3, the proportions of three types of division are constants δi, and the damage segregation rules are fixed, i.e. αi, βi, γi are constants.
Figure 3.
Figure 3.
The long-term stem cell population dynamics with different combinations of the division probabilities δ1 and δ3. The yellow regions represent the combinations of (δ1, δ3) whose corresponding population blow up or is eventually conserved, while the blue regions represent the situation where population goes to zero. The parameter values are set to be α1 = 0.3, γ1 = 0.1, p* = 1, a* = 1, vp = 0.2 and va = 0.1, if not mentioned in the subfigures.
Figure 4.
Figure 4.
Feedbacks in stem cell lineage. (a) Two types of feedback occur: the long-range feedback responding to the population of TD cells, and short-range feedback acting in an autocrine fashion in stem cells. (b) Two-compartment model with feedbacks from TD cells. (c) Two-compartment model with feedbacks from stem cells and TD cells.
Figure 5.
Figure 5.
Model with feedback only from TD cells: TD cell population and population ratio at steady state for different combinations of α1, β1 and γ1. The parameters used in these simulations are shown in table 1.
Figure 6.
Figure 6.
Results of the death rates of stem cell and the fractions of symmetric division in steady state for the model with feedbacks from TD cells under different damage segregation rules. (a) Death rate of stem cell at steady state. The definition of death rate can be found in equation (4.5). (b) Symmetric renewal fraction δ1 at steady state. The parameters used in these simulations are shown in table 1 and β1 = 0.5.
Figure 7.
Figure 7.
Dynamics of population evolution and damage distribution of stem cell population at steady state for the model with feedbacks from TD cells under different damage segregation rules. (a) Sample population dynamics under different combinations of α1 and γ1. The red curves stand for TD cell population and the blue curves are for stem cell population. (b) Population density and damage distribution for stem cells. In these three cases, we set γ1 = 0.3. The other parameters used in these simulations are listed in table 1 and β1 = 0.5.
Figure 8.
Figure 8.
TD cell population and population ratio in steady state for different combinations of α1, β1 and γ1 for the model with feedbacks from stem cells and TD cells. The parameters used in these simulations are shown in tables 1 and 2, and β1 = 0.5.
Figure 9.
Figure 9.
Dynamics of population evolution and damage distribution of stem cell population at steady state for the model with feedbacks from stem cells and TD cells under different segregation rules. (a) Sample population dynamics under different combinations of α1 and γ1. The red curves stand for TD cell population and the blue curves are for stem cell population. (b) Population density and damage distribution for stem cells. In these three cases, we set γ1 = 0.3. The other parameters used in these simulations are listed in tables 1 and 2, and β1 = 0.5.
Figure 10.
Figure 10.
Simulations for the model with feedback from TD cells for different settings of parameters. (a) Comparison of different initial division fractions. (b) Comparison of different regulation parameters. (c) Comparison of Hill exponents. The other parameters which are not listed in the figures are k1T=108, k2T=0.5×10⁸, kvT=0.5×10⁸, α1 = 0.5, β1 = 0.5, γ1 = 0.25, vp = 0.2, va = 0.06, ua = 0.02, mT = 2, δ10=0.6, δ20=0.3, δ30=0.1.
Figure 11.
Figure 11.
Demonstration of upper bound estimation of the population.

References

    1. Morrison SJ, Kimble J. 2006. Asymmetric and symmetric stem-cell divisions in development and cancer. Nature 441, 1068–1074. (10.1038/nature04956) - DOI - PubMed
    1. Jilkine A. 2019. Mathematical models of stem cell differentiation and dedifferentiation. Curr. Stem Cell Rep. 5, 66–72. (10.1007/s40778-019-00156-z) - DOI
    1. Knoblich JA. 2008. Mechanisms of asymmetric stem cell division. Cell 132, 583–597. (10.1016/j.cell.2008.02.007) - DOI - PubMed
    1. Liu L, Rando TA. 2011. Manifestations and mechanisms of stem cell aging. J. Cell Biol. 193, 257–266. (10.1083/jcb.201010131) - DOI - PMC - PubMed
    1. Rando TA. 2006. Stem cells, ageing and the quest for immortality. Nature 441, 1080–1086. (10.1038/nature04958) - DOI - PubMed

LinkOut - more resources