. 2020 Mar 25:8:194.
doi: 10.3389/fcell.2020.00194. eCollection 2020.

Comprehensive Analysis of the Genetic and Epigenetic Mechanisms of Osteoporosis and Bone Mineral Density

Affiliations

Comprehensive Analysis of the Genetic and Epigenetic Mechanisms of Osteoporosis and Bone Mineral Density

Hui Dong et al. Front Cell Dev Biol. .

Abstract

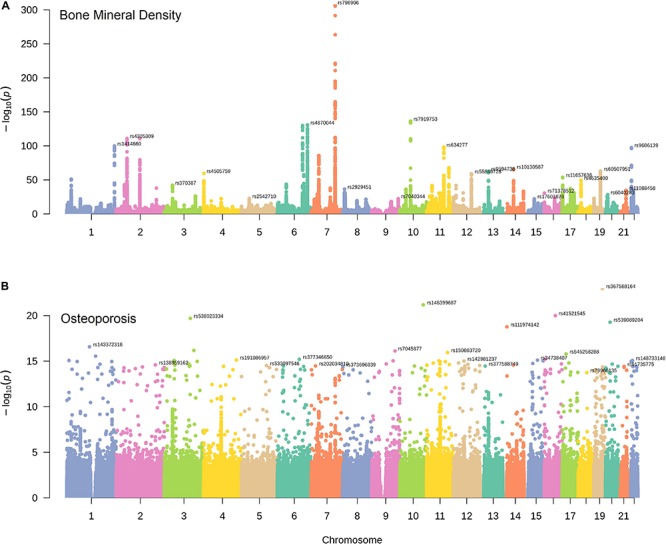
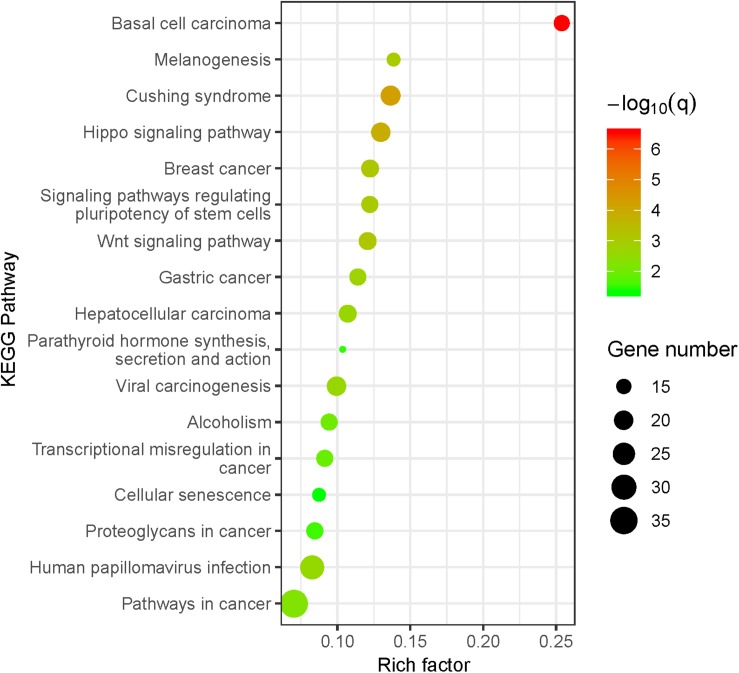
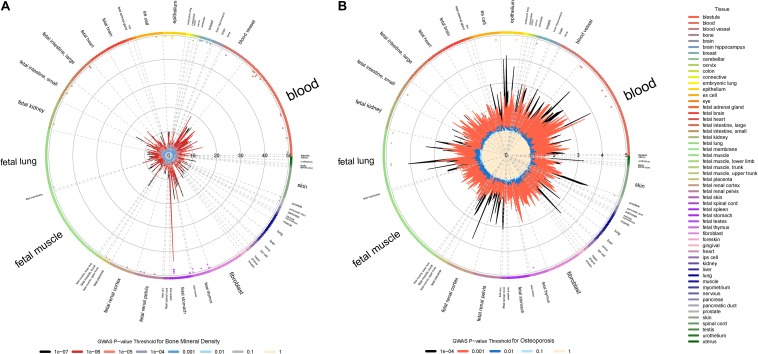
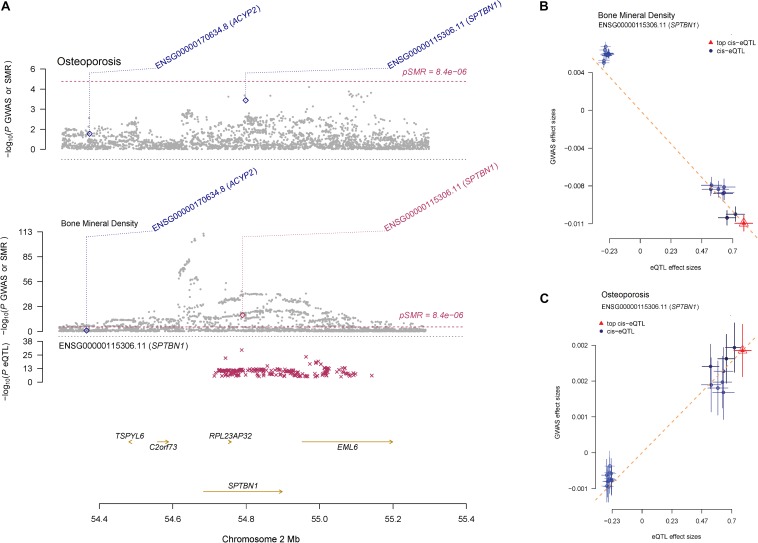
Osteoporosis is a skeletal disorder characterized by a systemic impairment of bone mineral density (BMD). Genome-wide association studies (GWAS) have identified hundreds of susceptibility loci for osteoporosis and BMD. However, the vast majority of susceptibility loci are located in non-coding regions of the genome and provide limited information about the genetic mechanisms of osteoporosis. Herein we performed a comprehensive functional analysis to investigate the genetic and epigenetic mechanisms of osteoporosis and BMD. BMD and osteoporosis are found to share many common susceptibility loci, and the corresponding susceptibility genes are significantly enriched in bone-related biological pathways. The regulatory element enrichment analysis indicated that BMD and osteoporosis susceptibility loci are significantly enriched in 5'UTR and DNase I hypersensitive sites (DHSs) of peripheral blood immune cells. By integrating GWAS and expression Quantitative Trait Locus (eQTL) data, we found that 15 protein-coding genes are regulated by the osteoporosis and BMD susceptibility loci. Our analysis provides new clues for a better understanding of the pathogenic mechanisms and offers potential therapeutic targets for osteoporosis.

Keywords: bone mineral density; functional element enrichment analysis; genome-wide association study; osteoporosis; summary data-based Mendelian randomization.


Figures

FIGURE 1
FIGURE 1
The distribution of BMD and osteoporosis susceptibility loci. Manhattan plots of single nucleotide variant associations for BMD (A) and osteoporosis (B) identified by UK Biobank. The top-SNP associations on each chromosome are annotated on the plot.
FIGURE 2
FIGURE 2
KEGG pathway enrichment analysis for BMD susceptibility loci located in protein-coding regions. The size of the point means the gene number both in BMD susceptibility genes and KEGG pathways. The color of point means enrichment significance (–log10 Q-value). The pathways were sorted by the rich factor (the ratio of BMD susceptibility gene number in this pathway to gene number in this pathway term).
FIGURE 3
FIGURE 3
Regulatory element enrichment analysis of BMD and osteoporosis susceptibility loci located in non-coding regions. (A) Bone mineral density. (B) Osteoporosis. Radial lines with different color show FE values at their corresponding GWAS P-value thresholds for all ENCODE and Roadmap Epigenomics DNase I hypersensitive cell lines, sorted by tissue on the outer circle. The font size of tissue is directly proportional to the number of cell lines. The significance of enrichment for a given cell line is marked by the dots in the inner ring of the outer circle.
FIGURE 4
FIGURE 4
The regulation mechanism of SPTBN1 locus for BMD and osteoporosis. (A) P-values of GWAS (gray dots) for BMD (top) and osteoporosis (middle) and P-value for the SMR test (diamonds) using the GTEx blood eQTL data. The bottom plot shows the eQTL P-values from GTEx blood tissue for the SPTBN1 gene (red stars). The dots shown in the plot include all the SNPs at these loci in the GWAS and eQTL summary data, respectively. (B, C) Effect sizes of SNPs from BMD (B) and osteoporosis (C) GWAS data against those from the GTEx blood eQTL data. The orange dashed lines represent effect size (bxy) of eQTL on phenotype. Error bars are the standard errors of SNP effects.

References

    1. Aggarwal L., Masuda C. (2018). Osteoporosis: a quick update. J. Fam. Pract. 67 59–65. - PubMed
    1. Al-Barghouthi B. M., Farber C. R. (2019). Dissecting the genetics of osteoporosis using systems approaches. Trends Genet. 35 55–67. 10.1016/j.tig.2018.10.004 - DOI - PMC - PubMed
    1. Araujo P. R., Yoon K., Ko D., Smith A. D., Qiao M., Suresh U., et al. (2012). Before it gets started: regulating translation at the 5′. UTR. Comp. Funct. Genomics 2012:475731. 10.1155/2012/475731 - DOI - PMC - PubMed
    1. Bulik-Sullivan B., Finucane H. K., Anttila V., Gusev A., Day F. R., Loh P. R., et al. (2015). An atlas of genetic correlations across human diseases and traits. Nat. Genet. 47 1236–1241. 10.1038/ng.3406 - DOI - PMC - PubMed
    1. Bycroft C., Freeman C., Petkova D., Band G., Elliott L. T., Sharp K., et al. (2018). The UK Biobank resource with deep phenotyping and genomic data. Nature 562 203–209. 10.1038/s41586-018-0579-z - DOI - PMC - PubMed

LinkOut - more resources