. 2020 Apr 1;6(14):eaay2587.
doi: 10.1126/sciadv.aay2587. eCollection 2020 Apr.

Virus-host coexistence in phytoplankton through the genomic lens

Affiliations

Virus-host coexistence in phytoplankton through the genomic lens

Sheree Yau et al. Sci Adv. .

Abstract

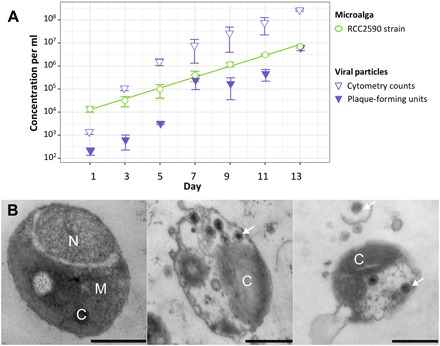
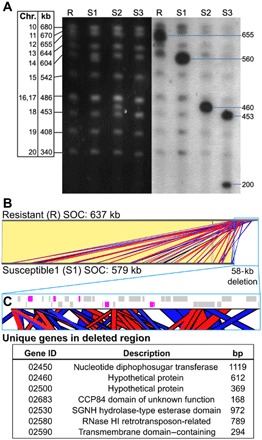
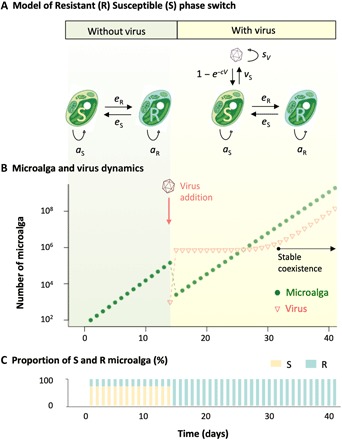
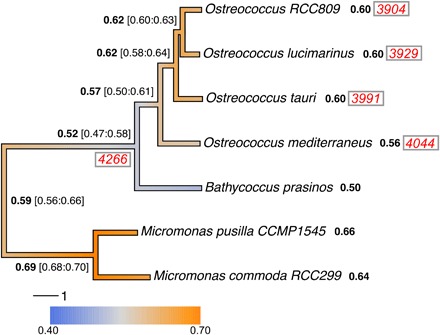
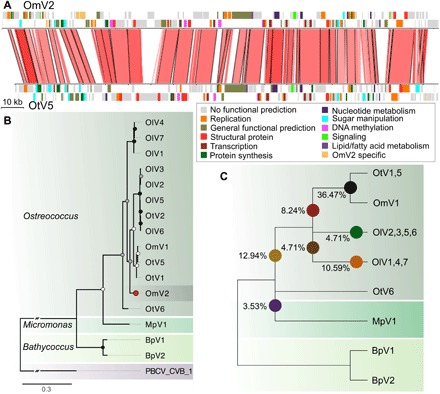
Virus-microbe interactions in the ocean are commonly described by "boom and bust" dynamics, whereby a numerically dominant microorganism is lysed and replaced by a virus-resistant one. Here, we isolated a microalga strain and its infective dsDNA virus whose dynamics are characterized instead by parallel growth of both the microalga and the virus. Experimental evolution of clonal lines revealed that this viral production originates from the lysis of a minority of virus-susceptible cells, which are regenerated from resistant cells. Whole-genome sequencing demonstrated that this resistant-susceptible switch involved a large deletion on one chromosome. Mathematical modeling explained how the switch maintains stable microalga-virus population dynamics consistent with their observed growth pattern. Comparative genomics confirmed an ancient origin of this "accordion" chromosome despite a lack of sequence conservation. Together, our results show how dynamic genomic rearrangements may account for a previously overlooked coexistence mechanism in microalgae-virus interactions.


Figures

Fig. 1
Fig. 1. Population dynamics of the algae and virus.
(A) Population dynamics of microalga (circles) and prasinovirus (triangles) concentrations over 14 days in the O. mediterraneus RCC2590 culture. The line is fitted via ordinary least square regression. (B) Transmission electron micrographs of O. mediterraneus RCC2590 cells from an actively growing culture. The majority of cells have typical morphology (left), while 0.9% of cells contained visible viral particles (middle and right) and free viral particles were observed in the medium aggregated around infected cells (right). Scale bars, 500 nm; C, chloroplast; M, mitochondrion; N, nucleus. White arrows indicate examples of virus particles.
Fig. 2
Fig. 2. Comparison of SOC from O. mediterraneus RCC2590 virus-resistant (R) and virus-susceptible (S) lines.
(A) Karyotyping of R and S lines by PFGE (left; black background) and in-gel hybridization with SOC-specific probes (right; gray background). (B) Nucleotide sequence alignment of the SOCs of R and S1 lines shows that they are virtually identical (identical regions linked with yellow blocks) except for a 58-kb deletion at the end of the S1 SOC. The deletion consists of short sequences with significant identity to the rest of the SOC, shown by red and blue blocks denoting sense and antisense matches, respectively. (C) Zoomed-in view of the genomic map of the 58-kb deletion (blue outline). Gray blocks are genes with significant identity to other SOC loci. Magenta blocks show unique genes deleted in the S1 SOC with the table below listing their gene identifiers (prefixed by Ostme30g), putative functional description, and gene length. bp, base pairs; RNase, ribonuclease.
Fig. 3
Fig. 3. Model predictions of microalga-virus population dynamics.
(A) Model parameters with and without virus. (B) Simulation of the evolution of the number of microalga cells during 40 days; viruses are introduced after 13 days, and the system converged to its virus/microalga equilibrium behavior after 18 days (aS = 1.75, aR = 1.7, and eS = eR = 0.01). (C) Evolution of the proportion of susceptible (S) and resistant (R) microalga; initial S and R values have been set to reflect equilibrium proportion without virus.
Fig. 4
Fig. 4. Phylogeny of fully sequenced Mamiellales genomes, gene family gain and loss, and reconstructed ancestral global GC contents and protein families.
The phylogenetic tree was calculated from random subsampling of 2161 Mamiellales single-copy orthologous gene alignments. The branch colors correspond to the estimated changes in GC over time. The average genome-wide GC contents of extant genomes are shown after the species in bold, and the ancestral estimates are shown at the nodes with ranges in square brackets (see Materials and Methods for the GC evolution estimates). The total number of protein families common to Bathycoccus and Micromonas are shown in red italics between parentheses at the node leading to those genera, and the numbers of those orthologs present in extant Ostreococcus are shown after the species names.
Fig. 5
Fig. 5. Phylogenomic analysis of prasinovirus OmV2.
(A) Whole-genome alignment of OmV2 compared to the O. tauri virus, OtV5. Genomic regions with 60 to 100% nucleotide identity are joined by red blocks with higher identity indicated by darker red. Genes are colored according to functional groups. (B) Maximum likelihood phylogenetic tree of amino acid sequences of the DNA polymerase B gene from prasinoviruses infecting the genera Ostreococcus, Micromonas, and Bathycoccus. The tree was rooted with PBCV-1 (Chlorovirus) with the connecting branch truncated for display. The red circle highlights the position of OmV2. Circles at the nodes represent bootstrap support of 50 to 70% (white), 70 to 90% (gray), and 90 to 100% (black). The scale bar shows substitutions per site. (C) Cladogram representing the relationships between the fully sequenced prasinovirus clades from 85 core genes. Colored circles mark the branching positions of the percentage of the OmV2 orthologs.

References

    1. Suttle C. A., Marine viruses—Major players in the global ecosystem. Nat. Rev. Microbiol. 5, 801–812 (2007). - PubMed
    1. Brussaard C. P. D., Wilhelm S. W., Thingstad F., Weinbauer M. G., Bratbak G., Heldal M., Kimmance S. A., Middelboe M., Nagasaki K., Paul J. H., Schroeder D. C., Suttle C. A., Vaqué D., Wommack K. E., Global-scale processes with a nanoscale drive: The role of marine viruses. ISME J. 2, 575–578 (2008). - PubMed
    1. Hingamp P., Grimsley N., Acinas S. G., Clerissi C., Subirana L., Poulain J., Ferrera I., Sarmento H., Villar E., Lima-Mendez G., Faust K., Sunagawa S., Claverie J.-M., Moreau H., Desdevises Y., Bork P., Raes J., de Vargas C., Karsenti E., Kandels-Lewis S., Jaillon O., Not F., Pesant S., Wincker P., Ogata H., Exploring nucleo-cytoplasmic large DNA viruses in Tara Oceans microbial metagenomes. ISME J. 7, 1678–1695 (2013). - PMC - PubMed
    1. Tragin M., Vaulot D., Green microalgae in marine coastal waters: The Ocean Sampling Day (OSD) dataset. Sci. Rep. 8, 14020 (2018). - PMC - PubMed
    1. Zhu F., Massana R., Not F., Marie D., Vaulot D., Mapping of picoeucaryotes in marine ecosystems with quantitative PCR of the 18S rRNA gene. FEMS Microbiol. Ecol. 52, 79–92 (2005). - PubMed

Publication types

LinkOut - more resources