. 2020 Apr 1;6(14):eaay4858.
doi: 10.1126/sciadv.aay4858. eCollection 2020 Apr.

ENL initiates multivalent phase separation of the super elongation complex (SEC) in controlling rapid transcriptional activation

Affiliations

ENL initiates multivalent phase separation of the super elongation complex (SEC) in controlling rapid transcriptional activation

Chenghao Guo et al. Sci Adv. .

Abstract

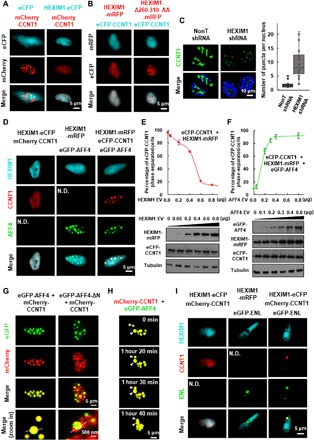
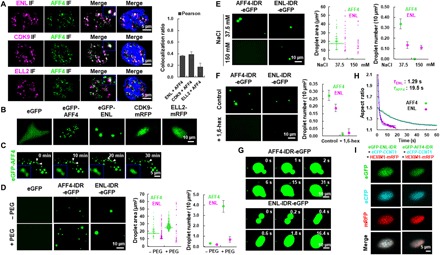
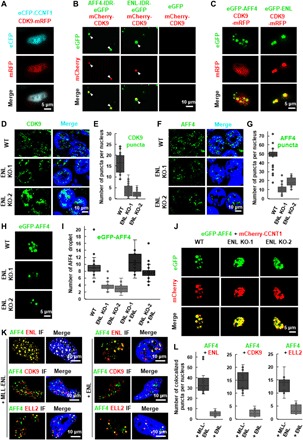
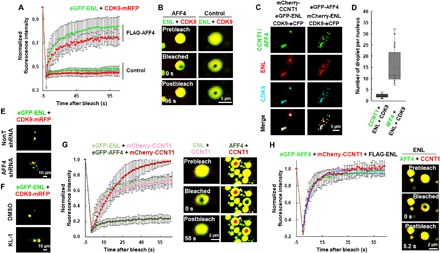
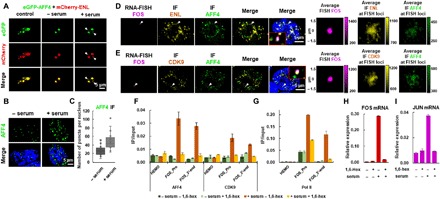
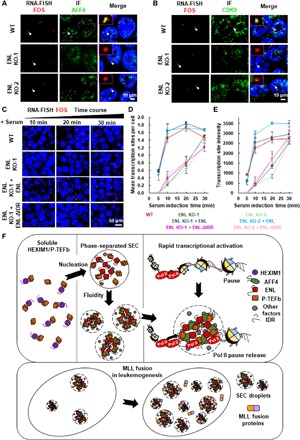
Release of paused RNA polymerase II (Pol II) requires incorporation of the positive transcription elongation factor b (P-TEFb) into the super elongation complex (SEC), thus resulting in rapid yet synchronous transcriptional activation. However, the mechanism underlying dynamic transition of P-TEFb from inactive to active state remains unclear. Here, we found that the SEC components are able to compartmentalize and concentrate P-TEFb via liquid-liquid phase separation from the soluble inactive HEXIM1 containing the P-TEFb complex. Specifically, ENL or its intrinsically disordered region is sufficient to initiate the liquid droplet formation of SEC. AFF4 functions together with ENL in fluidizing SEC droplets. SEC droplets are fast and dynamically formed upon serum exposure and required for rapid transcriptional induction. We also found that the fusion of ENL with MLL can boost SEC phase separation. In summary, our results suggest a critical role of multivalent phase separation of SEC in controlling transcriptional pause release.


Figures

Fig. 1
Fig. 1. The SEC components AFF4 and ENL compartmentalize CCNT1 from HEXIM1 through forming heterotypic phase-separated droplets.
(A) Live cell imaging of HeLa cells expressing mCherry-CCNT1 only or together with HEXIM1-eCFP. (B) Live cell imaging of HeLa cells coexpressing eCFP-CCNT1 together with wild-type HEXIM1 or HEXIM1-Δ260-310 AA-mRFP. (C) IF imaging (left) of CCNT1 in control or HEXIM1 knockdown HCT 116 cells. DNA was counterstained using DAPI (4′,6-diamidino-2-phenylindole). Box plot (right) showing that the number of CCNT1 puncta per nucleus is significantly increased after shRNA-mediated HEXIM1 knockdown. Each n > 20 nuclei; error bars represent the distribution between the 90th and 10th percentiles. Results are representative of three biological replicates. (D) Live cell imaging of HeLa cells coexpressing HEXIM1 and CCNT1 (left), HEXIM1 and AFF4 (middle), or the three proteins together (right) with different fluorescence tags. N.D., not detected. (E) Percentage of cells with eCFP-CCNT1 phase-separated droplets (upper) and Western analyses (lower) are shown after cotransfecting HeLa cells with eCFP-CCNT1 and increasing amount of the HEXIM1-mRFP construct. Error bars represent SDs. Results are representative of three biological replicates. (F) Percentage of cells with eCFP-CCNT1 phase-separated droplets (upper) and Western analyses (lower) are shown after cotransfecting HeLa cells with eCFP-CCNT1, HEXIM1-mRFP, and increasing amount of the eGFP-AFF4 construct. Error bars represent SDs. Results are representative of three biological replicates. (G) Live cell imaging of HeLa cells coexpressing eGFP-AFF4 and mCherry-CCNT1 (left), and eGFP-AFF4-ΔN and mCherry-CCNT1 (right). (H) Time-lapse fluorescence images of the nucleus of a HeLa cell expressing mCherry-CCNT1 and eGFP-AFF4 subjected to illuminate every 10 min for the times indicated. The two CCNT1 and AFF4 heterotypic droplets underwent spontaneous fusion as indicated by arrows. (I) Live cell imaging of HeLa cells coexpressing HEXIM1 and CCNT1 (left), HEXIM1 and ENL (middle), or the three proteins together (right) with different fluorescence tags.
Fig. 2
Fig. 2. The SEC components exhibit differential phase separation capabilities.
(A) Confocal images (left) showing colocalization of AFF4 with ENL, ELL2, and CDK9 in nuclear puncta in HeLa cells. DNA was counterstained using DAPI. Histogram (right) showing the Pearson correlation coefficient of colocalization ratio. Each n > 20; error bars represent SDs. Results are representative of three biological replicates. (B) Live cell imaging of HeLa cells expressing eGFP-AFF4, eGFP-ENL, CDK9-mRFP, or ELL2-mRFP only. eGFP was used as a negative control. (C) Time-lapse fluorescence images of the nucleus of a HeLa cell expressing eGFP-AFF4 subjected to illuminate every 15 s for the times indicated. The two AFF4 droplets underwent spontaneous fusion as indicated by arrows. (D) Fluorescence microscopy images (left) showing phase-separated droplets formed in 37.5 mM NaCl containing buffer with 20 μM AFF4-IDR-eGFP or ENL-IDR-eGFP in the absence or presence of PEG-8000. Purified eGFP was used as a negative control. Droplet area (middle) and number (right) are also shown. Error bars represent SDs. Results are representative of three biological replicates. (E) Fluorescence microscopy images (left) showing the AFF4-IDR-eGFP or ENL-IDR-eGFP droplets in buffers containing 20 μM purified proteins and different concentrations of NaCl. Droplet area (middle) and number (right) are also shown. Error bars represent SDs. Results are representative of three biological replicates. (F) Fluorescence microscopy images (left) showing that the AFF4-IDR-eGFP or ENL-IDR-eGFP droplets in buffer containing 20 μM purified proteins and 37.5 mM NaCl are sensitive to 3% 1,6-hexanediol. Droplet number (right) is also shown. Error bars represent SDs. Results are representative of three biological replicates. (G) Time-lapse fluorescence images showing that the homotypic AFF4-IDR-eGFP (upper) or ENL-IDR-eGFP (lower) droplets rapidly fuse upon contact into one spherical droplet. The AFF4-IDR-eGFP (upper) and ENL-IDR-eGFP (lower) were subjected to illuminate every second or 200 ms, respectively. The droplet formation buffer contains 10% PEG-8000 and 37.5 mM NaCl. (H) Aspect ratio versus time for droplet fusion of AFF4-IDR-eGFP (green) and ENL-IDR-eGFP (purple). T designates relaxation time of the fusion events, and the blue line indicates nonlinear fitting curve. (I) Live cell imaging of HeLa cells coexpressing eCFP-CCNT1, HEXIM1-mRFP with either eGFP-ENL-IDR (left) or eGFP-AFF4-IDR (right).
Fig. 3
Fig. 3. ENL promotes the multivalent phase separation of SEC.
(A) Live cell imaging of HeLa cells coexpressing eCFP-CCNT1 and CDK9-mRFP. (B) Fluorescence microscopy images showing that the purified mCherry-CDK9 proteins can form heterotypic droplets together with AFF4-IDR-eGFP or ENL-IDR-eGFP. The purified eGFP protein was used as a negative control. Purified proteins (10 μM) were used, and the droplet formation buffer contains 10% PEG-8000 and 50 mM NaCl. (C) Live cell imaging of HeLa cells expressing CDK9-mRFP together with eGFP-AFF4 or eGFP-ENL. (D) IF imaging of CDK9 in wild-type and ENL knockout HCT 116 cells. DNA was counterstained using DAPI. (E) Box plot showing that the number of CDK9 puncta per nucleus is significantly decreased after ENL knockout. Each n > 30 nuclei; error bars represent the distribution between the 90th and 10th percentiles. Results are representative of three biological replicates. (F) IF imaging of AFF4 in wild-type and ENL knockout HCT 116 cells. DNA was counterstained using DAPI. (G) Box plot showing that the number of AFF4 puncta per nucleus is significantly decreased after ENL knockout. Each n > 30 nuclei; error bars represent the distribution between the 90th and 10th percentiles. Results are representative of three biological replicates. (H) Live cell imaging of HCT 116 wild-type and ENL knockout cells expressing eGFP-AFF4. (I) Box plot showing that the number of eGFP-AFF4 droplets per nucleus is significantly decreased after ENL knockout, which can be rescued by overexpression of mCherry-ENL. Each n > 20; error bars represent the distribution between the 90th and 10th percentiles. Results are representative of three biological replicates. (J) Live cell imaging of HCT 116 wild-type and ENL knockout cells coexpressing eGFP-AFF4 and mCherry-CCNT1. (K) IF imaging showing costaining of AFF4 with ENL, CDK9, or ELL2 in HeLa cells transfected with MLL-ENL (left) or ENL (right). DNA was counterstained using DAPI. (L) Box plot showing that the number of AFF4/ENL (left), AFF4/CDK9 (middle), and AFF4/ELL2 (right) colocalized puncta per nucleus is significantly increased after transfection with MLL-ENL. Each n > 20; error bars represent the distribution between the 90th and 10th percentiles. Results are representative of three biological replicates.
Fig. 4
Fig. 4. Fluidity of the ENL heterotypic droplets depends on AFF4.
(A) Normalized FRAP recovery curves for eGFP-ENL (green) and CDK9-mRFP (red) in the heterotypic droplet in the presence or absence of FLAG-AFF4. The bleaching events occurred at 0 s. Results shown are from six biological replicates. (B) Live cell confocal images showing FRAP of the heterotypic eGFP-ENL and CDK9-mRFP droplet in the presence or absence of FLAG-AFF4. (C) Live cell imaging of HeLa cells coexpressing ENL and CDK9 together with CCNT1 (left) or AFF4 (right) with different fluorescence tags. (D) Box plot showing the number of the indicated heterotypic droplets per nucleus. Each n > 20; error bars represent the distribution between the 90th and 10th percentiles. Results are representative of three biological replicates. (E) Live cell imaging of control and AFF4 knockdown HCT 116 cells coexpressing eGFP-ENL and CDK9-mRFP. (F) Live cell imaging of HCT 116 cells coexpressing eGFP-ENL and CDK9-mRFP in the presence or absence of KL-1. (G) Normalized FRAP recovery curves (left) for mCherry-CCNT1 (pink or red), eGFP-ENL (light green), and eGFP-AFF4 (green) in the CCNT1/ENL and CCNT1/AFF4 heterotypic droplets, respectively. The bleaching events occurred at 0 s. Live cell confocal images (right) showing FRAP of the CCNT1/ENL and CCNT1/AFF4 heterotypic droplets. Results shown are from six biological replicates. (H) Normalized FRAP recovery curves (left) for eGFP-AFF4 (green) and mCherry-CCNT1 (red) in the heterotypic droplet in the presence of FLAG-ENL. The bleaching events occurred at 0 s. Live cell confocal images (right) showing FRAP of the heterotypic AFF4/CCNT1 droplet in the presence of FLAG-ENL. Results shown are from six biological replicates.
Fig. 5
Fig. 5. SEC puncta localize to immediate-response genes in vivo upon serum treatment.
(A) Live cell imaging of HCT 116 cells coexpressing eGFP-AFF4 and mCherry-ENL in control, serum-starved, and serum-treated conditions. The newly formed eGFP-AFF4 and mCherry-ENL heterotypic droplets after serum treatment are indicated by arrows. (B) IF imaging of AFF4 in serum-starved or serum-treated HCT 116 cells. DNA was counterstained using DAPI. (C) Box plot showing that the number of AFF4 puncta per nucleus is significantly increased after serum treatment. Each n > 20 nuclei; error bars represent the distribution between the 90th and 10th percentiles. Results are representative of three biological replicates. (D) Confocal imaging of FOS RNA FISH with concurrent ENL and AFF4 IF showing that ENL and AFF4 co-occupy the FOS loci after serum treatment. DNA was counterstained using DAPI. Zoomed-in views of the white arrow–indicated regions are shown. The three columns on the right show average FOS FISH signal and average ENL (or AFF4) IF signal centered on the FISH foci (see Materials and Methods). Data shown were analyzed from at least four biological replicates. (E) Confocal imaging of FOS RNA FISH with concurrent CDK9 and AFF4 IF showing that CDK9 and AFF4 co-occupy the FOS loci after serum treatment. DNA was counterstained using DAPI. Zoomed-in views of the white arrow–indicated regions are shown. The three columns on the right show the average FOS FISH signal and average CDK9 (or AFF4) IF signal centered on the FISH foci (see Materials and Methods). Data shown were analyzed from at least four biological replicates. (F and G) ChIP-qPCR showing the occupancies of AFF4, CDK9 (F), and Pol II (G) at the promoter and 3′-end of FOS under the indicated conditions. The HEMO gene serves as a negative control for ChIP-qPCR. (H and I) RT-qPCR showing the RNA levels of FOS (H) and JUN (I) under indicated conditions. (F to I) Error bars represent SDs. Results are representative of three biological replicates.
Fig. 6
Fig. 6. Rapid transcriptional induction by SEC depends on its ability to phase separate.
(A and B) Confocal imaging of FOS FISH with concurrent AFF4 (A) or CDK9 (B) IF in wild-type and ENL knockout HCT 116 cells after serum treatment. (C) Confocal imaging of FOS FISH in wild-type and ENL knockout HCT 116 cells after serum stimulation for different time periods. Only wild-type ENL, but not the ENL IDR deletion mutant, can rescue FOS transcriptional induction defect caused by ENL knockout. DNA was counterstained using DAPI. (D) Mean number of locus transcribing FOS per cell after serum stimulation for different time periods in wild-type and ENL knockout HCT 116 cells. Total n > 100 cells. Results are representative of three biological replicates. (E) Median fluorescence intensities of FOS transcribing loci after serum stimulation for different time periods in wild-type and ENL knockout HCT 116 cells. Total n > 100 cells. Results are representative of three biological replicates. (F) Cartoon model showing that the SEC components compartmentalize P-TEFb from HEXIM1 and that the SEC complex form phase-separated droplets at its target gene to promote RNA pol II pause release. The fusion of the SEC subunits, such as ENL, with MLL leads to increased phase separation of SEC.

Similar articles

Cited by

References

    1. Adelman K., Lis J. T., Promoter-proximal pausing of RNA polymerase II: Emerging roles in metazoans. Nat. Rev. Genet. 13, 720–731 (2012). - PMC - PubMed
    1. Levine M., Paused RNA polymerase II as a developmental checkpoint. Cell 145, 502–511 (2011). - PMC - PubMed
    1. Boettiger A. N., Levine M., Synchronous and stochastic patterns of gene activation in the Drosophila embryo. Science 325, 471–473 (2009). - PMC - PubMed
    1. Lin C., Garrett A. S., De Kumar B., Smith E. R., Gogol M., Seidel C., Krumlauf R., Shilatifard A., Dynamic transcriptional events in embryonic stem cells mediated by the super elongation complex (SEC). Genes Dev. 25, 1486–1498 (2011). - PMC - PubMed
    1. Luo Z., Lin C., Shilatifard A., The super elongation complex (SEC) family in transcriptional control. Nat. Rev. Mol. Cell Biol. 13, 543–547 (2012). - PubMed

Publication types

MeSH terms

LinkOut - more resources