A systematic review of the agreement of recall, home-based records, facility records, BCG scar, and serology for ascertaining vaccination status in low and middle-income countries
- PMID: 32270134
- PMCID: PMC7110941
- DOI: 10.12688/gatesopenres.12916.2
A systematic review of the agreement of recall, home-based records, facility records, BCG scar, and serology for ascertaining vaccination status in low and middle-income countries
Abstract
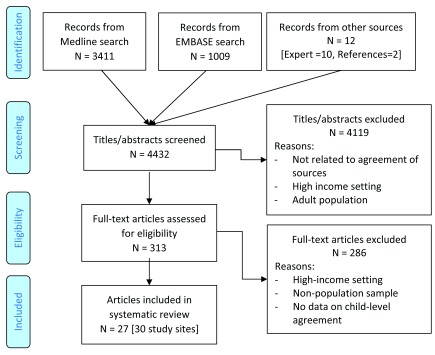
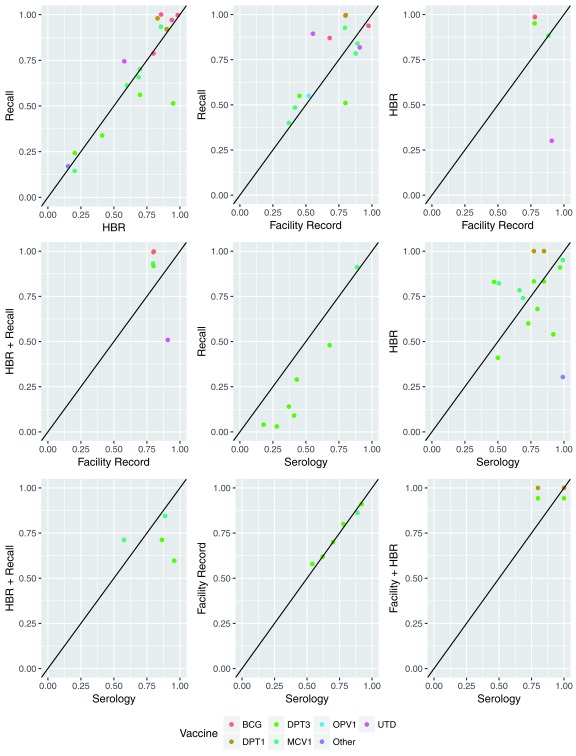
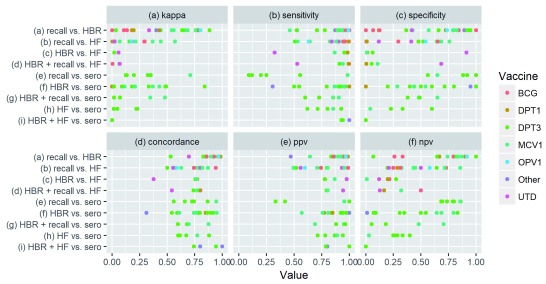
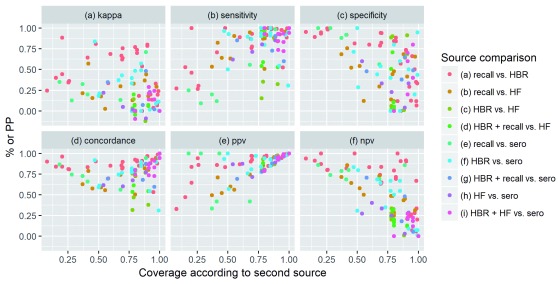
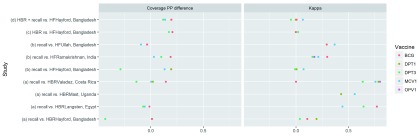
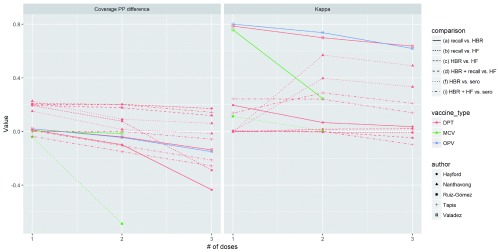
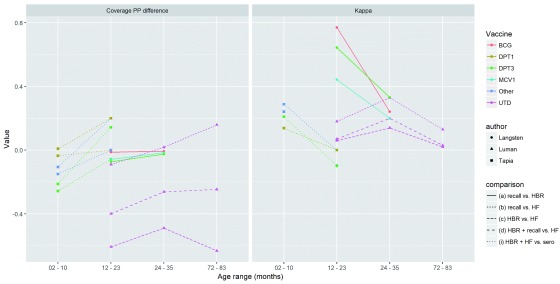
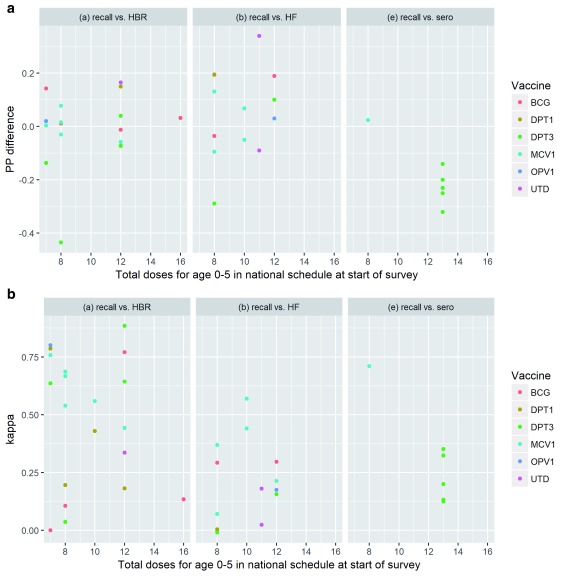
Background: Household survey data are frequently used to estimate vaccination coverage - a key indicator for monitoring and guiding immunization programs - in low and middle-income countries. Surveys typically rely on documented evidence from home-based records (HBR) and/or maternal recall to determine a child's vaccination history, and may also include health facility sources, BCG scars, and/or serological data. However, there is no gold standard source for vaccination history and the accuracy of existing sources has been called into question. Methods and Findings: We conducted a systematic review of literature published January 1, 1975 through December 11, 2017 that compared vaccination status at the child-level from at least two sources of vaccination history. 27 articles met inclusion criteria. The percentage point difference in coverage estimates varied substantially when comparing caregiver recall to HBRs (median: +1, range: -43 to +17), to health facility records (median: +5, range: -29 to +34) and to serology (median: -20, range: -32 to +2). Ranges were also wide comparing HBRs to facility-based records (median: +17, range: -61 to +21) and to serology (median: +2, range: -38 to +36). Across 10 studies comparing recall to HBRs, Kappa values exceeded 0.60 in 45% of comparisons; across 7 studies comparing recall to facility-based records, Kappa never reached 0.60. Agreement varied depending on study setting, coverage level, antigen type, number of doses, and child age. Conclusions: Recall and HBR provide relatively concordant vaccination histories in some settings, but both have poor agreement with facility-based records and serology. Long-term, improving clinical decision making and vaccination coverage estimates will depend on strengthening administrative systems and record keeping practices. Short-term, there must be greater recognition of imperfections across available vaccination history sources and explicit clarity regarding survey goals and the level of precision, potential biases, and associated resources needed to achieve these goals.
Keywords: LMIC; agreement; concordance; coverage; immunization; methodology; survey; vaccination; validity.
Copyright: © 2020 Dansereau E et al.
Conflict of interest statement
Competing interests: After completing this analysis and manuscript, ED was hired to work at the Gates Foundation.
Figures
References
-
- UNICEF: MICS6 Questionnaires and Modules.2016. Reference Source
-
- WHO: 2015 Working Draft - New WHO Vaccination Coverage Cluster Survey Manual.2015. Reference Source
-
- Demographic and Health Surveys (DHS): DHS Model Questionnaire - Phase 7.2015. Reference Source
Publication types
Grants and funding
LinkOut - more resources
Full Text Sources
Miscellaneous