. 2020 Jul 6;59(28):11591-11599.
doi: 10.1002/anie.202003560. Epub 2020 May 8.

Long-Lived Charge-Transfer State Induced by Spin-Orbit Charge Transfer Intersystem Crossing (SOCT-ISC) in a Compact Spiro Electron Donor/Acceptor Dyad

Affiliations

Long-Lived Charge-Transfer State Induced by Spin-Orbit Charge Transfer Intersystem Crossing (SOCT-ISC) in a Compact Spiro Electron Donor/Acceptor Dyad

Dongyi Liu et al. Angew Chem Int Ed Engl. .

Abstract

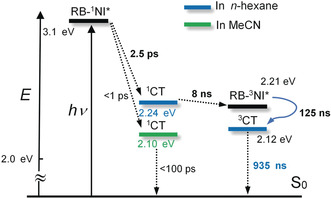
We prepared conceptually novel, fully rigid, spiro compact electron donor (Rhodamine B, lactam form, RB)/acceptor (naphthalimide; NI) orthogonal dyad to attain the long-lived triplet charge-transfer (3 CT) state, based on the electron spin control using spin-orbit charge transfer intersystem crossing (SOCT-ISC). Transient absorption (TA) spectra indicate the first charge separation (CS) takes place within 2.5 ps, subsequent SOCT-ISC takes 8 ns to produce the 3 NI* state. Then the slow secondary CS (125 ns) gives the long-lived 3 CT state (0.94 μs in deaerated n-hexane) with high energy level (ca. 2.12 eV). The cascade photophysical processes of the dyad upon photoexcitation are summarized as 1 NI*→1 CT→3 NI*→3 CT. With time-resolved electron paramagnetic resonance (TREPR) spectra, an EEEAAA electron-spin polarization pattern was observed for the naphthalimide-localized triplet state. Our spiro compact dyad structure and the electron spin-control approach is different to previous methods for which invoking transition-metal coordination or chromophores with intrinsic ISC ability is mandatory.

Keywords: charge transfer; electron spin control; intersystem crossing; time-resolved EPR; triplet state.


Conflict of interest statement

The authors declare no conflict of interest.

Figures

Figure 1
Figure 1
a) Molecular structures of rhodamine–naphthalimide derivatives and reference compounds. ORTEP view of the molecular structures determined with single‐crystal X‐ray diffraction of the compounds of b) RB‐NI and c) RB‐NI‐N; hydrogen atoms and solvents are omitted for clarity. The xanthene moieties are highlighted in pink and NI in yellow. Thermal ellipsoids are set at 50 % probability. CCDC numbers are given in the Supporting Information.
Figure 2
Figure 2
a) UV/Vis absorption spectra of the compounds in n‐hexane, c=1.0×10⁻⁵m. b) Fluorescence emission spectra (optically matched solutions were used, A=0.113, λ ex=320 nm) and c) the corresponding normalized fluorescence emission spectra of the compounds in n‐hexane, 20 °C. The asterisk in (c) indicate the Raman scattering peak of the solvent at 354 nm. d) Normalized phosphorescence spectra of the compounds RB‐NI (λ ex=340 nm), NI‐NH (λ ex=340 nm) and RB‐NI‐N (λ ex=425 nm) at 77 K, in mixed solvents of n‐hexane/iodoethane (4:1, v/v), c=5.0×10⁻⁵m.
Figure 3
Figure 3
Spectra of RB‐NI. a) Femtosecond transient absorption spectra, color code goes from red to blue covering the time interval from 0.5 ps to 1.5 ns, b) EADS obtained from global analysis and c) decay kinetics at 425 nm and 540 nm; spectra were recorded up to 1.5 ns, λ ex=400 nm, in deaerated toluene. d) Sub‐nanosecond transient absorption spectra, e) decay trace at 434 nm and f) species‐associated difference spectra (SADS) obtained from target analysis. λ ex=350 nm, in toluene. See text for details. g) Nanosecond transient absorption spectra and h) the subsequent decay of the ESA band at 425 nm at longer delay times. i) Evolution kinetics at 425 nm (derived from (g) and (h)); in deaerated n‐hexane, excited with nanosecond pulsed laser, λ ex=350 nm, c=4.0×10⁻⁵m, 20 °C.
Figure 4
Figure 4
a) Femtosecond transient absorption spectra of RB‐NI‐N, color code goes from red to blue covering the time interval from 0.5 ps to1.5 ns, b) EADS of RB‐NI‐N obtained from global analysis and c) decay kinetics at 501 nm and 560 nm; in deaerated toluene, 20 °C.
Figure 5
Figure 5
a) Nanosecond transient absorption spectra of RB‐NI‐N and b) decay trace of RB‐NI‐N at 485 nm. Excited with nanosecond laser at 427 nm, c=5.0×10⁻⁵m in deaerated n‐hexane; 20 °C.
Figure 6
Figure 6
a) TREPR spectra recorded at 80 K in frozen toluene/MeTHF solution, after pulsed laser excitation (355 nm for NI‐Br and RB‐NI, and 427 nm for RB‐NI‐N; the laser pulse length ca. 3–5 ns, 1.5 mJ per pulse; integration time window is 500–700 ns after the laser pulse). The red curves are simulations of the experimental TREPR spectra (black curves). b) TREPR spectra of RBNI in the liquid‐crystal E7 (the glass transition temperature is 210 K) recorded at different temperatures after pulsed laser excitation (355 nm, ca. 3–5 ns, 1.5 mJ per pulse).
Scheme 1
Scheme 1
Simplified Jablonski diagram illustrating the photophysical processes involved in RB‐NI. 1CT energy levels were calculated based on the electrochemical data and TDDFT computations. TDDFT calculations were performed at the B3LYP/6‐31G(d) level by using Gaussian 09W. The triplet excited state energy levels of RB‐NI were from the phosphorescence at 77 K.

References

    1. Koshiyama T., Shirai M., Hikage T., Tabe, Tanaka H. K., Kitagawa S., Ueno T., Angew. Chem. Int. Ed. 2011, 50, 4849–4852; - PubMed
    2. Angew. Chem. 2011, 123, 4951–4954.
    1. None
    1. Lim G. N., Obondi C. O., D'Souza F., Angew. Chem. Int. Ed. 2016, 55, 11517–11521; - PubMed
    2. Angew. Chem. 2016, 128, 11689–11693;
    1. Shao S., Thomas M. B., Park K. H., Mahaffey Z., Kim D., D'Souza F., Chem. Commun. 2018, 54, 54–57. - PubMed
    1. Ziessel R., Allen B. D., Rewinska D. B., Harriman A., Chem. Eur. J. 2009, 15, 7382–7393. - PubMed

LinkOut - more resources