

IκBα deficiency imposes a fetal phenotype to intestinal stem cells
- PMID: 32270911
- PMCID: PMC7271649
- DOI: 10.15252/embr.201949708
IκBα deficiency imposes a fetal phenotype to intestinal stem cells
Abstract
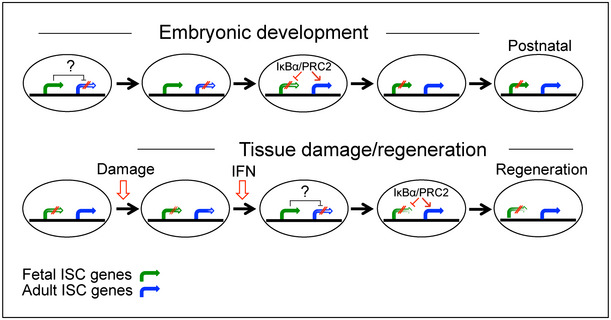
The intestinal epithelium is a paradigm of adult tissue in constant regeneration that is supported by intestinal stem cells (ISCs). The mechanisms regulating ISC homeostasis after injury are poorly understood. We previously demonstrated that IκBα, the main regulator of NF-κB, exerts alternative nuclear functions as cytokine sensor in a subset of PRC2-regulated genes. Here, we show that nuclear IκBα is present in the ISC compartment. Mice deficient for IκBα show altered intestinal cell differentiation with persistence of a fetal-like ISC phenotype, associated with aberrant PRC2 activity at specific loci. Moreover, IκBα-deficient intestinal cells produce morphologically aberrant organoids carrying a PRC2-dependent fetal-like transcriptional signature. DSS treatment, which induces acute damage in the colonic epithelium of mice, results in a temporary loss of nuclear P-IκBα and its subsequent accumulation in early CD44-positive regenerating areas. Importantly, IκBα-deficient mice show higher resistance to damage, likely due to the persistent fetal-like ISC phenotype. These results highlight intestinal IκBα as a chromatin sensor of inflammation in the ISC compartment.
Keywords: IκBα; fetal-like phenotype; intestinal stem cells; polycomb; regeneration.
© 2020 The Authors.
Conflict of interest statement
The authors declare that they have no conflict of interest.
Figures
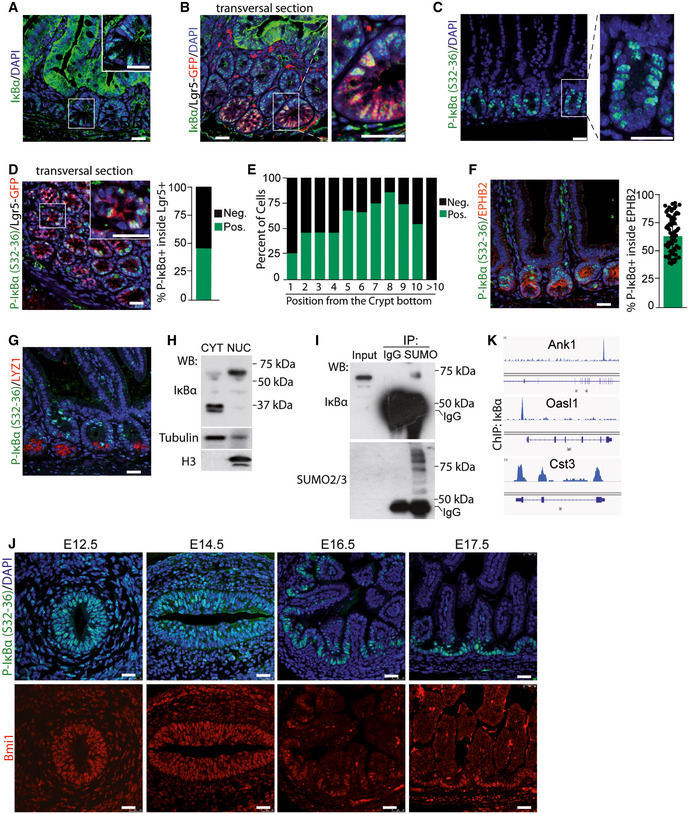
- A, B
Immunofluorescence (IF) analysis of IκBα in sections from murine small intestine of 2‐month‐old WT (A) and Lgr5‐GFP reporter mice (B). Scale bars, 50 μm.
- C, D
IF analysis of P‐IκBα in the intestine of 2‐month‐old WT (C) and Lgr5‐GFP reporter mice (D), and quantification of P‐IκBα positivity inside the Lgr5‐GFP population. A minimum of 30 crypts was counted in 3 Lgr5‐GFP mice. Scale bars in C, 25 μm and in D, 50 μm.
- E
Distribution of P‐IκBα‐positive cells according to their position in the intestinal crypt from 200 crypts counted.
- F
Double IF analysis of 2‐month‐old murine small intestine sections with the indicated antibodies and quantification of P‐IκBα positivity inside the EphB2+ population. Seventy crypts were counted. Bars represent mean values ± standard error of the mean (s.e.m.). Scale bars, 50 μm.
- G
Double IF analysis of murine small intestine sections with the indicated antibodies. Scale bars, 50 μm.
- H
Western blot analysis of cytoplasmic (CYT) and nuclear (NUC) extracts from isolated intestinal crypt cells.
- I
Western blot analysis of crypt nuclear extracts immunoprecipitated with anti‐SUMO2/3 antibody.
- J
IF analysis of developing intestines from E12.5 to E17.5 with the indicated antibodies. Scale bars, 25 μm.
- K
Representation of IκBα distribution in the indicated genomic regions obtained from ChIP‐sequencing analysis (n = 4).
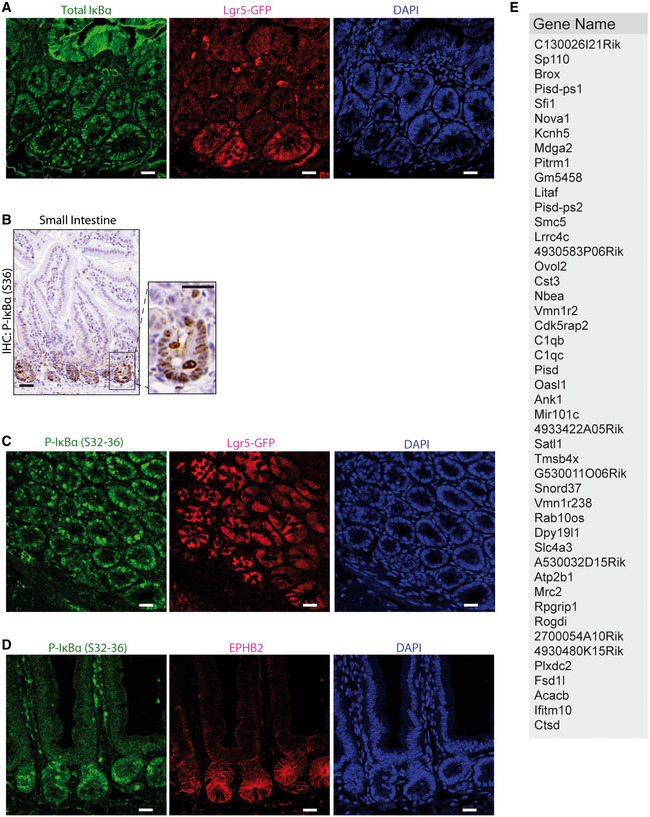
- A
IHC analysis of P‐IκBα (S36) in intestinal mouse sections.
- B–D
IF analysis in sections from murine small intestine of 2‐month‐old Lgr5‐GFP reporter mice (B and C) and WT mice (D).
- E
Table indicating the genes identified in IκBα ChIP‐sequencing of P6 WT intestinal cells with P.adj < 0.05. n = 4 2‐month‐old WT mice were analyzed.
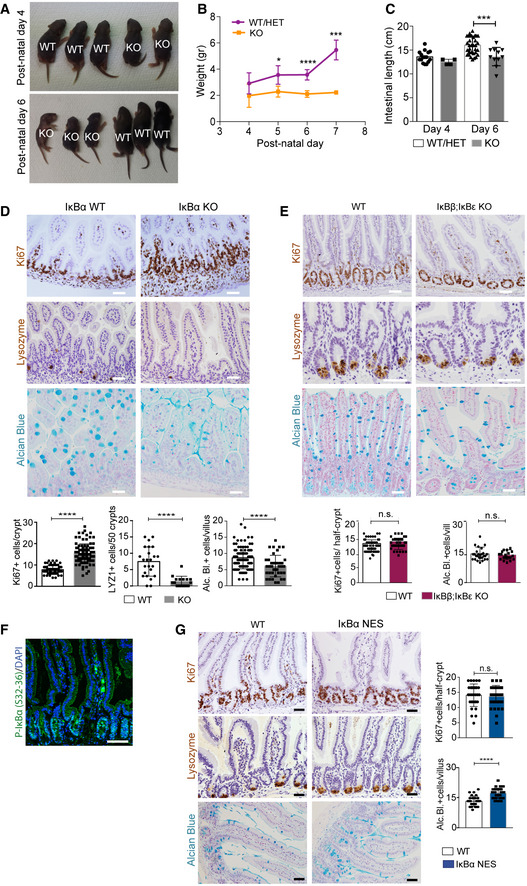
- A
Representative images of P4 and P6 mice of the indicated IκBα genotypes.
- B, C
Quantification of the animal weight (B) and intestinal length (C) from 50 WT/HET and 15 KO mice analyzed.
- D–G
Immunohistochemical (IHC), IF, and Alcian Blue staining with quantification of P6 IκBα WT and KO intestines (D), 2‐month‐old IκBβ;IκBε KO (E), and 2‐month‐old IκBαNES mice (F and G). A minimum of 50 crypts/villus was counted per genotype (3 mice).
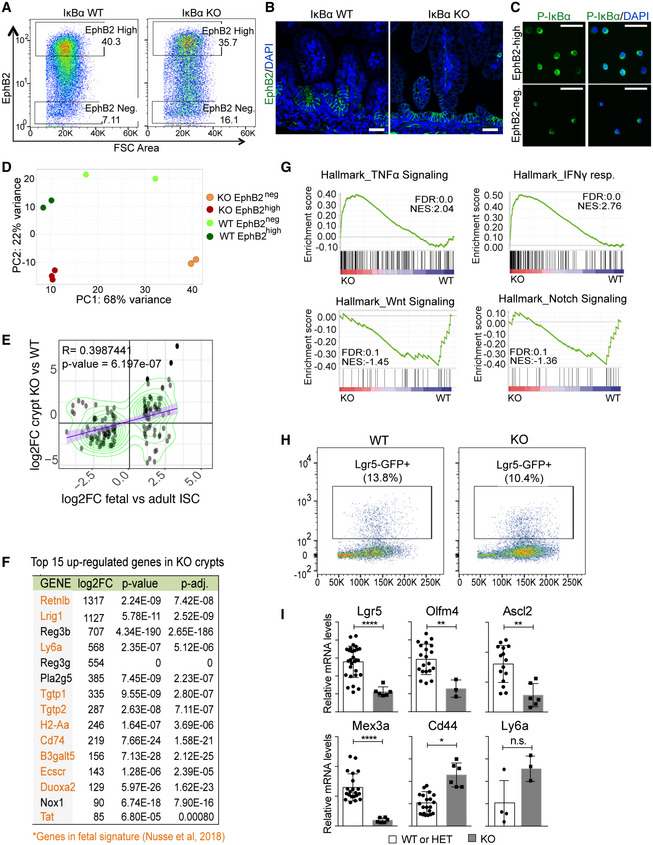
Representative image of the intestinal populations purified in the cell sorting experiments.
IF analysis of EphB2 in P6 WT and IκBα KO intestine.
P‐IκBα IF of EphB2‐high or EphB2‐negative sorted cells.
Clustering analysis of the indicated cell populations based on their transcriptional profiles obtained in RNA‐seq. Three mice per genotype were initially processed although 1 EphB2neg KO replicate was excluded from the analysis due to insufficient number of reads in the RNA‐seq.
Correlation plot of the indicated differentially expressed gene (DEG) sets. Values for DEG in fetal and adult ISC were obtained from Nusse et al (2018).
Table indicating the top 15 up‐regulated genes in the IκBα KO EphB2‐high signature including 11 genes in the fetal ISC signature (in orange).
GSEA of EphB2‐high cells indicating the enrichment of relevant ISC‐related pathways.
Representative image of the Lgr5+ population purified in the cell sorting experiments.
qPCR analysis of the indicated genes in purified Lgr5+ cells from the different IκBα backgrounds. Four WT and 1 KO mice were analyzed with at least three technical replicates. Bars represent mean values ± standard error of the mean (s.e.m.). P values were derived from an unpaired t‐test, two‐tailed, ****P‐value < 0.0001, **P‐value < 0.005, *P‐value < 0.05; n.s.: no significant.
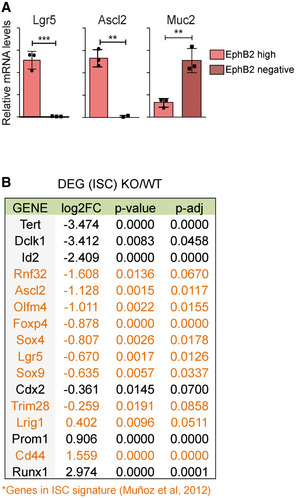
qPCR analysis of EphB2‐high and EphB2‐negative sorted cells from P6 WT intestine. Three technical replicates were analyzed. Bars represent mean values ± standard error of the mean (s.e.m.); P values were derived from an unpaired t‐test, two‐tailed, ***P‐value < 0.0005, **P‐value < 0.005.
Table indicating the ISC genes differentially expressed between IκBα WT and KO EphB2‐high sorted cells (RNA‐seq, n = 3 WT and n = 3 KO), including genes of ISC signature 43 (in orange).
- A
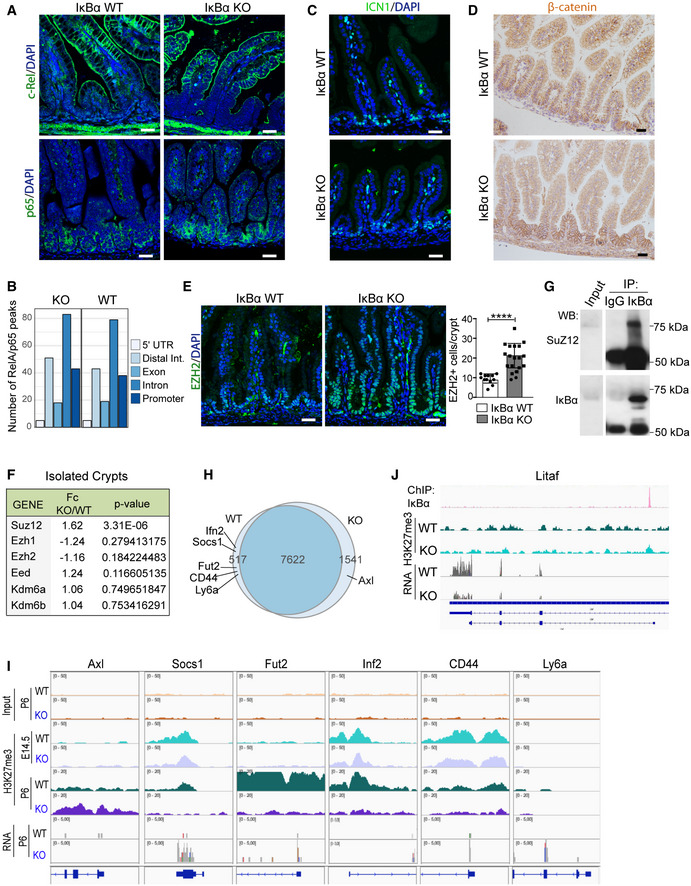
IF analysis of c‐Rel and RelA/p65 in P6 WT and IκBα KO intestines.
- B
Number of peaks from p65 ChIP‐sequencing analysis associated with the different genomic localizations was obtained merging two biological replicates per condition (n = 2 P6 WT and n = 2 P6 IκBα KO intestinal crypt cells). Data from individual experiments have been deposited at GSE131187.
- C, D
IF analysis of active Notch1 (ICN1) (C) and β‐catenin (D) in the indicated IκBα backgrounds at P6 intestines.
- E
IF analysis of the PRC2 protein EZH2 and quantification of the EZH2‐positive cells per crypt in n = 3 P6 animals per genotype were analyzed (a minimum of 15 crypts was counted per genotype). Bars represent mean values ± standard error of the mean (s.e.m.); P values were derived from an unpaired t‐test, two‐tailed, ****P‐value < 0.0001.
- F
Table indicating the methylation‐related genes (PRC2 members and KDM6 demethylase) differentially expressed between IκBα WT and KO EphB2‐high sorted cells (RNA‐seq).
- G
Western blot analysis of IκBα IP from crypt nuclear extracts.
- H
Venn diagram representing the distribution of genes detected as differentially methylated in the H3K27me3 ChIP‐sequencing analysis across P6 IκBα genotypes (n = 2 WT and n = 2 KO mice).
- I
Representation of H3K27me3 distribution at embryonic E14.5 (n = 2 WT and n = 2 KO mice) and postnatal P6 (n = 2 WT and n = 2 KO mice) (from ChIP‐sequencing) and expression levels (from RNA‐sequencing) in the genomic region of the indicated fetal ISC genes.
- J
Representation of IκBα (n = 4) and H3K27me3 (n = 2) distribution (from ChIP‐sequencing) and expression levels (from RNA‐sequencing) in the genomic region of Litaf.
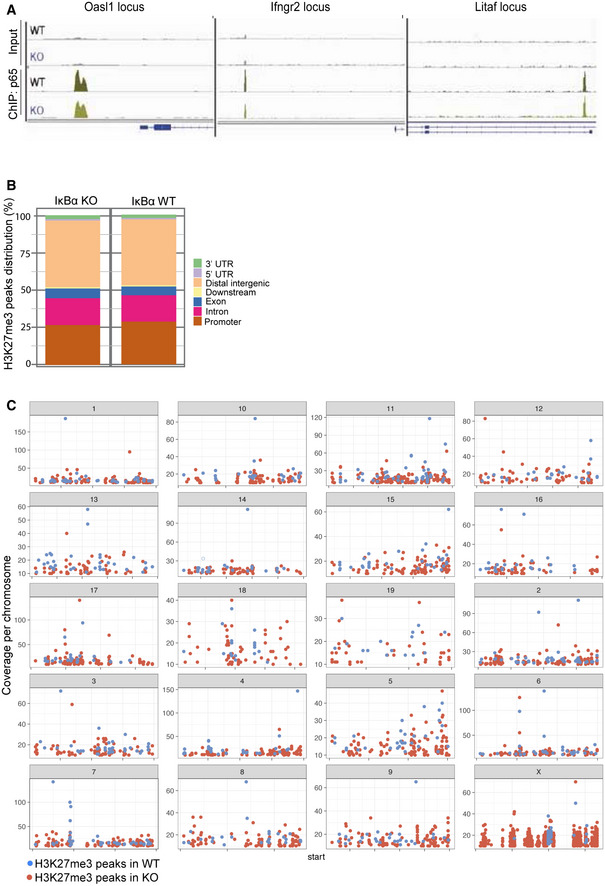
Representation of p65 distribution (from ChIP‐sequencing, n = 2 WT and n = 2 KO) in the indicated genomic regions.
Graph showing the distribution of H3K27me3 peaks in the indicated genomic locations in IκBα WT and IκBα KO.
Graph showing the chromosomal distribution of H3K27me3 peaks in IκBα WT and IκBα KO.
- A
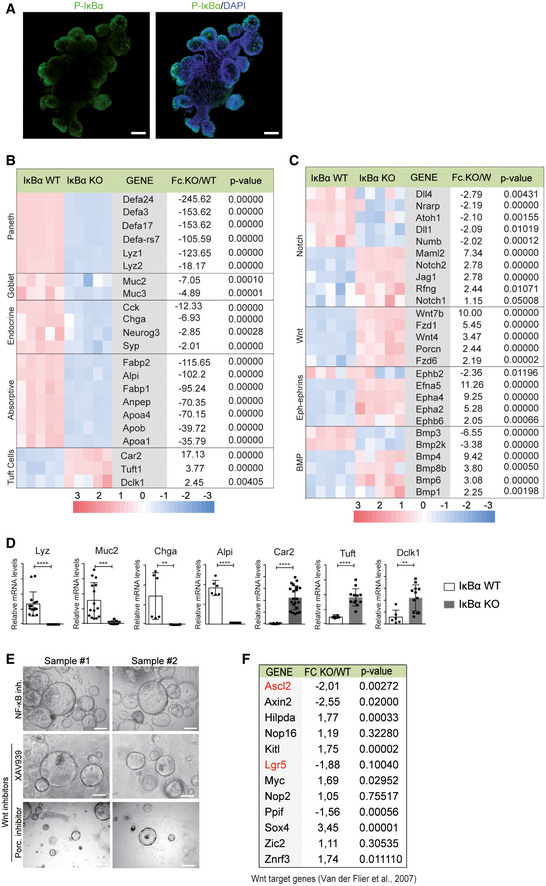
IF analysis of P‐IκBα in WT organoids.
- B, C
Selection of differentially expressed genes associated with intestinal lineages (B) and molecular pathways (C) identified by microarray assay from WT and IκBα KO‐derived organoids. Five different organoids per genotype were analyzed, which were generated from at least 2 different mice per genotype.
- D
Validation of relevant genes by qPCR. Three technical replicates of a minimum of two organoids per condition were analyzed. Bars represent mean values ± standard error of the mean (s.e.m.); P values were derived from an unpaired t‐test, two‐tailed, ****P‐value < 0.0001, ***P‐value < 0.0005, **P‐value < 0.005.
- E
Representative stereoscopic images of IκBα KO organoids treated as indicated.
- F
Table indicating the Wnt/β‐catenin target genes 44 differentially expressed between IκBα WT and KO organoids (expression microarray, n = 5 WT and n = 5 KO). In red, Wnt target ISC genes.
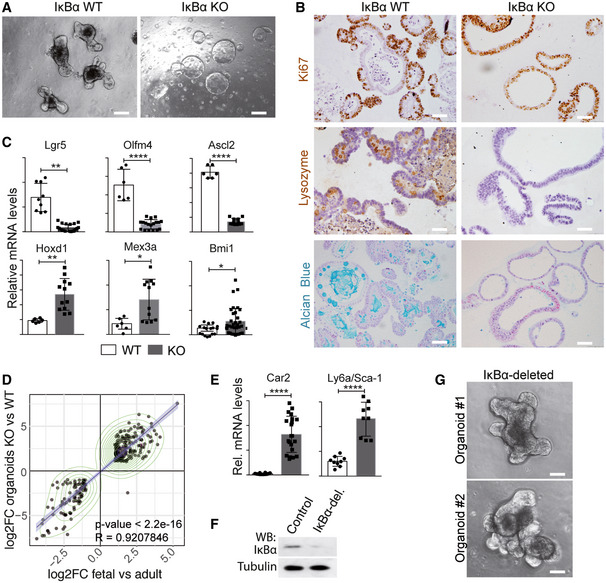
Representative stereoscopic images of P6 WT and IκBα KO‐derived intestinal organoids.
IHC analysis with the indicated antibodies and Alcian Blue staining of WT and IκBα KO‐derived organoids.
qPCR analysis of the indicated ISC genes in WT and IκBα KO‐derived organoids.
Correlation plots of the indicated differentially expressed gene (DEG) sets obtained in expression microarray (5 technical replicates of a minimum of two organoids per genotype were analyzed). Values for DEG in fetal and adult organoids were obtained from 23.
qPCR analysis of the indicated fetal genes in WT and IκBα KO‐derived organoids.
Western blot analysis of control and IκBα‐deleted organoids using CRISPR‐Cas9 technology.
Representative stereoscopic images of WT and IκBα‐deleted organoids.
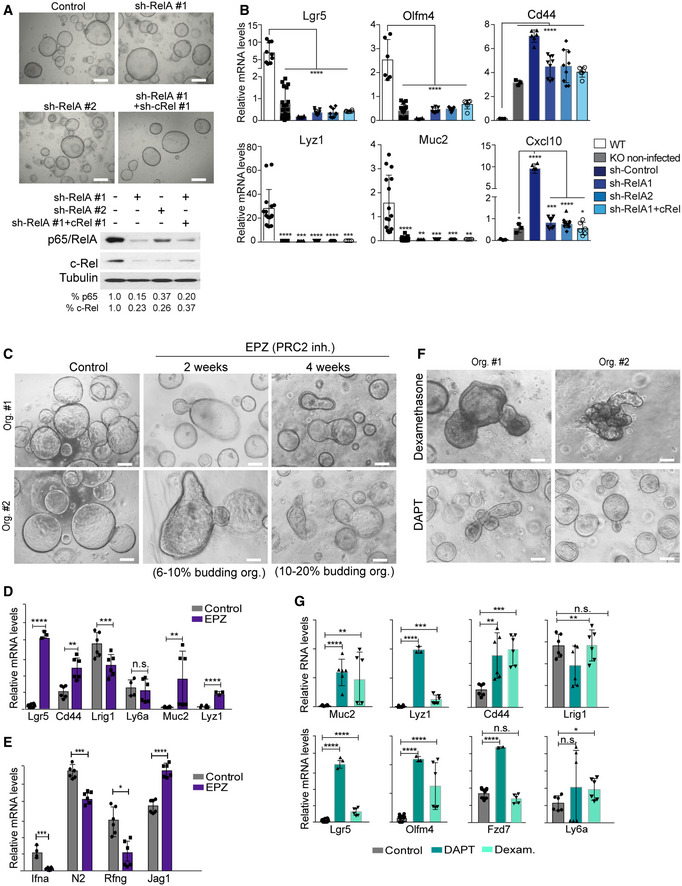
- A
Representative stereoscopic images and Western blot analysis of IκBα KO organoids infected with the indicated shRNA for NF‐κB elements.
- B
qPCR analysis of the indicated ISC and differentiation genes in the different shRNA‐treated organoids. The canonical NF‐κB target gene Cxcl10 is shown as positive control of the experiment.
- C
Representative stereoscopic images of IκBα KO organoids untreated or treated with the PRC2 inhibitor EPZ‐6438.
- D, E
qPCR analysis of the indicated adult and fetal ISC genes (D) and elements of the Notch and IFN pathways (E) (differentially expressed in IκBα KO organoids) in IκBα KO organoids untreated or treated with the PRC2 inhibitor EPZ‐6438.
- F
Representative stereoscopic images of IκBα KO organoids treated with dexamethasone as IFN inhibitor and DAPT as Notch inhibitor.
- G
qPCR analysis of IκBα KO organoids untreated or treated with dexamethasone and DAPT.
- A
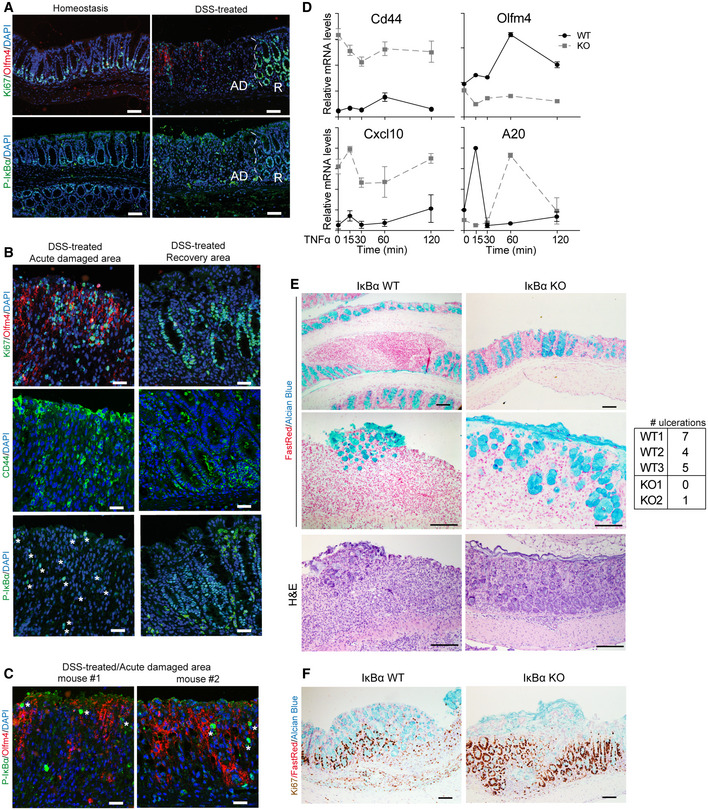
IF analysis of colonic tissue from control and DSS‐treated animals including acute damaged (AD) areas and recovery (R) areas.
- B, C
IF analysis of P‐IκBα and the indicated markers in the areas of acute damage and recovery (B) and colocalization of P‐IκBα with the ISC marker Olfm4 in acute damaged areas (C). Asterisks indicate the presence of rare cells with nuclear P‐IκBα.
- D
qPCR analysis of the indicated genes in WT and IκBα KO organoids treated with TNFα and collected at the indicated time‐points. Three technical replicates of organoids from each genotype were analyzed.
- E, F
Representative images of the colonic tissue from 2‐month‐old DSS‐treated WT and IκBα KO mice are shown. Alcian Blue staining was used to identify the mucus‐secreting goblet cells in the colonic glands and Ki67 as proliferation marker. Nuclear counterstain is Fast Red. The table shows number of ulcerations present in the intestines of mice analyzed (3 WT, 2 IκBα KO).
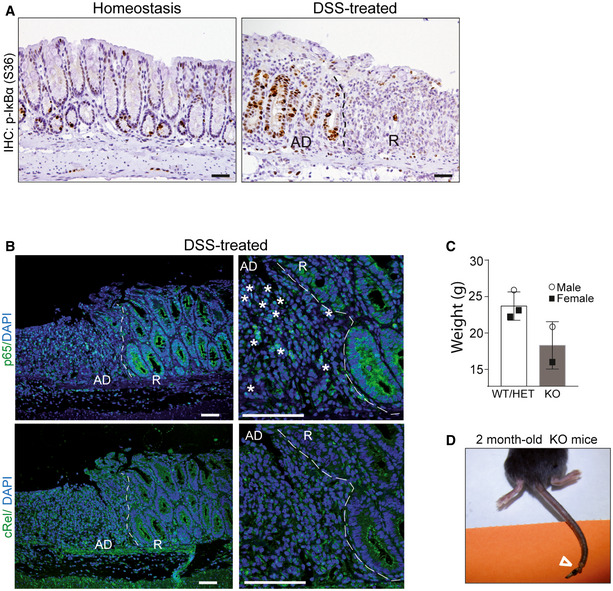
- A
IHC analysis of P‐IκBα (S36) in the colonic tissue of control and DSS‐treated mice including acute damaged (AD) areas and recovery (R) areas.
- B
IF analysis of the NF‐κB subunits p65/RelA and c‐Rel in areas of acute damage and recovery. Asterisks indicate the presence of nuclear p65 in acute damage areas adjacent to the recovery region. The pictures show acute damaged (AD) areas and recovery (R) areas.
- C, D
Graph indicating the reduced weight (A) and representative image of the skin defects (see arrowhead) (D) observed in the 2‐month‐old IκBα KO mice. Bars represent mean values ± standard error of the mean (s.e.m.).
References
-
- Hoffmann J, Akira S (2013) Innate immunity. Curr Opin Immunol 25: 1–3 - PubMed
-
- Arenzana‐Seisdedos F, Turpin P, Rodriguez M, Thomas D, Hay RT, Virelizier JL, Dargemont C (1997) Nuclear localization of I kappa B alpha promotes active transport of NF‐kappa B from the nucleus to the cytoplasm. J Cell Sci 110(Pt 3): 369–378 - PubMed
-
- Sun SC, Ganchi PA, Ballard DW, Greene WC (1993) NF‐kappa B controls expression of inhibitor I kappa B alpha: evidence for an inducible autoregulatory pathway. Science 259: 1912–1915 - PubMed
Publication types
MeSH terms
Substances
Associated data
- Actions
- Actions
Grants and funding
- PIE15/00008/MEC | Instituto de Salud Carlos III (ISCIII)/International
- PI16/00437/MEC | Instituto de Salud Carlos III (ISCIII)/International
- 2017SGR135/Generalitat de Catalunya (Government of Catalonia)/International
- 2015FI-B00806/Government of Catalonia |Agència de Gestió d'Ajuts Universitaris i de Recerca (AGAUR)/International
- 2016FI-B1 00110/Government of Catalonia |Agència de Gestió d'Ajuts Universitaris i de Recerca (AGAUR)/International
LinkOut - more resources
Full Text Sources
Medical
Molecular Biology Databases
Miscellaneous
