

Randomized Controlled Trial
doi: 10.1097/RTI.0000000000000516.
Integrated Radiologic Algorithm for COVID-19 Pandemic
Affiliations
- PMID: 32271278
- PMCID: PMC7253044
- DOI: 10.1097/RTI.0000000000000516
Item in Clipboard
Randomized Controlled Trial
Integrated Radiologic Algorithm for COVID-19 Pandemic
J Thorac Imaging.
2020 Jul.
No abstract available
Conflict of interest statement
The authors declare no conflicts of interest.
Figures
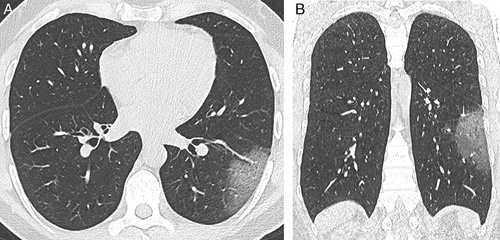
CT image in axial (A) and coronal (B) planes showing pure ground-glass opacity in the superior segment of the left lower lobe. This finding might be extremely subtle on radiography or even overlooked (especially with suboptimal quality of radiography, for instance anteroposterior projection). Of note, COVID-19-related abnormalities may be asymmetrical in distribution, making radiography diagnosis even more uncertain.
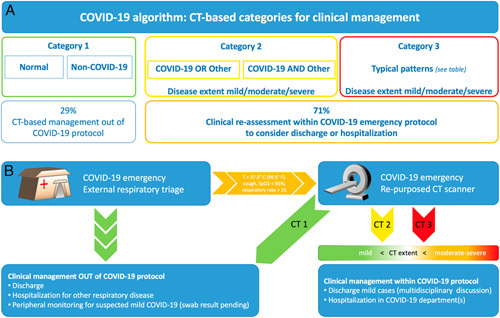
Flowchart A, CT diagnostic categories in the COVID-19 protocol. Radiologic integrated contribution is established with 3 major categories that specifically refer to COVID-19: category 1 (green border) encompasses both normal CT and CT with signs of exclusive non-COVID-19 disease; category 2 (yellow border) is meant as indeterminate category that includes 2 main complex scenarios with COVID-19 as alternative or overlapping disease; category 3 encompasses typical patterns recently associated with COVID-19. Both category 2 and 3 are also scored with a CT severity index for description of disease extent, in the attempt of assisting clinicians with the most complete information. Bottom boxes show the proportion of subjects who are discarded from the COVID-19 protocol on the basis of integrated radiologic algorithm (29%), thus reducing the number of patients who are kept in COVID-19 protocol for further clinical assessment. Flowchart B, Integrated COVID-19 protocol with flowchart showing the patient path from the admission to the respiratory triage, selection of those who are to undergo radiology integration based on clinical parameters, CT assessment based on the 3 defined radiologic categories of COVID-19 protocol, and subsequent clinical assessment for appropriate hospitalization or tentative discharge.
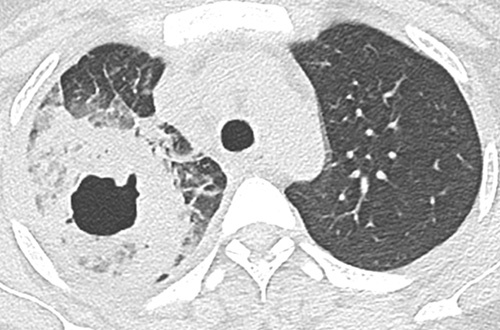
Axial CT image of a clearly different diagnosis, namely cavitary consolidation in the right upper lobe in a patient presenting at the respiratory triage during this COVID-19 epidemic.
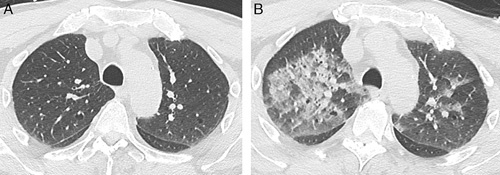
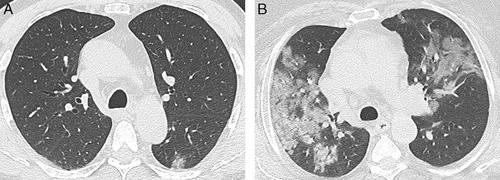
Temporal evolution in a patient presenting with respiratory symptoms on March 5, showing negative CT for COVID-19 (A) and negative swab, then returning to respiratory triage 7 days later with onset of typical CT pattern of COVID-19 with bilateral part-solid opacities (B) confirmed by a positive swab a further 2 days later.
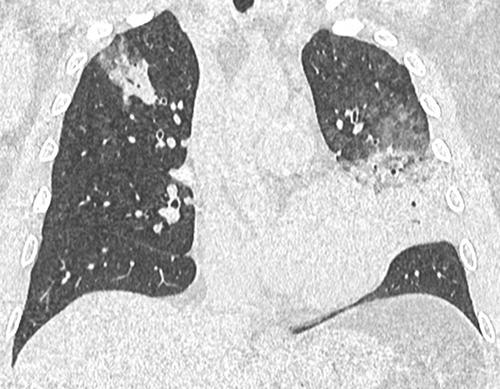
Coronal reformation of CT image showing multifocal opacities with ground-glass and consolidative component, with some perilobular distribution. Prospective reporting was category 2, including the potential diagnosis of bacterial pneumonia or COVID-19. Two days after CT, the swab was positive for SARS-CoV-2.
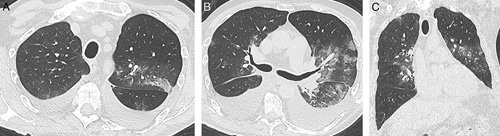
CT image in axial (A, B) and coronal (C) plane showing ground-glass opacities with heterogeneous distribution on axial plane (both central and subpleural), as well as some perilobular distribution, associated with massive bilateral pleural effusion. Prospective reporting was category 2 for potential overlapping of COVID-19 and supervening heart failure. One day after CT, the swab was positive, and heart failure was confirmed by evolution after diuretic therapy. Noteworthy, we observed elderly and cardiopathic patients displaying overlapping of COVID-19 and heart failure with potential overlapping of ground-glass opacities from infection and edema.
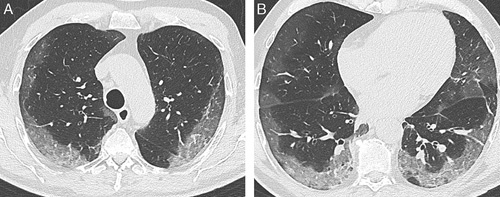
A and B, Axial CT images showing large ground-glass opacities mostly distributed in subpleural regions, with severe extent involving all lobes. These CT findings are recognized among the range of typical CT patterns for COVID-19.
A and B, Axial CT images showing multifocal parenchymal opacities with both ground-glass component and consolidation, notably with perilobular distribution and signs of distortion suggesting organizing pneumonia.
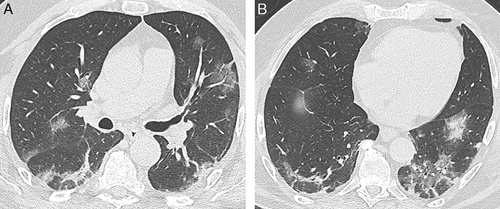
Axial CT images showing mild (A) and moderate/severe (B) extent of pulmonary involvement in patients admitted to COVID-19 protocol, later confirmed with positive swab for SARS-CoV-2. Noteworthy, differentiating between mild and moderate/severe (Table 1) might be relevant to assist integrated clinical management. Otherwise, the difference between moderate and severe extent is subjective and is not meant to influence the decision about hospitalization (Table 1).
References
-
- Gates B. Responding to Covid-19—a once-in-a-century pandemic? N Engl J Med. 2020. [Epub ahead of print]. - PubMed
-
- Italian Ministry of Health. COVID-19 facts; March 15, 2020. Available at: www.salute.gov.it/portale/nuovocoronavirus/dettaglioContenutiNuovoCorona.... Accessed March 15, 2020.
Publication types
MeSH terms
LinkOut - more resources
Full Text Sources
