New Insights into Folding, Misfolding, and Nonfolding Dynamics of a WW Domain
- PMID: 32271570
- PMCID: PMC7228858
- DOI: 10.1021/acs.jpcb.0c00628
New Insights into Folding, Misfolding, and Nonfolding Dynamics of a WW Domain
Abstract
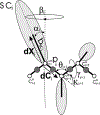
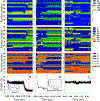
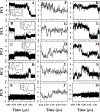
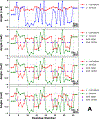
Intermediate states in protein folding are associated with formation of amyloid fibrils, which are responsible for a number of neurodegenerative diseases. Therefore, prevention of the aggregation of folding intermediates is one of the most important problems to overcome. Recently, we studied the origins and prevention of formation of intermediate states with the example of the Formin binding protein 28 (FBP28) WW domain. We demonstrated that the replacement of Leu26 by Asp26 or Trp26 (in ∼15% of the folding trajectories) can alter the folding scenario from three-state folding, a major folding scenario for the FBP28 WW domain (WT) and its mutants, toward two-state or downhill folding at temperatures below the melting point. Here, for a better understanding of the physics of the formation/elimination of intermediates, (i) the dynamics and energetics of formation of β-strands in folding, misfolding, and nonfolding trajectories of these mutants (L26D and L26W) is investigated; (ii) the experimental structures of WT, L26D, and L26W are analyzed in terms of a kink (heteroclinic standing wave solution) of a generalized discrete nonlinear Schrödinger equation. We show that the formation of each β-strand in folding trajectories is accompanied by the emergence of kinks in internal coordinate space as well as a decrease in local free energy. In particular, the decrease in downhill folding trajectory is ∼7 kcal/mol, while it varies between 31 and 48 kcal/mol for the three-state folding trajectory. The kink analyses of the experimental structures give new insights into formation of intermediates, which may become a useful tool for preventing aggregation.
Conflict of interest statement
The authors declare no competing financial interest.
Figures






Similar articles
-
Preventing fibril formation of a protein by selective mutation.Proc Natl Acad Sci U S A. 2015 Nov 3;112(44):13549-54. doi: 10.1073/pnas.1518298112. Epub 2015 Oct 19. Proc Natl Acad Sci U S A. 2015. PMID: 26483482 Free PMC article.
-
Eliminating a Protein Folding Intermediate by Tuning a Local Hydrophobic Contact.J Phys Chem B. 2017 Apr 20;121(15):3276-3284. doi: 10.1021/acs.jpcb.6b07250. Epub 2016 Sep 29. J Phys Chem B. 2017. PMID: 27584585
-
Effects of mutation, truncation, and temperature on the folding kinetics of a WW domain.J Mol Biol. 2012 Jul 20;420(4-5):350-65. doi: 10.1016/j.jmb.2012.04.027. Epub 2012 May 2. J Mol Biol. 2012. PMID: 22560992 Free PMC article.
-
Metastable, partially folded states in the productive folding and in the misfolding and amyloid aggregation of proteins.Cell Biochem Biophys. 2006;44(3):539-48. doi: 10.1385/CBB:44:3:539. Cell Biochem Biophys. 2006. PMID: 16679542 Review.
-
Distinct role of hydration water in protein misfolding and aggregation revealed by fluctuating thermodynamics analysis.Acc Chem Res. 2015 Apr 21;48(4):956-65. doi: 10.1021/acs.accounts.5b00032. Epub 2015 Apr 6. Acc Chem Res. 2015. PMID: 25844814 Review.
Cited by
-
Investigation of Phosphorylation-Induced Folding of an Intrinsically Disordered Protein by Coarse-Grained Molecular Dynamics.J Chem Theory Comput. 2021 May 11;17(5):3203-3220. doi: 10.1021/acs.jctc.1c00155. Epub 2021 Apr 28. J Chem Theory Comput. 2021. PMID: 33909430 Free PMC article.
-
Exploring Structural Flexibility and Stability of α-Synuclein by the Landau-Ginzburg-Wilson Approach.J Phys Chem B. 2022 Sep 15;126(36):6878-6890. doi: 10.1021/acs.jpcb.2c04651. Epub 2022 Sep 2. J Phys Chem B. 2022. PMID: 36053833 Free PMC article.
References
-
- Privalov PL; Khechinashvili NN A thermodynamic approach to the problem of stabilization of globular protein structure: A calorimetric study. J. Mol. Biol 1974, 86, 665–684. - PubMed
-
- Thirumalai D From minimal models to real proteins: Time scales for protein folding kinetics. J. Phys. I France 1995, 5, 1457–1467.
-
- Akmal A; Munoz V The nature of the free energy barriers to two-state folding. Proteins 2004, 57, 142–152. - PubMed
-
- Garcia-Mira MM; Sadqi M; Fischer N; Sanchez-Ruiz JM; Munoz V Experimental identification of downhill protein folding. Science 2002, 298, 2191–2195. - PubMed
Publication types
MeSH terms
Substances
Grants and funding
LinkOut - more resources
Full Text Sources

