. 2020 May 13;20(5):3819-3827.
doi: 10.1021/acs.nanolett.0c00877. Epub 2020 Apr 13.

Electro-Osmotic Vortices Promote the Capture of Folded Proteins by PlyAB Nanopores

Affiliations

Electro-Osmotic Vortices Promote the Capture of Folded Proteins by PlyAB Nanopores

Gang Huang et al. Nano Lett. .

Abstract

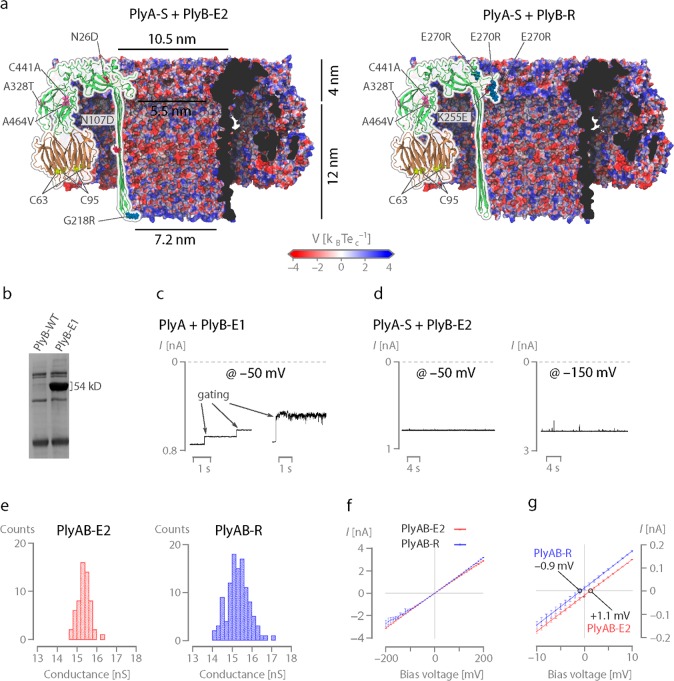
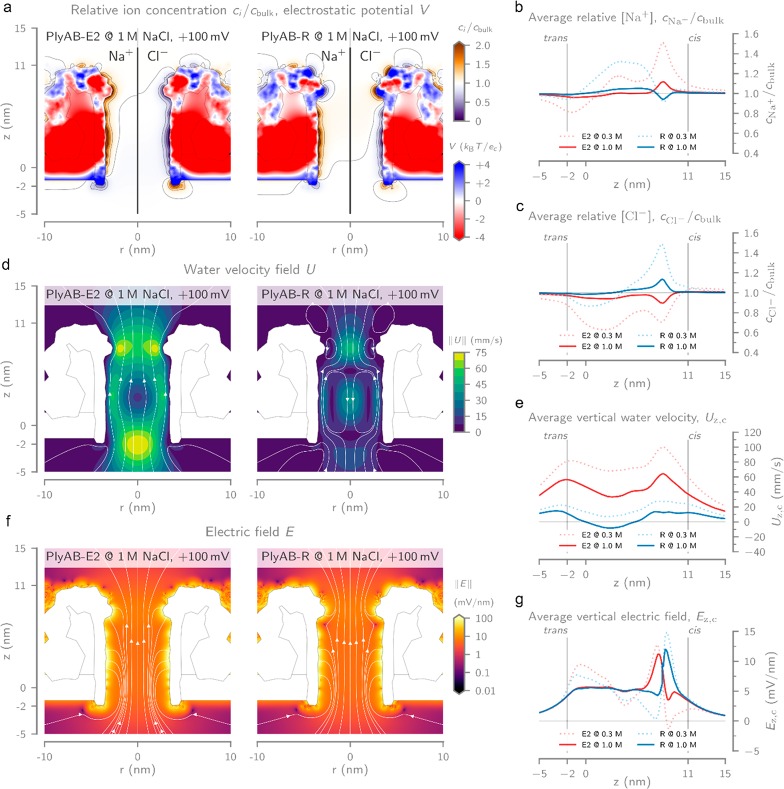
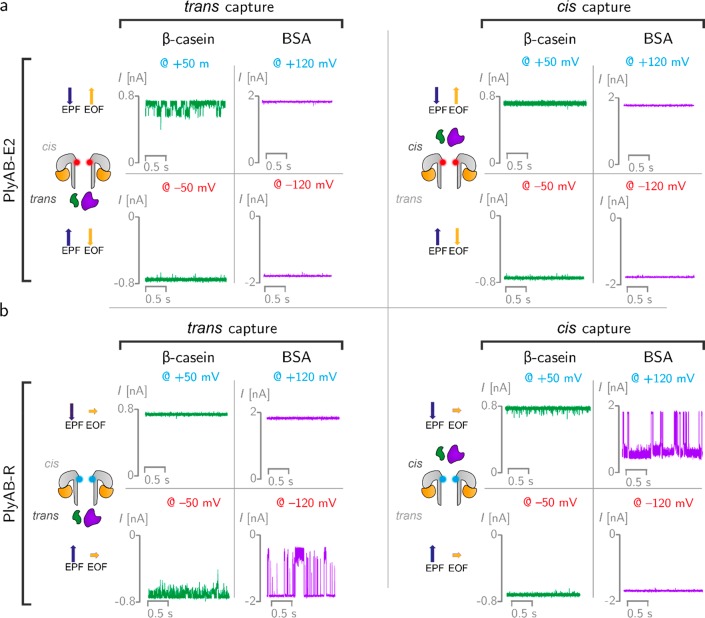
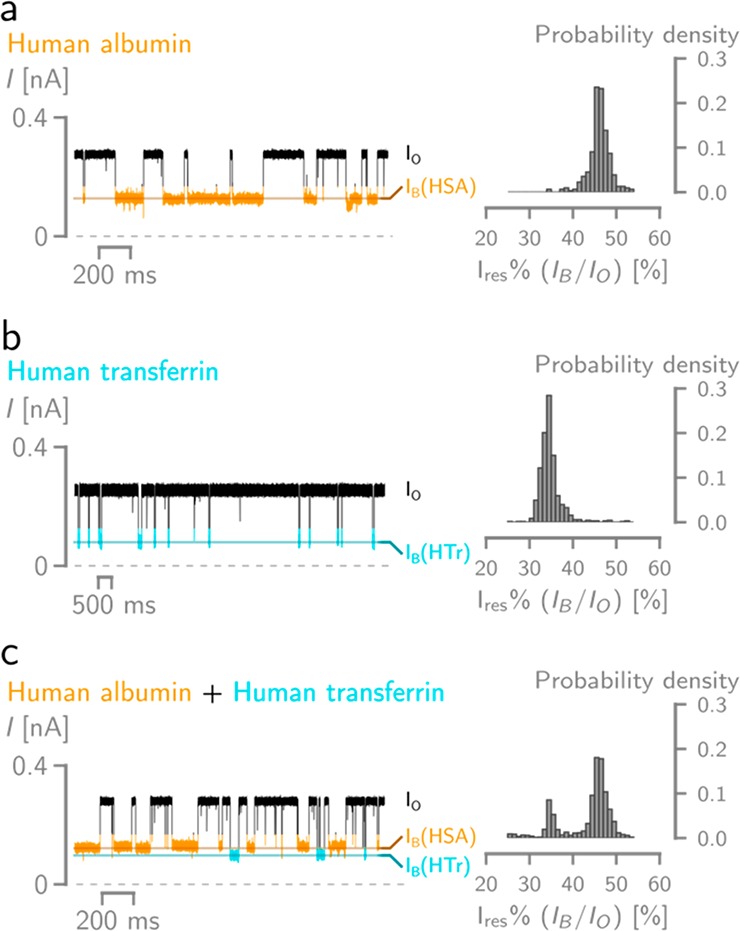
Biological nanopores are emerging as powerful tools for single-molecule analysis and sequencing. Here, we engineered the two-component pleurotolysin (PlyAB) toxin to assemble into 7.2 × 10.5 nm cylindrical nanopores with a low level of electrical noise in lipid bilayers, and we addressed the nanofluidic properties of the nanopore by continuum simulations. Surprisingly, proteins such as human albumin (66.5 kDa) and human transferrin (76-81 kDa) did not enter the nanopore. We found that the precise engineering of the inner surface charge of the PlyAB induced electro-osmotic vortices that allowed the electrophoretic capture of the proteins. Once inside the nanopore, two human plasma proteins could be distinguished by the characteristics of their current blockades. This fundamental understanding of the nanofluidic properties of nanopores provides a practical method to promote the capture and analysis of folded proteins by nanopores.

Keywords: biological nanopore; electro-osmosis; nanofluidics; plasma proteins; single-molecule sensing.


Conflict of interest statement

The authors declare no competing financial interest.

Figures

Figure 1
Figure 1
Engineering of PlyAB nanopores. (a) Cut through of the surfaces of PlyAB-E2 (left) and PlyA-R (right) nanopores with the mutations relative to the wild type shown as spheres on top of the overlaying cartoon representation. The surface is colored according to the electrostatic potential at 1 M salt, as computed by the adaptive Poisson–Boltzmann solver (APBS). (b) 12% sodium dodecyl sulfate–polyacrylamide gel electrophoresis of PlyB-WT and PlyB-E1 monomers. (c) Typical gating events for PlyAB-E1 nanopores under −50 mV applied bias. (d) 30 s open pore traces of PlyAB-E2 nanopores at −50 and −150 mV bias potentials. (e) Single channel distributions of PlyAB-E2 and PlyAB-R in 1 M NaCl at pH 7.5. (f) IV curves of PlyAB-E2 and PlyAB-R collected in 1 M NaCl at pH 7.5. (g) Reversal potentials (Vr) measured for the PlyAB-E2 and PlyAB-R at pH 7.5, which correspond with the ion selectivities of 1.07 ± 0.02 and −0.94 ± 0.04, respectively (eq S1, Table S4). The ionic concentration was 500 mM NaCl in trans and 2 M NaCl in cis. Solutions were buffered with 15 mM Tris–HCl (pH 7.5). Error bars represent the standard deviations calculated from a minimum of three repeats.
Figure 2
Figure 2
Computational modeling of PlyAB at +100 mV bias voltage and in 1 M NaCl. (a) Heatmaps of the relative Na+ and Cl ion concentrations (ci/cbulk) inside PlyAB-E2 (left) and PlyAB-R (right). The coloring inside the pore represents the computed electric potential (V), expressed as units of thermal voltage. The geometry of the pore and bilayer is shown as a gray outline. Radially averaged ion concentrations for (b) Na+ and (c) Cl inside PlyAB for both the E2 and R variants at reservoir ionic strengths of 0.3 and 1.0 M NaCl. Values were computed by averaging the concentration within 2.5 nm distance from the longitudinal axis or the pore. (d) Contour plots of the electro-osmotic flow velocity field magnitude (U) of PlyAB-E2 (left) and PlyAB-R (right). The white field lines indicate the direction of the flow and reveal the existence of vortices in the cis and trans chambers of PlyAB-R. (e) Radially averaged vertical water velocity (Uz,c, computed as in part b) at reservoir ionic strengths of 0.3 and 1.0 M NaCl. (f) Heatmap with streamlines showing the electric field vector magnitude (E) and its directionality inside the electrolyte for PlyAB-E2 (left) and PlyAB-R (right). The electric field inside the pore and bilayer is not shown for clarity. (g) Average vertical electrical field (Ez,c) inside both PlyAB variants at reservoir ionic strengths of 0.3 and 1.0 M NaCl. All values were obtained with 2D-axisymmetric models of PlyAB-E2 and PlyAB-R by solving the extended Poisson–Nernst–Planck Navier–Stokes (ePNP-NS) equations, implemented in the software package COMSOL Multiphysics, using the finite element method. Detailed information can be found in the Supporting Information.
Figure 3
Figure 3
Protein capture with PlyAB nanopores in 1 M NaCl at pH 7.5. (a) β-casein (24 kDa, pI 5.1) and bovine serum albumin (BSA, 66.5 kDa, pI 4.7) were measured with PlyAB-E2 nanopores. The PlyAB-E2 constriction is negatively charged and shown in red in the cartoon. β-Casein (green) and BSA (purple) were added to the trans and cis sides separately and tested by applying both positive and negative biases to the trans side. The direction of electrophoretic force (EPF) and electro-osmotic flow (EOF) are shown with blue and yellow arrows, respectively. (b) β-Casein and BSA were also measured with PlyAB-R nanopores (cyan constriction) from both sides. Recordings were collected with a 50 kHz sampling rate and a 10 kHz low-pass Bessel filter.
Figure 4
Figure 4
Electrical recordings of human albumin (HSA) and transferrin (HTr) using PlyAB-R nanopores. On the left are typical traces under +50 mV applied potential, on the right are the probability density histogram distribution of the Ires%. (a) HSA blockades, (b) HTr blockades, (c) mixture of HTr and HSA blockades (0.15 μM HSA and 0.375 μM HTr). Recordings were conducted in 300 mM NaCl at pH 7.5, with a 50 kHz sampling and a 10 kHz Bessel filter.

References

    1. Restrepo-Pérez L.; Joo C.; Dekker C. Paving the way to single-molecule protein sequencing. Nat. Nanotechnol. 2018, 13 (9), 786–796. 10.1038/s41565-018-0236-6. - DOI - PubMed
    1. Varongchayakul N.; Song J.; Meller A.; Grinstaff M. W. Single-molecule protein sensing in a nanopore: a tutorial. Chem. Soc. Rev. 2018, 47, 8512–8524. 10.1039/C8CS00106E. - DOI - PMC - PubMed
    1. Robertson J. W. F.; Reiner J. E. The utility of nanopore technology for protein and peptide sensing. Proteomics 2018, 18, 1800026.10.1002/pmic.201800026. - DOI - PMC - PubMed
    1. Willems K.; Van Meervelt V.; Wloka C.; Maglia G. Single-molecule nanopore enzymology. Philos. Trans. R. Soc., B 2017, 372 (1726), 20160230.10.1098/rstb.2016.0230. - DOI - PMC - PubMed
    1. Pastoriza-Gallego M.; Betton J.-M.; Pelta J.; Bacri L.; Oukhaled A. Sensing Proteins through Nanopores: Fundamental to Applications. ACS Chem. Biol. 2012, 7 (12), 1935–1949. 10.1021/cb300449t. - DOI - PubMed

Publication types