. 2020 Apr;128(4):47005.
doi: 10.1289/EHP5843. Epub 2020 Apr 9.

Evaluation of Developmental Toxicity, Developmental Neurotoxicity, and Tissue Dose in Zebrafish Exposed to GenX and Other PFAS

Affiliations

Evaluation of Developmental Toxicity, Developmental Neurotoxicity, and Tissue Dose in Zebrafish Exposed to GenX and Other PFAS

Shaza Gaballah et al. Environ Health Perspect. 2020 Apr.

Abstract

Background: Per- and polyfluoroalkyl substances (PFAS) are a diverse class of industrial chemicals with widespread environmental occurrence. Exposure to long-chain PFAS is associated with developmental toxicity, prompting their replacement with short-chain and fluoroether compounds. There is growing public concern over the safety of replacement PFAS.

Objective: We aimed to group PFAS based on shared toxicity phenotypes.

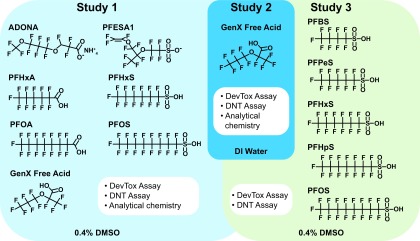
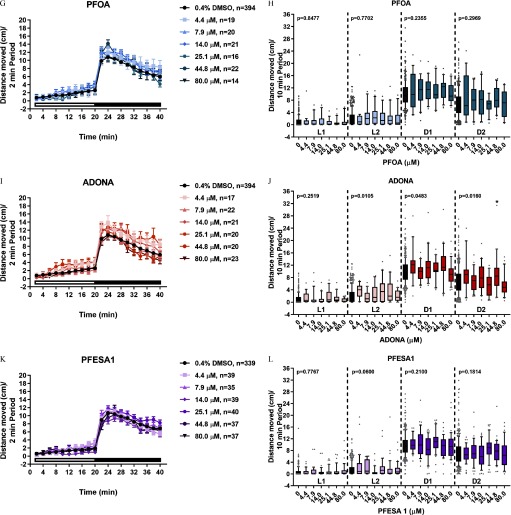
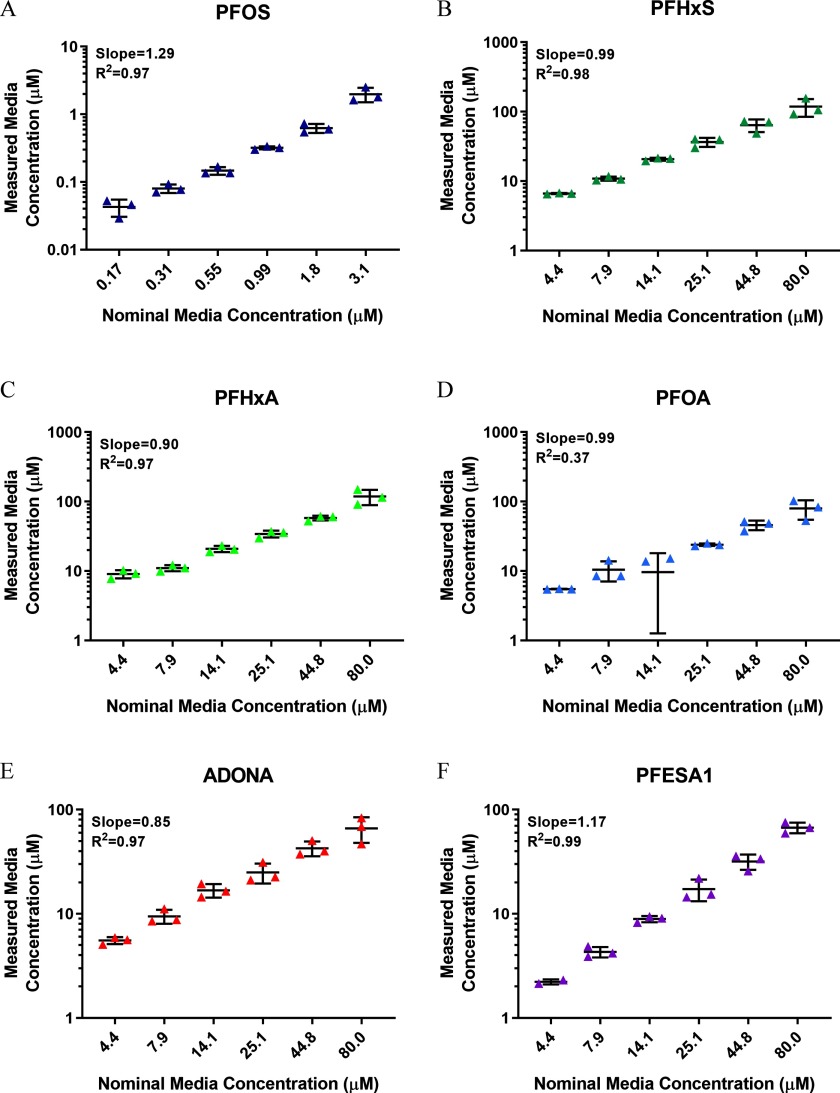
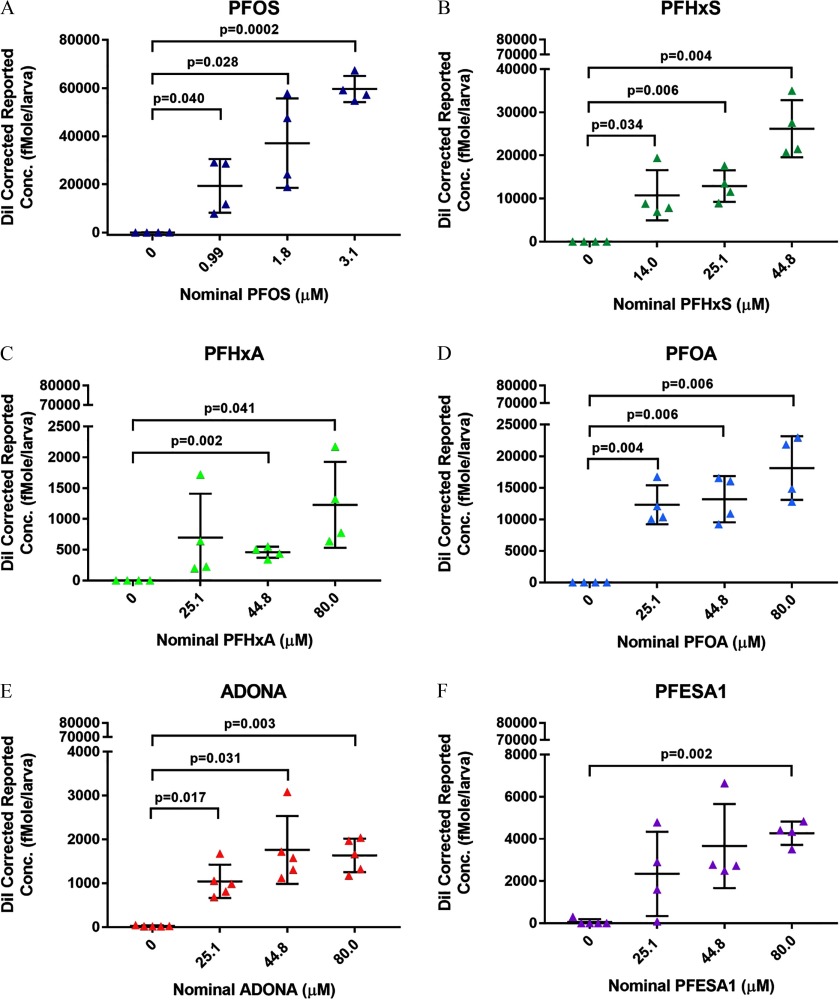
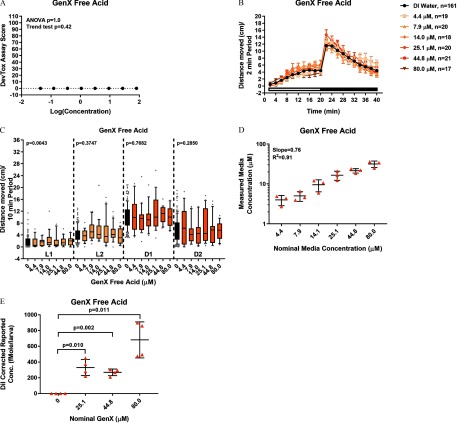
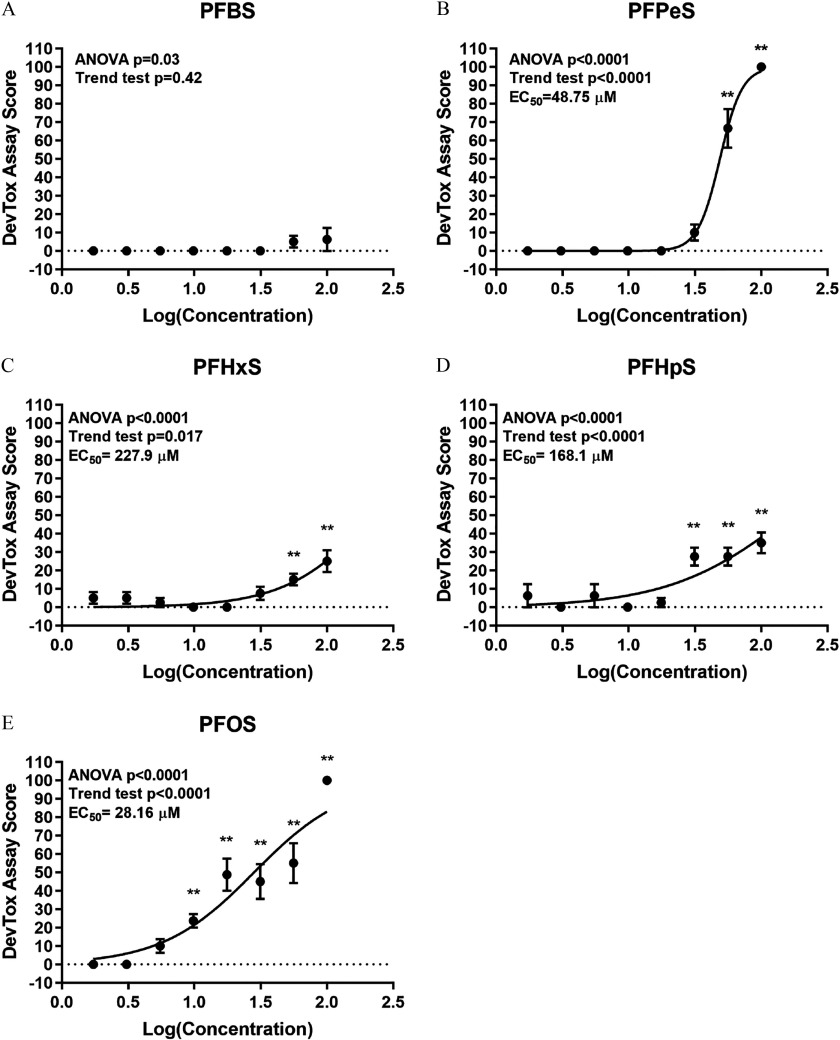
Methods: Zebrafish were developmentally exposed to 4,8-dioxa-3H-perfluorononanoate (ADONA), perfluoro-2-propoxypropanoic acid (GenX Free Acid), perfluoro-3,6-dioxa-4-methyl-7-octene-1-sulfonic acid (PFESA1), perfluorohexanesulfonic acid (PFHxS), perfluorohexanoic acid (PFHxA), perfluoro-n-octanoic acid (PFOA), perfluorooctanesulfonic acid (PFOS), or 0.4% dimethyl sulfoxide (DMSO) daily from 0-5 d post fertilization (dpf). At 6 dpf, developmental toxicity and developmental neurotoxicity assays were performed, and targeted analytical chemistry was used to measure media and tissue doses. To test whether aliphatic sulfonic acid PFAS cause the same toxicity phenotypes, perfluorobutanesulfonic acid (PFBS; 4-carbon), perfluoropentanesulfonic acid (PFPeS; 5-carbon), PFHxS (6-carbon), perfluoroheptanesulfonic acid (PFHpS; 7-carbon), and PFOS (8-carbon) were evaluated.

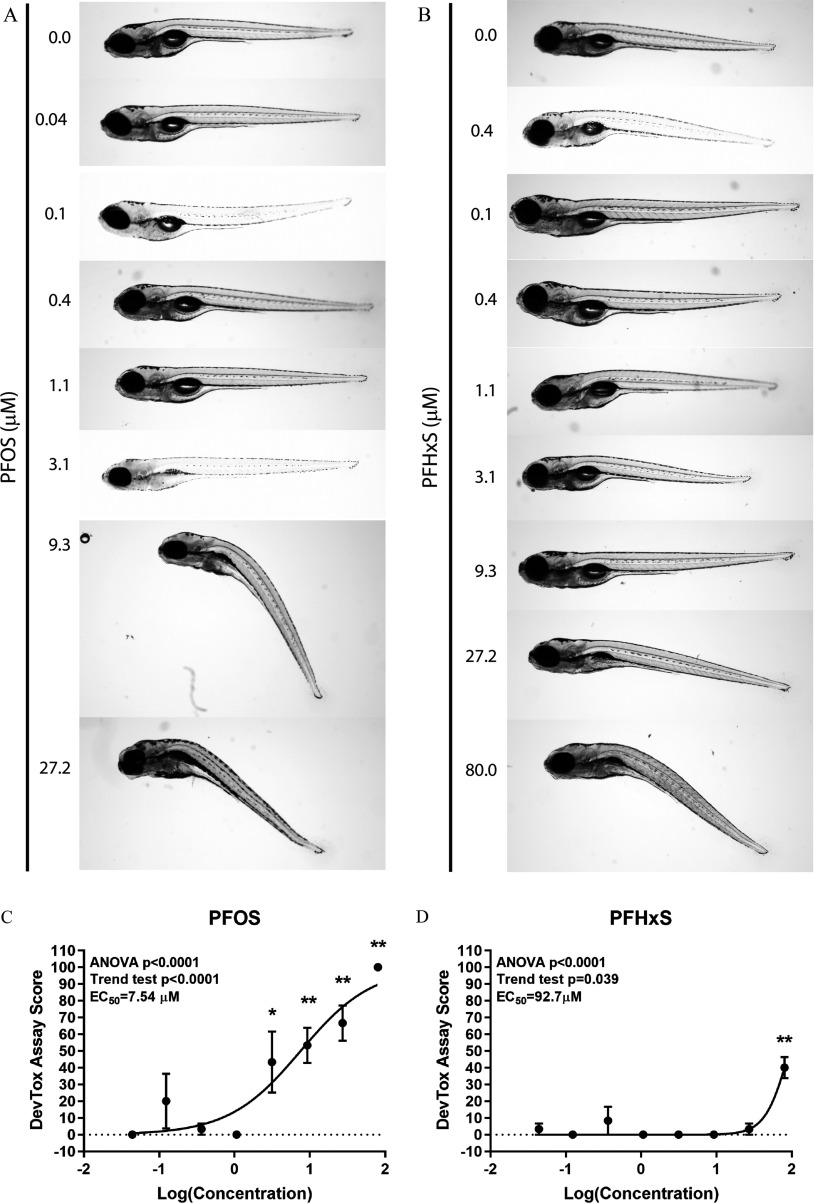
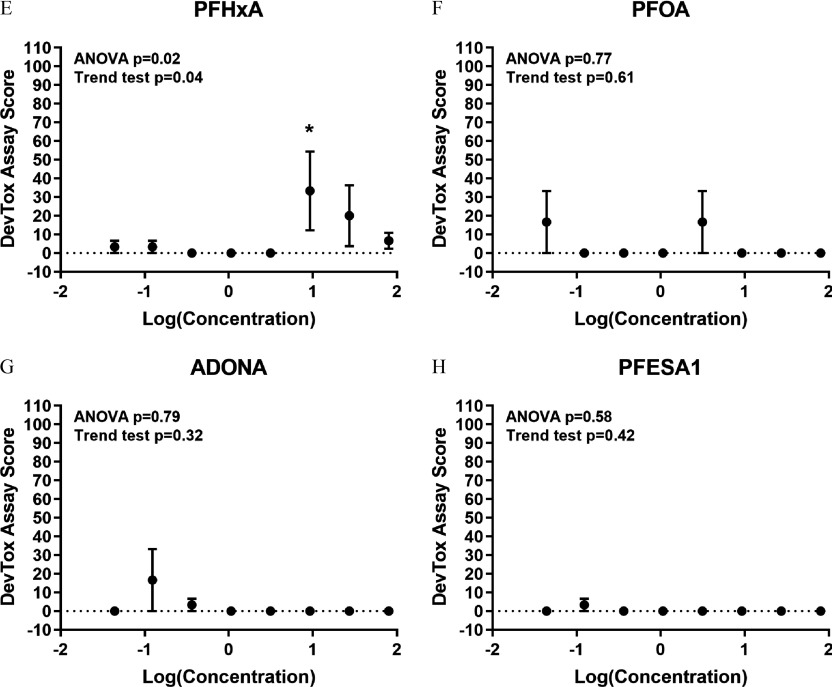
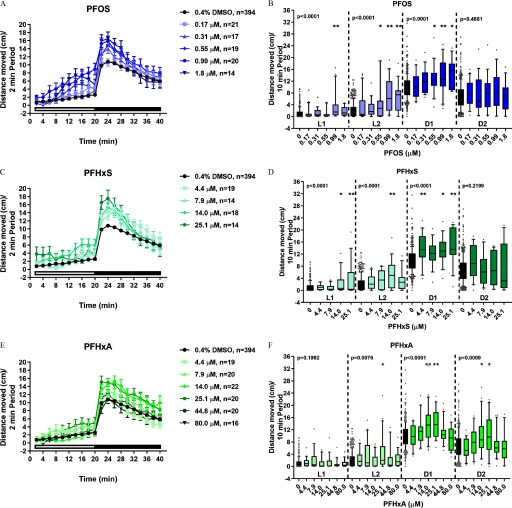
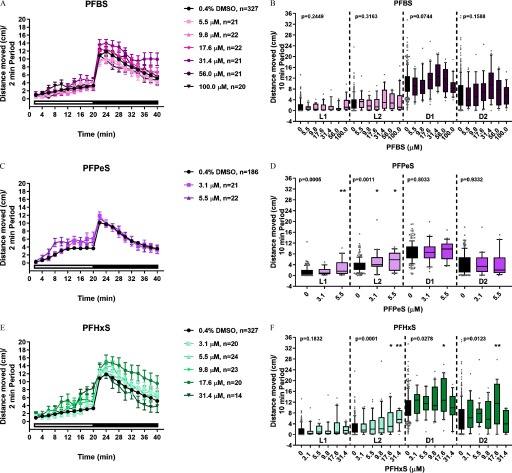
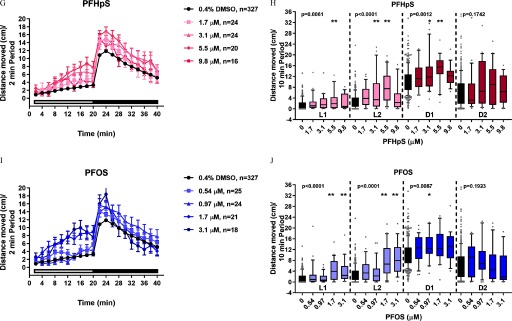
Results: PFHxS or PFOS exposure caused failed swim bladder inflation, abnormal ventroflexion of the tail, and hyperactivity at nonteratogenic concentrations. Exposure to PFHxA resulted in a unique hyperactivity signature. ADONA, PFESA1, or PFOA exposure resulted in detectable levels of parent compound in larval tissue but yielded negative toxicity results. GenX was unstable in DMSO, but stable and negative for toxicity when diluted in deionized water. Exposure to PFPeS, PFHxS, PFHpS, or PFOS resulted in a shared toxicity phenotype characterized by body axis and swim bladder defects and hyperactivity.

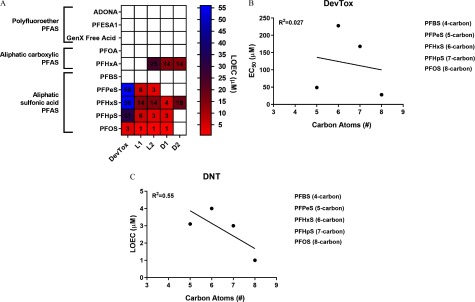
Conclusions: All emerging fluoroether PFAS tested were negative for evaluated outcomes. Two unique toxicity signatures were identified arising from structurally dissimilar PFAS. Among sulfonic acid aliphatic PFAS, chemical potencies were correlated with increasing carbon chain length for developmental neurotoxicity, but not developmental toxicity. This study identified relationships between chemical structures and in vivo phenotypes that may arise from shared mechanisms of PFAS toxicity. These data suggest that developmental neurotoxicity is an important end point to consider for this class of widely occurring environmental chemicals. https://doi.org/10.1289/EHP5843.


Figures

Figure 1 comprises studies 1, 2, and 3. Study 1 has the following chemical compounds: ADONA, PFESA1, PFHxA, PFHxS, PFOA, PFOS, and GenX Free Acid solubilized in 0.4 percent DMSO and assessed in the DevTox Assay, DNT Assay, and for analytical chemistry. Study 2 has GenX Free Acid chemical compound solubilized in DI water and assessed in the DevTox Assay, DNT Assay, and for analytical chemistry. Study 3 has the following chemical compounds: PFBS, PFPeS, PFHxS, PFHpS, and PFOS solubilized in 0.4 percent DMSO and assessed in the DevTox Assay and DNT Assay.
Figure 1.
Study design. Zebrafish were semi-statically exposed to test PFAS daily, from 05 dpf. At 6 dpf. developmental toxicity, developmental neurotoxicity, and PFAS tissue concentrations were assessed. Test PFAS included in Study 1, solubilized in DMSO (final concentration 0.4% DMSO), are highlighted in light blue. Because GenX Free Acid was not stable in DMSO, the compound was retested in all three assays using DI water as a diluent in Study 2 (highlighted in blue). In Study 3, a set of sulfonic acid aliphatic PFAS solubilized in DMSO were tested in the DevTox and DNT assays (shown in green). Note: ADONA, 4,8-dioxa-3H-perfluorononanoate; DevTox, developmental toxicity; DI, deionized; DMSO, dimethyl sulfoxide; DNT, developmental neurotoxicity; dpf, days post fertilization; GenX Free Acid, perfluoro-2-propoxypropanoic acid; PFAS, per- and polyfluoroalkyl substances; PFBS, perfluorobutanesulfonic acid; PFESA1, perfluoro-3,6-dioxa-4-methyl-7-octene-1-sulfonic acid; PFHpS, perfluoroheptanesulfonic acid; PFHxA, perfluorohexanoic acid; PFHxS, perfluorohexanesulfonic acid; PFOA, perfluoro-n-octanoic acid; PFOS, perfluorooctanesulfonic acid; PFPeS, perfluoropentanesulfonic acid.
Figure 2A and 2B comprise zebrafish larvae exposed to 0.0, 0.04, 0.1, 0.4, 1.1, 3.1, 9.3, or 27.2 micromolar of PFOS and 0.0, 0.04, 0.1, 0.4, 1.1, 3.1, 9.3, 27.2, or 80.0 micromolar of PFHxS. Figures 2C and 2D are graphs titled PFOS and PFHxS, plotting DevTox Assay Score, ranging from negative 10 to 110 in increments of 10 (y-axis) for ANOVA p-value less than 0.0001, trend test p-value less than 0.0001, EC subscript 50 equals 7.54 micromolar and ANOVA p-value less than 0.0001, trend test p-value equals 0.039, EC subscript 50 equals 92.7 micromolar, respectively, across log concentration, ranging from negative 2 to 2 (x-axis). Figures 2E and 2F are graphs titled PFHxA and PFOA, plotting DevTox Assay Score, ranging from negative 10 to 110 in increments of 10 (y-axis) for ANOVA p-value equals 0.02, trend test p-value equals 0.04 and ANOVA p-value equals 0.77 and trend test p-value equals 0.61, respectively, across log concentration, ranging from negative 2 to 2 (x-axis). Figures 2G and 2H are titled ADONA and PFESA1, plotting DevTox Assay Score, ranging from negative 10 to 110 in increments of 10 (y-axis) for ANOVA p-value equals 0.79, trend test p-value equals 0.32 and ANOVA p-value equals 0.58, trend test p-value equals 0.42, respectively, across log concentration, ranging from negative 2 to 2 (x-axis).
Figure 2.
Measures of developmental toxicity in zebrafish exposed to PFAS. Zebrafish were semi-statically exposed to 0.0480.0μM ADONA, GenX Free Acid, PFESA1, PFHxA, PFHxS, PFOA, or PFOS daily, from 05 dpf. At 6 dpf, larvae were assessed for developmental toxicity. Representative images for (A) PFOS and (B) PFHxS are shown. DevTox assay scores for (C) PFOS, (D) PFHxS, (E) PFHxA, (F) PFOA, (G) ADONA, or (H) PFESA1 are shown. Significance relative to the 0.4% DMSO control was determined by a Kruskal-Wallis ANOVA with a Dunn’s multiple comparison test (*p<0.05, **p<0.0001). If a test for linear trend was significant (p<0.05), with developmental toxicity observed at the highest concentration tested, nonlinear regression was performed with Hill slope curve fitting for half-maximal EC50 value determinations. n=6 larvae per concentration per chemical tested. Note: ADONA, 4,8-dioxa-3H-perfluorononanoate; DevTox, developmental toxicity; DMSO, dimethyl sulfoxide; dpf, days post fertilization; EC50, half maximal effective concentration; GenX Free Acid, perfluoro-2-propoxypropanoic acid; PFAS, per- and polyfluoroalkyl substances; PFESA1, perfluoro-3,6-dioxa-4-methyl-7-octene-1-sulfonic acid; PFHxA, perfluorohexanoic acid; PFHxS, perfluorohexanesulfonic acid; PFOA, perfluoro-n-octanoic acid; PFOS, perfluorooctanesulfonic acid.
Figures 3A, 3C, 3E, 3G, 3I, and 3K are graphs titled PFOS, PFHxS, PFHxA, PFOA, ADONA, and PFESA1, plotting distance moved in centimeters per 2 minute period, ranging from negative 2 to 20 in increments of 2 (y-axis) for 0.4 percent DMSO, n equals 394; 0.17 micromolar, n equals 21; 0.31 micromolar, n equals 17; 0.55 micromolar, n equals 19; 0.99 micromolar, n equals 20; and 1.8 micromolar, n equals 14 (PFOS); 0.4 percent DMSO, n equals 394; 4.4 micromolar, n equals 19; 7.9 micromolar, n equals 14; 14.0 micromolar, n equals 18; and 25.1 micromolar, n equals 14 (PFHxS); 0.4 percent DMSO, n equals 394; 4.4 micromolar, n equals 19; 7.9 micromolar, n equals 20; 14.0 micromolar, n equals 22; 25.1 micromolar, n equals 20; 44.8 micromolar, n equals 20; and 80.0 micromolar, n equals 16 (PFHxA); 0.4 percent DMSO, n equals 394; 4.4 micromolar, n equals 19; 7.9 micromolar, n equals 20; 14.0 micromolar, n equals 21; 25.1 micromolar, n equals 16; 44.8 micromolar, n equals 22; and 80.0 micromolar, n equals 14 (PFOA); 0.4 percent DMSO, n equals 394; 4.4 micromolar, n equals 17; 7.9 micromolar, n equals 22; 14.0 micromolar, n equals 21; 25.1 micromolar, n equals 20; 44.8 micromolar, n equals 20; and 80.0 micromolar, n equals 23 (ADONA); and 0.4 percent DMSO, n equals 339; 4.4 micromolar, n equals 39; 7.9 micromolar, n equals 35; 14.0 micromolar, n equals 39; 25.1 micromolar, n equals 40; 44.8 micromolar, n equals 37; and 80.0 micromolar, n equals 37 (PFESA1) across time, ranging from 0 to 40 minutes in increments of 4 (x-axis). Figures 4B, 4D, 4F, 4H, 4J, and 4L are graphs titled PFOS, PFHxS, PFHxA, PFOA, ADONA, and PFESA1, plotting distance moved in centimeters per 10 minute period, ranging from negative 4 to 36 in increments of 4 (y-axis) for p-value less than 0.0001 (L1), p-value less than 0.0001 (L2), p-value less than 0.0001 (D1), and p-value equals 0.4881 (D2) (PFOS); p-value less than 0.0001 (L1), p-value less than 0.0001 (L2), p-value less than 0.0001 (D1), and p-value equals 0.2199 (D2) (PFHxS); p-value equals 0.1992 (L1), p-value equals 0.0076 (L2), p-value less than 0.0001 (D1), and p-value equals 0.0009 (D2) (PFHxA); p-value equals 0.8477 (L1), p-value equals 0.7702 (L2), p-value equals 0.2355 (D1), and p-value equals 0.2969 (D2) (PFOA); p-value equals 0.2519 (L1), p-value equals 0.0105 (L2), p-value equals 0.0483 (D1), and p-value equals 0.0160 (D2) (ADONA); and p-value equals 0.7767 (L1), p-value equals 0.0600 (L2), p-value equals 0.2100 (D1), and p-value equals 0.1814 (D2) (PFESA1) across PFOS (0 to 1.8 micromolar), PFHxS (0 to 25.1 micromolar), PFHxA (0 to 80.0 micromolar), PFOA (0 to 80.0 micromolar), ADONA (0 to 80.0 micromolar), and PFESA1 (0 to 80.0 micromolar), respectively, (x-axis)
Figure 3.
Locomotor activity in zebrafish developmentally exposed to PFAS. Zebrafish were semi-statically exposed to 4.480.0μM ADONA, PFESA1, PFHxA, PFHxS, or PFOA, 0.23.1μM PFOS, or 0.4% DMSO as a vehicle control daily from 05 dpf. At 6 dpf, larvae were assessed for developmental toxicity. Morphologically normal larvae with inflated swim bladders were subjected to behavioral testing. (A, C, E, G, I, K) Distance moved (cm) each 2-min period over the entire 40-min testing period are shown. (B, D, F, H, J, L) To make statistical comparisons, the mean distance moved during each 10-min light 1 (L1), 10-min light 2 (L2), 10-min dark 1 (D1), or 10-min dark 2 (D2) periods are shown. For all chemicals except PFESA1, 14–23 larvae were tested per chemical concentration and the same DMSO control larvae (n=394) were used. PFESA1 was tested separately (n=3540 per chemical per concentration; 339 DMSO control larvae were evaluated). Repeated measures ANOVA models were run separately by period (L1, L2, D1, or D2). If a significant effect of concentration was detected (p<0.0125), within-period pairwise comparisons to control were computed using t-tests with a Dunnett adjustment for multiple comparisons (*p<0.05, **p<0.001). Significance relative to period-specific DMSO controls are shown. Note: ADONA, 4,8-dioxa-3H-perfluorononanoate; ANOVA, analysis of variance; D, dark period; DMSO, dimethyl sulfoxide; dpf, days post fertilization; L, light period; PFAS, per- and polyfluoroalkyl substances; PFESA1, perfluoro-3,6-dioxa-4-methyl-7-octene-1-sulfonic acid; PFHxA, perfluorohexanoic acid; PFHxS, perfluorohexanesulfonic acid; PFOA, perfluoro-n-octanoic acid; PFOS, perfluorooctanesulfonic acid.
Figure 4A is a graph titled PFOS, plotting measured media concentration, ranging from 0.01 to 10 micromolar (y-axis) for slope equals 1.29 and R squared equals 0.97 across nominal media concentration, ranging from 0.17 to 3.1 micromolar (x-axis). Figures 4B, 4C, and 4D are graphs titled PFHxS, PFHxA, and PFOA, plotting measured media concentration, ranging from 1 to 1000 micromolar (y-axis) for slope equals 0.99 and R squared equals 0.98 (PFHxS); slope equals 0.90 and R squared equals 0.97 (PFHxA); and slope equals 0.99 and R squared equals 0.37 (PFOA) across nominal media concentration, ranging from 4.4 to 80.0 micromolar. Figures 4E and 4F are graphs titled ADONA and PFESA1, plotting measured media concentration, ranging from 1 to 100 micromolar for slope equals 0.85 and R squared equals 0.97 (ADONA) and slope equals 1.17 and R squared equals 0.99 (PFESA1) across nominal media concentration, ranging from 4.4 to 80.0 micromolar (x-axis).
Figure 4.
Media concentrations of test PFAS at 6 dpf. Zebrafish were semi-statically exposed to 4.480.0μM PFHxS, PFHxA, PFOA, ADONA, or PFESA1 or 0.23.1μM PFOS daily from 05 dpf. At 6 dpf, media was collected for targeted analytical chemistry (n=3). Measured media concentrations for (A) PFOS, (B) PFHxS, (C) PFHxA, (D) PFOA, (E) ADONA, and (F) PFESA1 are shown. One observation for PFOA nominal media concentration 14.1μM was <MDL and therefore not shown on the plot. However, it was included in the regression analysis using the value MDL/sqrt(2). Note: ADONA, 4,8-dioxa-3H-perfluorononanoate; dpf, days post fertilization; MDL, method detection limit; PFAS, per- and polyfluoroalkyl substances; PFESA1, perfluoro-3,6-dioxa-4-methyl-7-octene-1-sulfonic acid; PFHxA, perfluorohexanoic acid; PFHxS, perfluorohexanesulfonic acid; PFOA, perfluoro-n-octanoic acid; PFOS, perfluorooctanesulfonic acid; sqrt, square-root.
 Figure 5A is a graph titled PFOS, plotting dilution corrected reported concentration, ranging from 0 to 80000 femtomoles per larva (y-axis), with DMSO vs. 0.99 micromolar PFOS, p-value equals 0.040; DMSO vs. 1.8 micromolar PFOS, p-value equals 0.028; and DMSO vs. 3.1 micromolar PFOS, p-value equals 0.0002, ranging from 0.0 to 3.1 micromolar (x-axis). Figure 5B is a graph titled PFHxS, plotting dilution corrected reported concentration, ranging from 0 to 80000 femtomoles per larva (y-axis), for DMSO vs. 14.0 micromolar PFHxS, p-value equals 0.034; DMSO vs. 25.1 micromolar PFHxS, p-value equals 0.006; and DMSO vs. 44.8 micromolar PFHxS, p-value equals 0.004, ranging from 0.0 to 44.8 micromolar (x-axis). Figures 5C, 5D, 5E, and 5F are graphs titled PFHxA, PFOA, ADONA, or PFESA1, plotting dilution corrected reported concentration, ranging from 0 to 80000 femtomoles per larva (y-axis), for DMSO vs. 44.8 micromolar PFHxA, p-value equals 0.002; DMSO vs. 80.0 micromolar PFHxA, p-value equals 0.041; DMSO vs. 25.1 micromolar PFOA, p-value equals 0.004; DMSO vs. 44.8 micromolar PFOA, p-value equals 0.006; DMSO vs. 80.0 micromolar PFOA, p-value equals 0.006; DMSO vs. 25.1 micromolar ADONA, p-value equals 0.017; DMSO vs. 44.8 micromolar ADONA, p-value equals 0.031; DMSO vs. 80.0 micromolar ADONA, p-value equals 0.003; and DMSO vs. 80.0 micromolar PFESA1, p-value equals 0002, ranging from 0.0 to 80.0 micromolar (x-axis).
Figure 5.
Internal tissue doses of test PFAS at 6 dpf. Zebrafish were semi-statically exposed to 25.180.0μM ADONA, PFOA, PFESA1, or PFHxA, or 14.044.8μM PFHxS, or 1.03.1μM PFOS. At 6 dpf, larvae were pooled and flash frozen (n=4 biological replicates with 10 pooled larvae per replicate) for targeted analytical chemistry. Measured internal tissue doses for (A) PFOS, (B) PFHxS, (C) PFHxA, (D) PFOA, (E) ADONA, and (F) PFESA1 are shown. Significance was determined by a Welch’s ANOVA followed by a Dunnett T3 test (p<0.05). Additional one-sample Student’s t-tests were performed for PFHxA, PFHxS, PFOA, and PFOS (p<0.05). Note: ADONA, 4,8-dioxa-3H-perfluorononanoate; ANOVA, analysis of variance; Dil, dilution; dpf, days post fertilization; PFAS, per- and polyfluoroalkyl substances; PFESA1, perfluoro-3,6-dioxa-4-methyl-7-octene-1-sulfonic acid; PFHxA, perfluorohexanoic acid; PFHxS, perfluorohexanesulfonic acid; PFOA, perfluoro-n-octanoic acid; PFOS, perfluorooctanesulfonic acid.
Figure 6A is a graph titled GenX Free Acid, plotting DevTox Assay Score, ranging from negative 10 to 110 (y-axis) where ANOVA p-value equals 1.0, trend test p-value equals 0.42 across log concentration, ranging from negative 2 to 2 (x-axis). Figure 6B is a graph titled GenX Free Acid, plotting distance moved in centimeters per 2 minute period, ranging from negative 2 to 20 (y-axis) for DI water, n equals 161; 4.4 micromolar, n equals 19; 7.9 micromolar, n equals 20; 14.0 micromolar, n equals 18; 25.1 micromolar, n equals 20; 44.8 micromolar, n equals 21; and 80.0 micromolar, n equals 17 across time, ranging from 0 to 40 minutes in increments of 4 (x-axis). Figure 6C is a graph titled GenX Free Acid, plotting distance moved in centimeters per 10 minute period, ranging from negative 4 to 36 in increments of 4 (y-axis) for p-value equals 0.0043 (L1), p-value equals 0.3747 (L2), p-value equals 0.7682 (D1), and p-value equals 0.2850 (D2) across GenX Free Acid, ranging from 0.0 to 80.0 micromolar (x-axis). Figure 6D is a graph titled GenX Free Acid, plotting measured media concentration, ranging from 1 to 100 micromolar (y-axis) for slope equals 0.76 and R squared equals 0.91 across nominal media concentration, ranging from 4.4 to 80.0 micromolar (x-axis). Figure 6E is a graph titled GenX Free Acid, plotting dilution corrected reported concentration, ranging from 0 to 100 femtomoles per larva (y-axis), for DMSO vs. 25.1 micromolar GenX Free Acid, p-value equals 0.010; DMSO vs. 44.8 micromolar GenX Free Acid, p-value equals 0.002; and DMSO vs. 80.0 micromolar GenX Free Acid, p-value equals 0.011 across nominal GenX, ranging from 0.0 to 80.0 micromolar (x-axis).
Figure 6.
Developmental and behavioral assays and media and tissue concentrations in zebrafish exposed to GenX Free Acid diluted in DI water. (A) Developmental toxicity scores at 6 dpf obtained from zebrafish developmentally exposed to 0.0480.0μM GenX Free Acid diluted in DI water daily, from 05 dpf. Significance was determined by one-way ANOVA with a Tukey’s multiple comparison test (p<0.05). n=6 larvae per concentration tested. For the DNT assay, zebrafish were exposed to 4.480.0μM GenX Free Acid daily, from 05 dpf. At 6 dpf, locomotor activity was assessed. (B) Distance moved (cm) each 2-min period or (C) mean distance moved during the light 1 (L1), light 2 (L2), dark 1 (D1), or dark 2 (D2) 10-min periods are shown. Repeated measures ANOVA models were run separately by period (L1, L2, D1, or D2). If a significant effect of concentration was detected (p<0.0125), within-period pairwise comparisons to control were computed using t-tests with a Dunnett adjustment for multiple comparisons (*p<0.05). n=1721 zebrafish per concentration and 161 DI water control larvae were assessed. (D) Media concentrations and (E) internal tissue dose at 6 dpf following daily exposure to 25.180.0μM GenX Free Acid. n=3 media replicates and n=4 biological replicates each comprising 10 pooled larvae. Significance was determined by a Welch’s ANOVA followed by a Dunnett T3 test (p<0.05). Additional one-sample Student’s t-tests were performed (p<0.05). Note: ANOVA, analysis of variance; D, dark phase; DevTox, developmental toxicity; DI, deionized; Dil, dilution; DNT, developmental neurotoxicity; dpf, days post fertilization; GenX Free Acid, perfluoro-2-propoxypropanoic acid; L, Light period.
Figures 7A, 7B, 7C, 7D, and 7E are graphs titled PFBS, PFPeS, PFHxS, PFHpS, or PFOS, plotting DevTox Assay Score, ranging from negative 10 to 110 (y-axis) for ANOVA p-value equals 0.03, trend test p-value equals 0.42 (PFBS); ANOVA p-value less than 0.0001, trend test p-value less than 0.0001, and EC subscript 50 equals 48.75 micromolar (PFPeS); ANOVA p-value less than 0.0001, trend test p-value equals 0.017, and EC subscript 50 equals 227.9 micromolar (PFHxS); ANOVA p-value less than 0.0001, trend test p-value less than 0.0001, and EC subscript 50 equals 168.1 micromolar (PFHpS); ANOVA p-value less than 0.0001, trend test p-value less than 0.0001, and EC subscript 50 equals 28.16 micromolar (PFOS) across log concentration, ranging from 0 to 2.5 (x-axis).
Figure 7.
Measures of developmental toxicity in zebrafish exposed to alkyl sulfonic acid PFAS. Zebrafish were semi-statically exposed to 1.7100.0μM PFBS, PFPeS, PFHxS, PFHpS, or PFOS or 0.4% DMSO daily from 05 dpf. At 6 dpf, larvae were assessed for developmental toxicity. DevTox assay scores for (A) PFBS, (B) PFPeS, (C) PFHxS, (D) PFHpS, or (E) PFOS are shown. Significance relative to the 0.4% DMSO control was determined by a Kruskal-Wallis ANOVA with a Dunn’s multiple comparison test (**p<0.0001). If a test for linear trend was significant (p<0.05), with developmental toxicity observed at the highest concentration tested, nonlinear regression was performed with Hill slope curve fitting for half-maximal EC50 value determinations. n=8 larvae per concentration per chemical tested. Note: ANOVA, analysis of variance; DevTox, developmental toxicity; DMSO, dimethyl sulfoxide; dpf, days post fertilization; EC50, half maximal effective concentration; PFAS, per- and polyfluoroalkyl substance; PFBS, perfluorobutanesulfonic acid; PFHpS, perfluoroheptanesulfonic acid; PFHxS, perfluorohexanesulfonic acid; PFOS, perfluorooctanesulfonic acid; PFPeS, perfluoropentanesulfonic acid.
Figures 8A, 8C, 8E, 8G, 8I are graphs titled PFBS, PFPeS, PFHxS, PFHpS, or PFOS, plotting distance moved in centimeters per 2 minute period, ranging from 0 to 20 (y-axis) for 0.4 percent DMSO, n equals 327; 5.5 micromolar, n equals 21; 9.8 micromolar, n equals 22; 17.6 micromolar, n equals 22; 31.4 micromolar, n equals 21; 56.0 micromolar, n equals 21; 100.0 micromolar, n equals 20 (PFBS); 0.4 percent DMSO, n equals 186; 3.1 micromolar, n equals 21; 5.5 micromolar, n equals 22 (PFPeS); 0.4 percent DMSO, n equals 327; 3.1 micromolar, n equals 20; 5.5 micromolar, n equals 24; 9.8 micromolar, n equals 23; 17.6 micromolar, n equals 20; 31.4 micromolar, n equals 14 (PFHxS); 0.4 percent DMSO, n equals 327; 1.7 micromolar, n equals 24; 3.1 micromolar, n equals 24; 5.5 micromolar, n equals 20; 9.8 micromolar, n equals 16 (PFHpS); 0.4 percent DMSO, n equals 327; 0.54 micromolar, n equals 25; 0.97 micromolar, n equals 24; 1.7 micromolar, n equals 21; 3.1 micromolar, n equals 18 (PFOS) across time, ranging from 0 to 40 minutes in increments of 4 (x-axis). Figures 8B, 8D, 8F, 8H, and 8J are graphs titled PFBS, PFPeS, PFHxS, PFHpS, or PFOS, plotting distance moved in centimeters per 10 minute period, ranging from negative 4 to 36 in increments of 4 (y-axis) for p-value equals 0.2449 (L1), p-value equals 0.3163 (L2), p-value equals 0.0744 (D1), p-value equals 0.1588 (D2) (PFBS); p-value equals 0.0005 (L1), p-value equals 0.0011 (L2), p-value equals 0.8033 (D1), p-value equals 0.9332 (D2) (PFPeS); p-value equals 0.1832 (L1), p-value equals 0.0001 (L2), p-value equals 0.0278 (D1), p-value equals 0.0123 (D2) (PFHxS); p-value equals 0.0061 (L1), p-value less than 0.0001 (L2), p-value equals 0.0012 (D1), p-value equals 0.1742 (D2) (PFHpS); p-value less than 0.0001 (L1), p-value less than 0.0001 (L2), p-value equals 0.0087 (D1), and p-value equals 0.1923 (D2) (PFOS) across PFBS, ranging from 0.0 to 100.0 micromolar; PFPeS, ranging from 0.0 to 5.5 micromolar; PFHxS, ranging from 0.0 to 31.4 micromolar; PFHpS, ranging from 0.0 to 9.8 micromolar; and PFOS, ranging from 0.0 to 3.1 micromolar (x-axis), respectively.
Figure 8.
Locomotor activity in zebrafish exposed to alkyl sulfonic acid PFAS. Zebrafish were semi-statically exposed to 5.5100.0μM PFBS, 3.15.5μM PFPeS, 3.131.4μM PFHxS, 1.79.8μM PFHpS, or 0.53.1μM PFOS daily from 05 dpf. For all chemicals except PFPeS, 14–25 larvae were tested per chemical concentration and the same DMSO control larvae (n=327) were used. PFPeS was tested separately (n=2122 larvae per concentration; 186 DMSO control larvae were evaluated). At 6 dpf, larvae were assessed for developmental toxicity. Morphologically normal larvae with inflated swim bladders were subjected to behavioral testing. (A, C, E, G, I) Distance moved (cm) each 2-min period or (B, D, F, H, J) mean distance moved during the light 1 (L1), light 2 (L2), dark 1 (D1), or dark 2 (D2) 10-min periods are shown. Repeated measures ANOVA models were run separately by period (L1, L2, D1, or D2). If a significant effect of concentration was detected (p<0.0125), within-period pairwise comparisons to control were computed using t-tests with a Dunnett adjustment for multiple comparisons (*p<0.05). ANOVA, analysis of variance; D, dark phase; DMSO, dimethyl sulfoxide; dpf, days post fertilization; L, light period; PFAS, per- and polyfluoroalkyl substances; PFBS, perfluorobutanesulfonic acid; PFHpS, perfluoroheptanesulfonic acid; PFHxS, perfluorohexanesulfonic acid; PFOS, perfluorooctanesulfonic acid; PFPeS, perfluoropentanesulfonic acid.
Figure 9A is a heatmap plot of polyfluoroether PFAS, aliphatic carboxylic PFAS, and aliphatic sulfonic acid PFAS (y-axis) across DevTox, L1, L2, D1, and D2 (x-axis), with a scale marking LOEC, ranging from 5 to 55 micromolar in increments of 5. Figures 9B (DevTox with R squared equals 0.027) and 9C (DNT with R squared equals 0.55) are graphs, plotting EC subscript 50, ranging from 0 to 250 micromolar in increments of 50 and LOEC, ranging from 0 to 5 micromolar (y-axis) for PFBS (4 carbon), PFPeS (5 carbon), PFHxS (6 carbon), PFHpS (7 carbon), PFOS (8 carbon) across carbon atoms number, ranging from 3 to 9 (x-axis).
Figure 9.
Identification of shared phenotypes between structurally similar PFAS. (A) Heatmap depicting LOEC values for the DevTox assay and significant hyperactivity in the L1, L2, D1, and/or D2 periods of the DNT assay (Studies 1, 2, and 3). If chemicals were replicated in Study 1 and Study 2, the lowest observed LOEC value was used. Linear regression of (B) Study 3 DevTox assay EC50 or (C) Study 3 DNT assay LOEC values for aliphatic sulfonic acid PFAS. Note: ADONA, 4,8-dioxa-3H-perfluorononanoate; D, dark period; DevTox, developmental toxicity; DNT, developmental neurotoxicity; EC50, half maximal effective concentration; GenX Free Acid, perfluoro-2-propoxypropanoic acid; L, light period; LOEC, lowest observed effect concentration; PFAS, per- and polyfluoroalkyl substances; PFBS, perfluorobutanesulfonic acid; PFESA1, perfluoro-3,6-dioxa-4-methyl-7-octene-1-sulfonic acid; PFHpS, perfluoroheptanesulfonic acid; PFHxA, perfluorohexanoic acid; PFHxS, perfluorohexanesulfonic acid; PFOA, perfluoro-n-octanoic acid; PFOS, perfluorooctanesulfonic acid; PFPeS, perfluoropentanesulfonic acid.

Similar articles

Cited by

References

    1. Agier L, Basagaña X, Maitre L, Granum B, Bird PK, Casas M, et al. . 2019. Early-life exposome and lung function in children in Europe: an analysis of data from the longitudinal, population-based HELIX cohort. Lancet Planet Health 3(2):e81–e92, PMID: 30737192, 10.1016/S2542-5196(19)30010-5. - DOI - PubMed
    1. Akhtar MT, Mushtaq MY, Verpoorte R, Richardson MK, Choi YH. 2016. Zebrafish as a model for systems medicine R&D: rethinking the metabolic effects of carrier solvents and culture buffers determined by 1H NMR metabolomics. OMICS 20(1):42–52, PMID: 26669610, 10.1089/omi.2015.0119. - DOI - PubMed
    1. Apelberg BJ, Witter FR, Herbstman JB, Calafat AM, Halden RU, Needham LL, et al. . 2007. Cord serum concentrations of perfluorooctane sulfonate (PFOS) and perfluorooctanoate (PFOA) in relation to weight and size at birth. Environ Health Perspect 115(11):1670–1676, PMID: 18008002, 10.1289/ehp.10334. - DOI - PMC - PubMed
    1. Banks RE, Smart BE, Tatlow JC. 1994. Organofluorine Chemistry: Principles and Commercial Applications. 1st ed New York, NY: Springer US.
    1. Blum A, Balan SA, Scheringer M, Trier X, Goldenman G, Cousins IT, et al. . 2015. The Madrid statement on poly- and perfluoroalkyl substances (PFAS). Environ Health Perspect 123(5):A107–A111, PMID: 25932614, 10.1289/ehp.1509934. - DOI - PMC - PubMed

Publication types

Substances

LinkOut - more resources