

Vital Signs: Newly Reported Acute and Chronic Hepatitis C Cases - United States, 2009-2018
- PMID: 32271725
- PMCID: PMC7147907
- DOI: 10.15585/mmwr.mm6914a2
Vital Signs: Newly Reported Acute and Chronic Hepatitis C Cases - United States, 2009-2018
Abstract
Introduction: Hepatitis C is a leading cause of death from liver disease in the United States. Acute hepatitis C infection is often asymptomatic, and >50% of cases will progress to chronic infection, which can be life-threatening. Hepatitis C can be diagnosed with a blood test and is curable, yet new cases of this preventable disease are increasing.
Methods: National Notifiable Diseases Surveillance System data were analyzed to determine the rate of acute hepatitis C cases reported to CDC by age group and year during 2009-2018 and the number and rate of newly reported chronic cases in 2018 by sex and age. The proportion of adults aged ≥20 years with hepatitis C who reported having ever been told that they had hepatitis C was estimated with 2015-2018 National Health and Nutrition Examination Survey data.
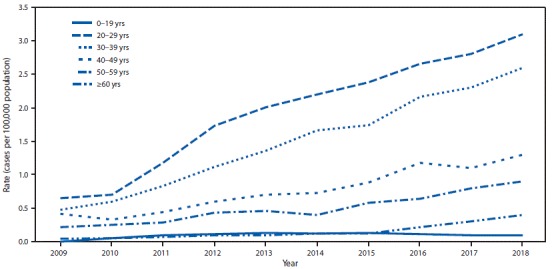
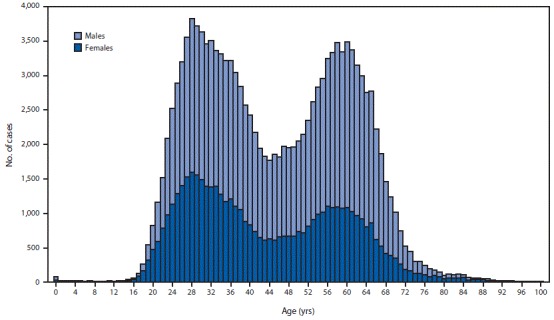
Results: During 2018, a total of 3,621 cases of acute hepatitis C were reported, representing an estimated 50,300 cases (95% confidence interval [CI] = 39,800-171,600). The annual rate of reported acute hepatitis C cases per 100,000 population increased threefold, from 0.3 in 2009 to 1.2 in 2018, and was highest among persons aged 20-29 (3.1) and 30-39 years (2.6) in 2018. A bimodal distribution of newly reported chronic hepatitis C cases in 2018 was observed, with the highest proportions among persons aged 20-39 years and 50-69 years. Only 60.6% (95% CI = 46.1%-73.9%) of adults with hepatitis C reported having been told that they were infected.
Conclusions and implications for public health practice: Increasing rates of acute hepatitis C among young adults, including reproductive-aged persons, have put multiple generations at risk for chronic hepatitis C. The number of newly reported chronic infections was approximately equal among younger and older adults in 2018. The new CDC hepatitis C testing recommendations advise screening all adults and pregnant women, not just persons born during 1945-1965, and those with risk factors.
Conflict of interest statement
All authors have completed and submitted the International Committee of Medical Journal Editors form for disclosure of potential conflicts of interest. No potential conflicts of interest were disclosed.
Figures
References
MeSH terms
LinkOut - more resources
Full Text Sources
Other Literature Sources
Medical
