. 2020 Apr 9;15(4):e0231132.
doi: 10.1371/journal.pone.0231132. eCollection 2020.

A protocol for rapid monocyte isolation and generation of singular human monocyte-derived dendritic cells

Affiliations

A protocol for rapid monocyte isolation and generation of singular human monocyte-derived dendritic cells

Thaize Quiroga Chometon et al. PLoS One. .

Abstract

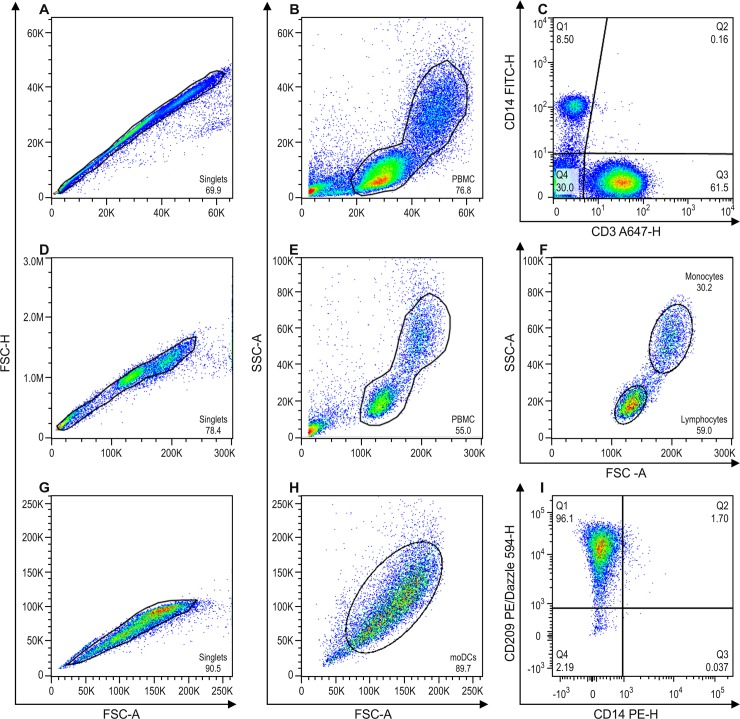
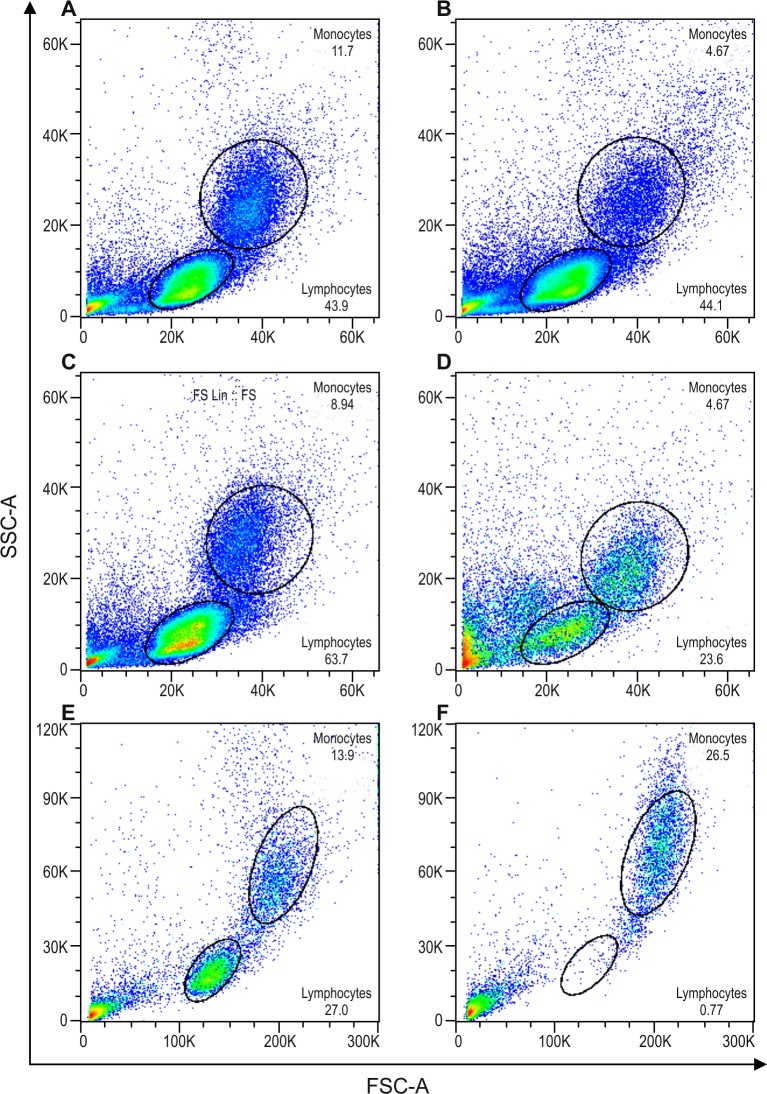
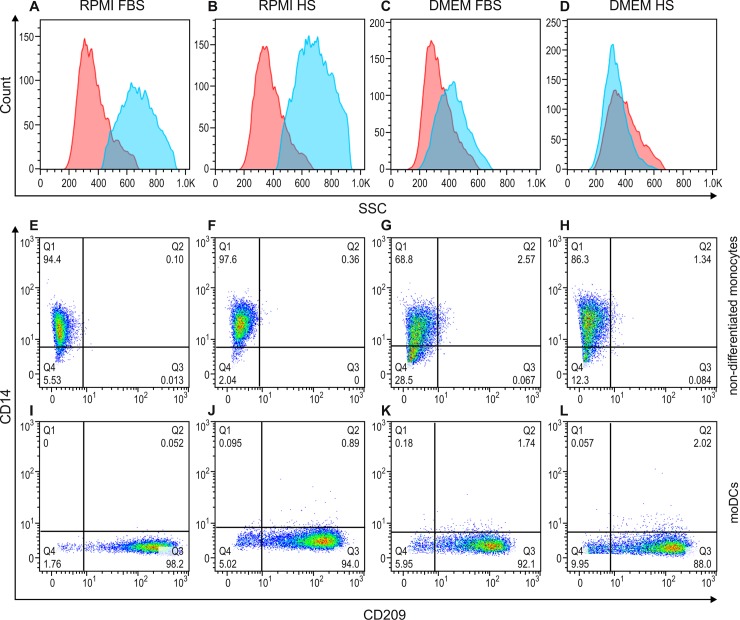
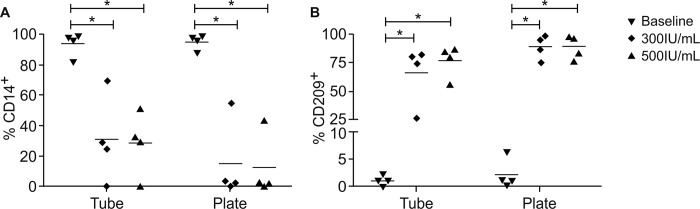
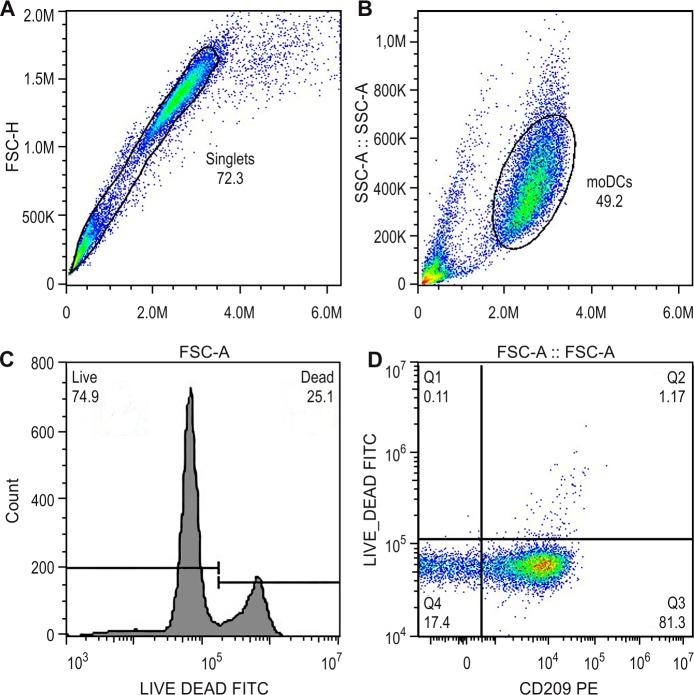
The monocyte-derived dendritic cells (moDCs) are a subset of dendritic cells widely used in immunological studies as a convenient and easy approach after isolation of mononuclear cells directly from peripheral blood mononuclear cells (PBMC). Both the purification and cell culture of monocytes impact on the differentiation of monocytes into moDCs. The methodology to isolate and differentiate monocytes into moDCs is still controversial. We aimed to compare three different protocols for monocyte isolation from PBMC: 1) Cold-aggregation; 2) Percoll gradient; and 3) Magnetic beads cell-enrichment. Additionally we also compared four different monocyte differentiation and culture techniques: 1) Cell culture media; 2) Serum sources; 3) required GM-CSF and IL-4 concentrations; 4) Cell culture systems. We used flow cytometry analysis of light scattering and/or expression of pan surface markers, such as CD3, CD14 and CD209 to determine isolation/differentiation degree. Purified PBMC followed by two steps of cold aggregation, yielded cell viability around 95% with poor monocyte enrichment (monocytes increase vs. lymphocytes reduction was not statistically significant, p>0.05). Conversely, monocyte isolation from PBMC with discontinuous Percoll gradient generated around 50% cell viability. Albeit, we observed a significant reduction (p≤0.05) of lymphocytes contaminants. The magnetic beads cell-enrichment yield cell viability higher than 95%, as high as a significant lymphocyte depletion (p≤0.005) when compared to all other techniques employed. The moDCs showed better differentiation based on increased CD209 expression, but lower CD14 levels, when cells were cultured in RPMI medium plus 500IU/mL of both GM-CSF and IL-4 in a semi-adherent fashion. Serum sources showed no influence on the culture performance. In conclusion, the magnetic beads cell-enrichment showed superior cell viability, indicating that this approach is a better choice to isolate monocytes, and moDCs cultured afterwards in appropriate medium, serum, cytokines and culture system might influence the monocytes differentiation into moDC.


Conflict of interest statement

No competing interests.

Figures

Fig 1
Fig 1. Gate strategy for flow cytometry analysis.
A, B and C = representative experiment after ficoll gradient followed by two steps of cold-aggregation and by cold-aggregation + percoll gradient for isolation of monocytes. D, E and F = representative experiment after ficoll gradient followed by Immunomagnetic beads for isolation of monocytes. G, H and I = representative experiment for monocyte differentiation to moDC. A = Dotplot of size FSC-A vs FSC-H for doublets exclusion, gated on singlets. B = Dotplot of FSC-A vs SSC-A for PBMCs, inside singlets gate. C = Dotplot of CD14 vs CD3, inside PBMC gate, where Q1 represents monocytes (CD14+) and Q3 represents T lymphocytes (CD3+). D = Dotplot of FSC-A vs FSC-H for doublets exclusion, gated on singlets. E = Dotplot of FSC-A vs SSC-A for PBMCs, inside singlets gate. F = Dotplot of FSC-A vs SSC-A inside the PBMC gate, where lymphocytes and monocytes were gated according to their size and granulosity characteristics. G = Dotplot FSC-A vs FSC-H for doublets exclusion of moDC after the differentiation protocol, gated on singlets. H = Dotplot of FSC-A vs SSC-A for moDCs, inside singlets gate. I = Dotplot of CD14 vs CD209, inside moDCs gate, where Q1 represents moDCs (CD209+) and Q3 represents non-differentiated monocytes (CD14+). All percentage and statistical analysis were performed inside the PBMC gate, thus excluding cell debris.
Fig 2
Fig 2. Flow cytometry light scattering (forward scatter, FSC, size vs. side scatter, SSC, granularity) demonstrating a typical profile from a representative experiment.
A, C, and E = Dotplots after PBMC isolation, and the respective subsequent dot plots; B = two consecutive steps of in house cold aggregation (n = 3), D = in house cold aggregation plus self-generating discontinuous Percoll gradient (n = 6), and F = magnetic beads cell-enrichment (n = 10). Percentage of cells as follows: (A) Monocytes 11.7% and lymphocytes 43.9%; (B) Monocytes 4.67% and lymphocytes 44.1%; (C) Monocytes 8.94% and lymphocytes 63.7%; (D) Monocytes 20.6% and lymphocytes 23.6%; (E) Monocytes 14.9% and lymphocytes 26.7%; (F) Monocytes 27.7% and lymphocytes 0.6%.
Fig 3
Fig 3
Flow cytometry overlay histograms for side scatter (A-D) and dot plots for CD14 and CD209 staining (E-L) demonstrating typical cell profiles from a representative experiment out of three. Side scatter (SSC, granularity) in non-differentiated monocytes (red shaded histogram) and differentiated moDCs (blue shaded histogram) cultured in either RPMI (A and B) or DMEM medium (C and D), supplemented with either FBS (A and C) or HS (B and D). CD14 and CD209 surface marker expression on non-differentiated monocytes (E-H) and moDCs (I-L) cultured in either RPMI (E, F, I and J) or DMEM medium (G, H, K and L), supplemented with either FBS (E, G, I and K) or HS (F, H, J and L). Cells were stained with CD14-FITC (y-axis) and CD209-PE (x-axis). The percentages of cells are indicated in each quadrant.
Fig 4
Fig 4. Comparison of the percentage of moDCs or non-differentiated monocytes expressing CD14 or CD209.
A = CD14, B = CD209. Negative selected monocytes in culture for 5 days with two different concentration of GM-CSF and IL-4. Non-differentiated, 300IU/mL or 500IU/mL. The bars indicate the group mean. (n = 4) * p ≤ 0.05, by the Mann-Whitney test.
Fig 5
Fig 5. Viability of moDCs after 5 days of culture differentiation.
A = FSC-A vs FSC-H dotplot for doublets exclusion, gate on singlets. B = dotplot of size (FSC-A) vs granularity (SSC-A) for moDCs, inside singlets gate. C = histogram of Viability staining (Live and Dead-FITC) of death control D = Dotplot CD209 vs Live and Dead, inside moDCs gate, where Q1 represents CD209- Dead cells (0.11%), Q2 represents CD209+ Dead cells (1.17%) Q3 represents CD209+ Live cells (81.3%) and Q4 represent CD209- Live cells (17.4%). Graphs representative for cell cultivated in plates with 500IU/mL of cytokines.
Fig 6
Fig 6. Median Fluorescence Intensity (MFI) of CD80 and CD86.
moDC (immature moDCs generated from monocytes by addition of hrGM-CSF and hrIL-4) and moDC + LPS (LPS at 0.5 μg/ml for 24 hours) (n = 8) * p ≤ 0.05, by the Wilcoxon test.

Similar articles

Cited by

References

    1. Fol M, Nitecka-Blaźlak A, Szpakowski P., Madiraju M., Rudnicka W., Druszczyńska M., Pestel J., & Kowalewicz-Kulbat M. Evaluation of two different dendritic cell preparations to BCG reactivity. Arch Biol Sci. 2016;68(2):263–71.
    1. Elkord E, Williams PE, Kynaston H, Rowbottom AW. Human monocyte isolation methods influence cytokine production from in vitro generated dendritic cells. Immunology. 2005;114(2):204–12. 10.1111/j.1365-2567.2004.02076.x - DOI - PMC - PubMed
    1. Gutiérrez-Martínez E, Planès R, Anselmi G, Reynolds M, Menezes S, Adiko AC, et al. Cross-Presentation of Cell-Associated Antigens by MHC Class I in Dendritic Cell Subsets. Front Immunol. 2015;6:363 10.3389/fimmu.2015.00363 - DOI - PMC - PubMed
    1. Figdor CG, de Vries IJ, Lesterhuis WJ, Melief CJ. Dendritic cell immunotherapy: mapping the way. Nat Med. 2004;10(5):475–80. 10.1038/nm1039 - DOI - PubMed
    1. Santos D, Coelho J, Neri E, Campos-Souza I, Ponte C. The Differential In Vitro Presentation of Mycobacterium leprae Antigens by Human Dendritic Cells is determined by the Mechanism of Host Cell Adhesion.2016.

Publication types