

A population-specific low-frequency variant of SLC22A12 (p.W258*) explains nearby genome-wide association signals for serum uric acid concentrations among Koreans
- PMID: 32271837
- PMCID: PMC7145145
- DOI: 10.1371/journal.pone.0231336
A population-specific low-frequency variant of SLC22A12 (p.W258*) explains nearby genome-wide association signals for serum uric acid concentrations among Koreans
Abstract
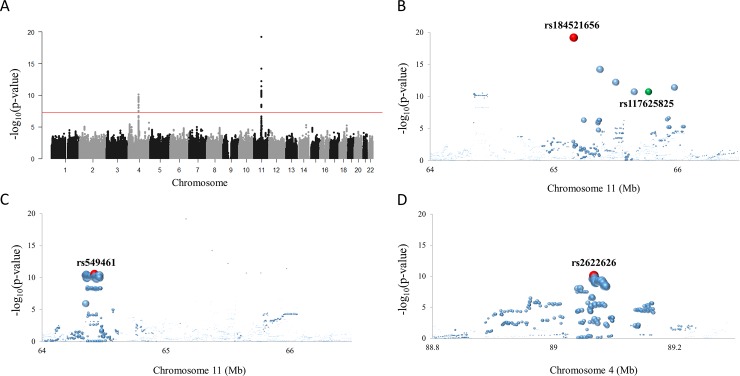
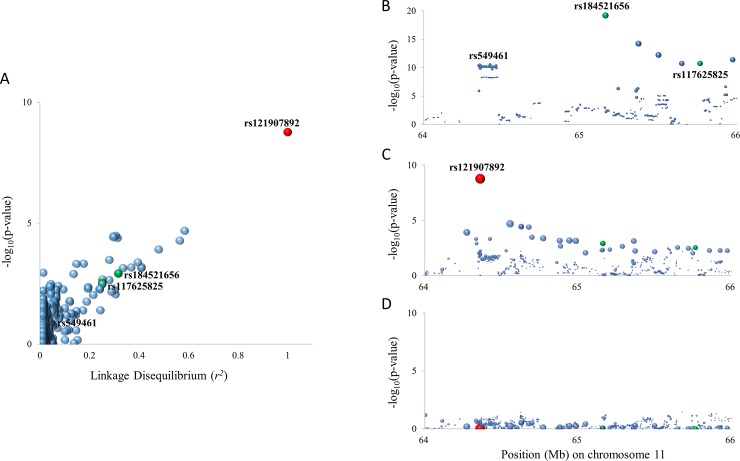
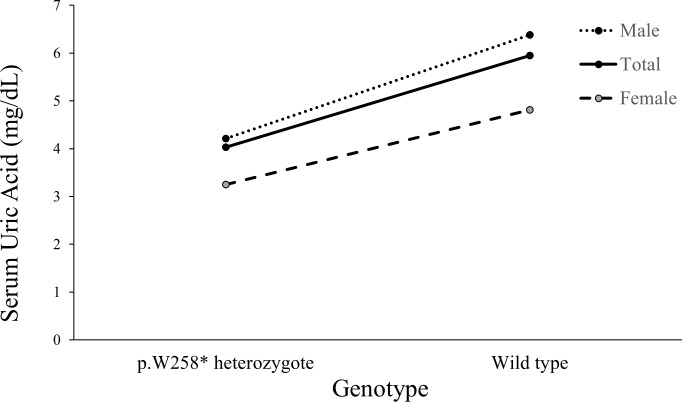
Prolonged hyperuricemia is a cause of gout and an independent risk factor for chronic health conditions including diabetes and chronic kidney diseases. Genome-wide association studies (GWASs) for serum uric acid (SUA) concentrations have repeatedly confirmed genetic loci including those encoding uric acid transporters such as ABCG2 and SLC9A2. However, many single nucleotide polymorphisms (SNPs) found in GWASs have been common variants with small effects and unknown functions. In addition, there is still much heritability to be explained. To identify the causative genetic variants for SUA concentrations in Korean subjects, we conducted a GWAS (1902 males) and validation study (2912 males and females) and found four genetic loci reaching genome-wide significance on chromosomes 4 (ABCG2) and 11 (FRMD8, EIF1AD and SLC22A12-NRXN2). Three loci on chromosome 11 were distributed within a distance of 1.3 megabases and they were in weak or moderate linkage disequilibrium (LD) states (r2 = 0.02-0.68). In a subsequent association analysis on the GWAS loci of chromosome 11 using closely positioned markers derived from whole genome sequencing data, the most significant variant to be linked with the nearby GWAS signal was rs121907892 (c.774G>A, p.W258*) of the SLC22A12 gene. This variant, and each of the three GWAS SNPs, were in LD (r2 = 0.06-0.32). The strength of association of SNPs with SUA concentration (negative logarithm of P-values) and the genetic distance (r2 of LD) between rs121907892 and the surrounding SNPs showed a quantitative correlation. This variant has been found only in Korean and Japanese subjects and is known to lower the SUA concentration in the general population. Thus, this low-frequency variant, rs121907892, known to regulate SUA concentrations in previous studies, is responsible for the nearby GWAS signals.
Conflict of interest statement
The authors have declared that no competing interests exist.
Figures
Similar articles
-
No association between MTHFR C677T and serum uric acid levels among Japanese with ABCG2 126QQ and SLC22A12 258WW.Nagoya J Med Sci. 2013 Feb;75(1-2):93-100. Nagoya J Med Sci. 2013. PMID: 23544272 Free PMC article.
-
Prevalence of hyperuricemia among the Chinese population of the southeast coastal region and association with single nucleotide polymorphisms in urate‑anion exchanger genes: SLC22A12, ABCG2 and SLC2A9.Mol Med Rep. 2018 Sep;18(3):3050-3058. doi: 10.3892/mmr.2018.9290. Epub 2018 Jul 16. Mol Med Rep. 2018. PMID: 30015934
-
ABCG2 rs2231142 variant in hyperuricemia is modified by SLC2A9 and SLC22A12 polymorphisms and cardiovascular risk factors in an elderly community-dwelling population.BMC Med Genet. 2020 Mar 17;21(1):54. doi: 10.1186/s12881-020-0987-4. BMC Med Genet. 2020. PMID: 32183743 Free PMC article.
-
The genetics of hyperuricaemia and gout.Nat Rev Rheumatol. 2012 Oct;8(10):610-21. doi: 10.1038/nrrheum.2012.144. Epub 2012 Sep 4. Nat Rev Rheumatol. 2012. PMID: 22945592 Free PMC article. Review.
-
Recent advances in renal urate transport: characterization of candidate transporters indicated by genome-wide association studies.Clin Exp Nephrol. 2012 Feb;16(1):89-95. doi: 10.1007/s10157-011-0532-z. Epub 2011 Nov 1. Clin Exp Nephrol. 2012. PMID: 22038265 Review.
Cited by
-
Nonlinear association of cardiometabolic index with hyperuricemia: insights from the NHANES 1999-2018 study.Front Endocrinol (Lausanne). 2025 Mar 26;16:1459946. doi: 10.3389/fendo.2025.1459946. eCollection 2025. Front Endocrinol (Lausanne). 2025. PMID: 40206602 Free PMC article.
-
Genetic Basis of the Epidemiological Features and Clinical Significance of Renal Hypouricemia.Biomedicines. 2022 Jul 13;10(7):1696. doi: 10.3390/biomedicines10071696. Biomedicines. 2022. PMID: 35885001 Free PMC article. Review.
-
A whole-genome reference panel of 14,393 individuals for East Asian populations accelerates discovery of rare functional variants.Sci Adv. 2023 Aug 9;9(32):eadg6319. doi: 10.1126/sciadv.adg6319. Epub 2023 Aug 9. Sci Adv. 2023. PMID: 37556544 Free PMC article.
References
-
- Kim SK. Interrelationship of uric acid, gout, and metabolic syndrome: focus on hypertension, cardiovascular disease, and insulin resistance. J Rheum Dis. 2018;25(1):19–27.
Publication types
MeSH terms
Substances
LinkOut - more resources
Full Text Sources
Research Materials
