. 2020 Apr 14;4(7):1388-1406.
doi: 10.1182/bloodadvances.2019000699.

Diversity of peripheral blood human NK cells identified by single-cell RNA sequencing

Affiliations

Diversity of peripheral blood human NK cells identified by single-cell RNA sequencing

Samantha L Smith et al. Blood Adv. .

Abstract

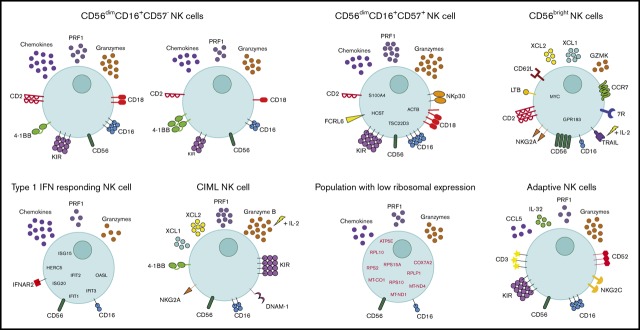
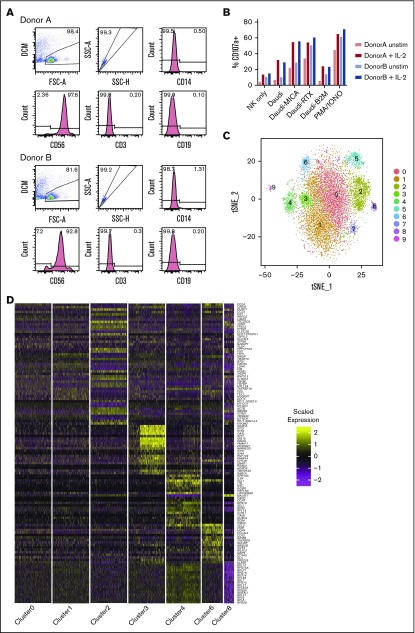
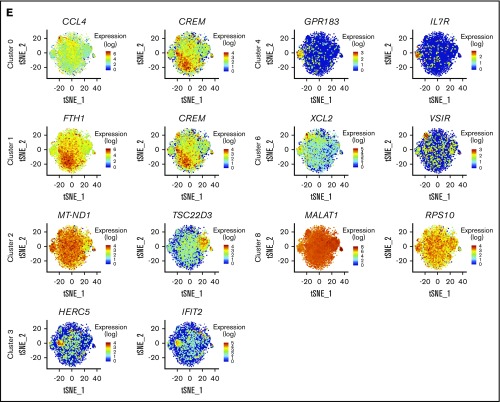
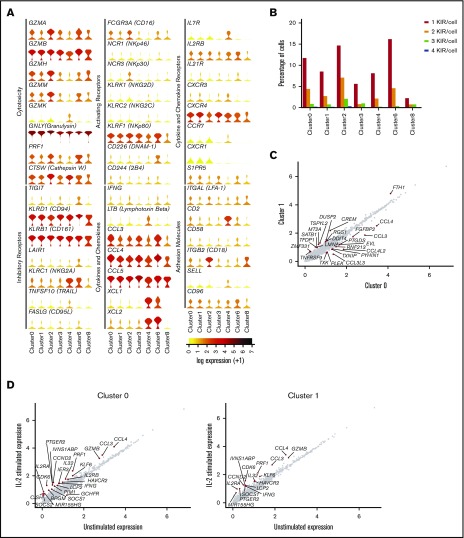
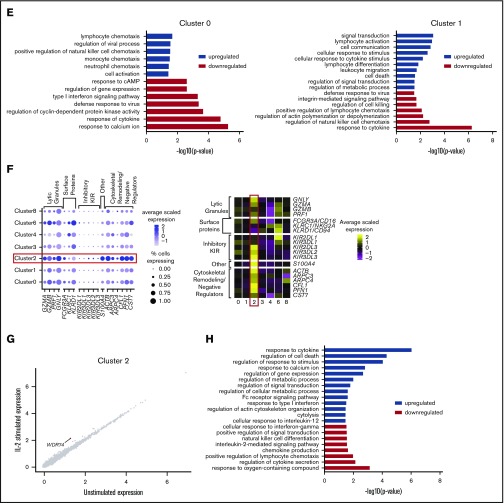
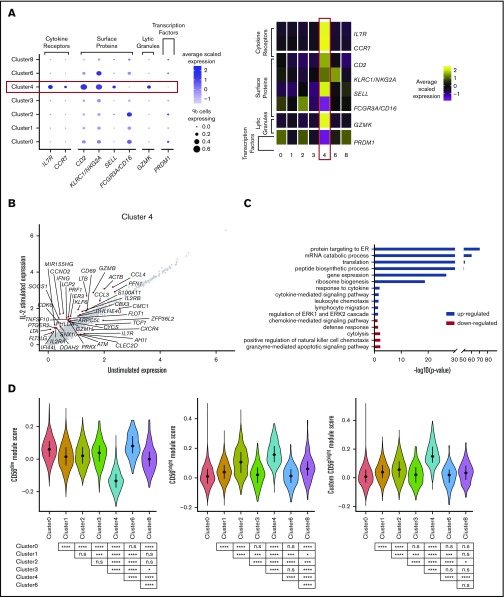
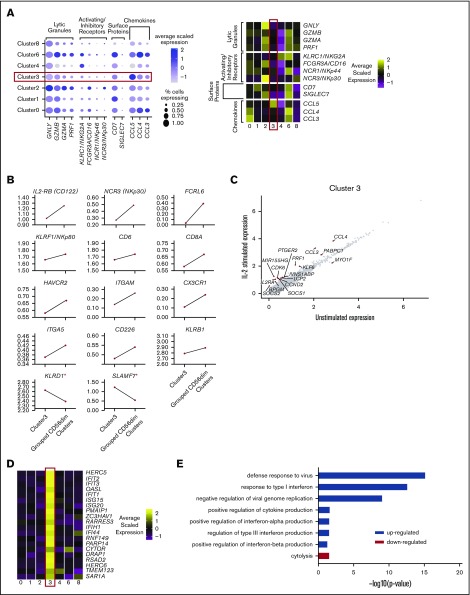
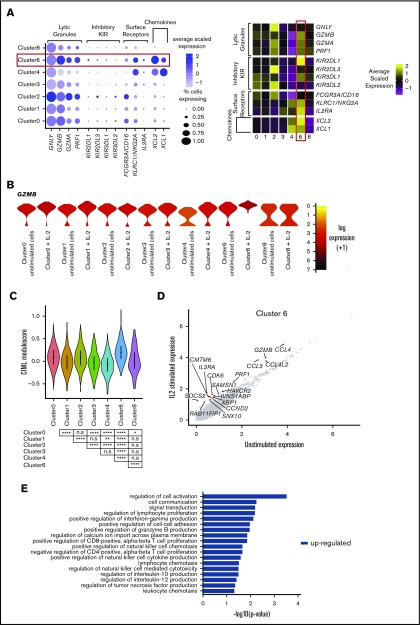
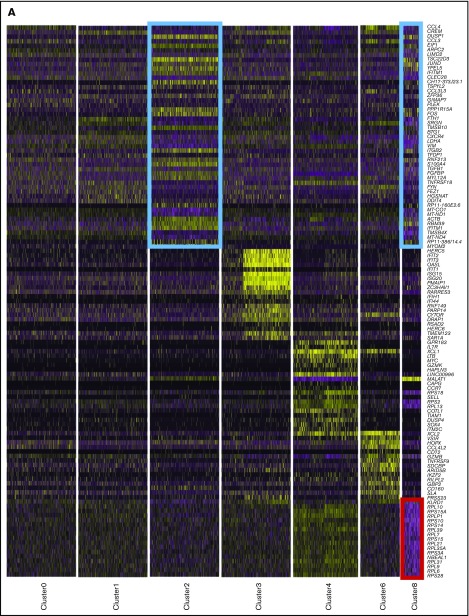
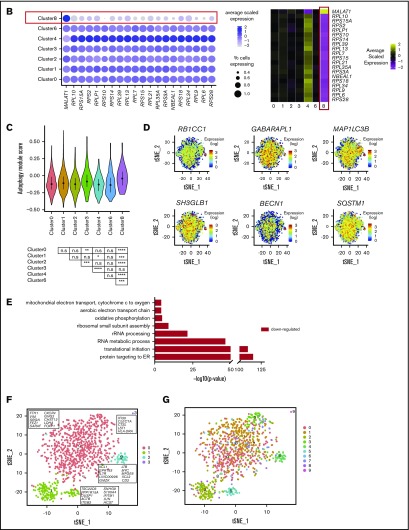
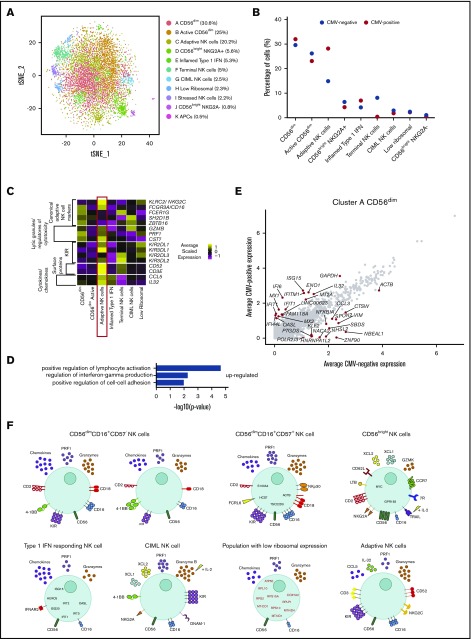
Human natural killer (NK) cells in peripheral blood perform many functions, and classification of specific subsets has been a longstanding goal. We report single-cell RNA sequencing of NK cells, comparing gene expression in unstimulated and interleukin (IL)-2-activated cells from healthy cytomegalovirus (CMV)-negative donors. Three NK cell subsets resembled well-described populations; CD56brightCD16-, CD56dimCD16+CD57-, and CD56dimCD16+CD57+. CD56dimCD16+CD57- cells subdivided to include a population with higher chemokine mRNA and increased frequency of killer-cell immunoglobulin-like receptor expression. Three novel human blood NK cell populations were identified: a population of type I interferon-responding NK cells that were CD56neg; a population exhibiting a cytokine-induced memory-like phenotype, including increased granzyme B mRNA in response to IL-2; and finally, a small population, with low ribosomal expression, downregulation of oxidative phosphorylation, and high levels of immediate early response genes indicative of cellular activation. Analysis of CMV+ donors established that CMV altered the proportion of NK cells in each subset, especially an increase in adaptive NK cells, as well as gene regulation within each subset. Together, these data establish an unexpected diversity in blood NK cells and provide a new framework for analyzing NK cell responses in health and disease.


Conflict of interest statement

Conflict-of-interest disclosure: The authors declare no competing financial interests.

Figures

None
Graphical abstract
Figure 1.
Figure 1.
Single-cell sequencing of healthy peripheral blood NK cells. (A) Flow cytometry plots of negatively isolated human blood NK cells from both donors, showing the gating of live singlet cells and then showing the expression of CD14 (monocyte marker). On CD14 cells, expression of CD56 (NK cell marker), CD3 (T-cell marker), and CD19 (B-cell marker) is shown. (B) Total percentage of CD107a+ cells on negatively isolated bulk NK cells after a 5-hour culture, alone (NK only) or with the B lymphoblast cell line Daudi; Daudi cells transfected to express major histocompatibility (MHC) class I–related chain A (Daudi-MICA) or β2m (Daudi-β2m); or rituximab-coated Daudi (Daudi-RTX) or NK cells alone stimulated with phorbol myristate acetate/ionomycin (PMA/IONO). NK cells from both donors are shown separately, with and without IL-2 treatment. (C) tSNE, 2-dimensional plot of 8462 individual NK cells, with clusters (0-9) identified using unsupervised hierarchical clustering. (D) Heat map of top 20 markers distinguishing each NK cell cluster (n = 120 unique genes), identified by differential expression analysis and showing a maximum of 500 genes per cluster, excluding clusters 5, 7, and 9. Cells are plotted in columns, and genes are shown in rows. Gene expression is color coded, using a scale based on z-score distribution. (E) Same tSNE plot as shown in panel C (but excluding clusters 5, 7, and 9), showing the expression of the top 2 markers which distinguish each cluster. Expression is color coded from blue (low) to red (high) and cells positively expressing a marker are brought toward the front of the plot.
Figure 1.
Figure 1.
Single-cell sequencing of healthy peripheral blood NK cells. (A) Flow cytometry plots of negatively isolated human blood NK cells from both donors, showing the gating of live singlet cells and then showing the expression of CD14 (monocyte marker). On CD14 cells, expression of CD56 (NK cell marker), CD3 (T-cell marker), and CD19 (B-cell marker) is shown. (B) Total percentage of CD107a+ cells on negatively isolated bulk NK cells after a 5-hour culture, alone (NK only) or with the B lymphoblast cell line Daudi; Daudi cells transfected to express major histocompatibility (MHC) class I–related chain A (Daudi-MICA) or β2m (Daudi-β2m); or rituximab-coated Daudi (Daudi-RTX) or NK cells alone stimulated with phorbol myristate acetate/ionomycin (PMA/IONO). NK cells from both donors are shown separately, with and without IL-2 treatment. (C) tSNE, 2-dimensional plot of 8462 individual NK cells, with clusters (0-9) identified using unsupervised hierarchical clustering. (D) Heat map of top 20 markers distinguishing each NK cell cluster (n = 120 unique genes), identified by differential expression analysis and showing a maximum of 500 genes per cluster, excluding clusters 5, 7, and 9. Cells are plotted in columns, and genes are shown in rows. Gene expression is color coded, using a scale based on z-score distribution. (E) Same tSNE plot as shown in panel C (but excluding clusters 5, 7, and 9), showing the expression of the top 2 markers which distinguish each cluster. Expression is color coded from blue (low) to red (high) and cells positively expressing a marker are brought toward the front of the plot.
Figure 2.
Figure 2.
Among CD56dim CD16+ NK cells is a distinct subset of CD57+ NK cells. (A) Expression distribution of each cluster (violin plots) using unstimulated cells only, looking at canonical human NK cell markers, grouped by cytotoxicity, inhibitory and activating receptors, cytokines and chemokines, cytokine and chemokine receptors, and adhesion molecules. The shape represents the distribution of cells based on their log(+1) expression values. The color scale represents the mean expression. (B) Percentage of individual NK cells expressing 1, 2, 3, or 4 different KIRs across each cluster, calculated using the full data set of 8462 cells. (C) Comparison of average gene expression values for cluster 0 and cluster 1 in unstimulated cells only. Genes with fold change >0.4 are highlighted. (D) Comparison of average gene expression values for clusters 0 and 1 between unstimulated and IL-2–stimulated cells. Genes with a fold change >0.5 and Bonferroni-corrected P < .05 are highlighted. (E) Selected GO terms using all conserved markers upregulated or downregulated within the individual clusters with an adjusted P < .05. (F) Dot plot (left) of selected markers of interest within unstimulated cells only across the different clusters. The size of the dot represents the percentage of cells expressing the markers, and the color encodes the average scaled expression values. Heat map (right) of the same markers of interest within unstimulated cells only. Clusters are plotted in columns, and genes are shown in rows. Gene expression is color coded using average scaled expression values per cluster, based on a z-score distribution, ranging from low expression (purple) to high expression (yellow). (G) Comparison of average gene expression values for cluster 2 between unstimulated and IL-2–stimulated cells. Genes with a fold change >0.5 and Bonferroni-corrected P < .05 are highlighted. (H) Selected GO terms using all conserved markers upregulated or downregulated within this cluster with an adjusted P < .05.
Figure 2.
Figure 2.
Among CD56dim CD16+ NK cells is a distinct subset of CD57+ NK cells. (A) Expression distribution of each cluster (violin plots) using unstimulated cells only, looking at canonical human NK cell markers, grouped by cytotoxicity, inhibitory and activating receptors, cytokines and chemokines, cytokine and chemokine receptors, and adhesion molecules. The shape represents the distribution of cells based on their log(+1) expression values. The color scale represents the mean expression. (B) Percentage of individual NK cells expressing 1, 2, 3, or 4 different KIRs across each cluster, calculated using the full data set of 8462 cells. (C) Comparison of average gene expression values for cluster 0 and cluster 1 in unstimulated cells only. Genes with fold change >0.4 are highlighted. (D) Comparison of average gene expression values for clusters 0 and 1 between unstimulated and IL-2–stimulated cells. Genes with a fold change >0.5 and Bonferroni-corrected P < .05 are highlighted. (E) Selected GO terms using all conserved markers upregulated or downregulated within the individual clusters with an adjusted P < .05. (F) Dot plot (left) of selected markers of interest within unstimulated cells only across the different clusters. The size of the dot represents the percentage of cells expressing the markers, and the color encodes the average scaled expression values. Heat map (right) of the same markers of interest within unstimulated cells only. Clusters are plotted in columns, and genes are shown in rows. Gene expression is color coded using average scaled expression values per cluster, based on a z-score distribution, ranging from low expression (purple) to high expression (yellow). (G) Comparison of average gene expression values for cluster 2 between unstimulated and IL-2–stimulated cells. Genes with a fold change >0.5 and Bonferroni-corrected P < .05 are highlighted. (H) Selected GO terms using all conserved markers upregulated or downregulated within this cluster with an adjusted P < .05.
Figure 3.
Figure 3.
CD56bright NK cells respond most potently to IL-2 stimulation. (A) Dot plot (left) of selected markers of interest within unstimulated cells only (columns) across the different clusters (rows). The size of the dot represents the percentage of cells expressing the markers, and the color encodes the average scaled expression values. Heat map (right) of the same markers of interest within unstimulated cells only. Clusters are plotted in columns, and genes are shown in rows. Gene expression is color coded using average scaled expression values per cluster, based on a z-score distribution, ranging from low expression (purple) to high expression (yellow). (B) Comparison of average gene expression values for cluster 4 between unstimulated and IL-2–stimulated cells. Genes with a fold change >0.5 and Bonferroni-corrected P < .05 are highlighted. (C) Selected GO terms using all conserved markers upregulated or downregulated within this cluster with an adjusted P < .05. (D) Module scores for each NK cell cluster at the single-cell level, defined using the top 100 markers from bulk expression profiles of sorted CD56dimCD16+ and CD56brightCD16 NK cells. Module scores were calculated for unstimulated cells only. CD56dim module score (left), CD56bright module score (middle), and custom CD56bright module score, excluding CTSW, DUSP1, JUN, FOS and CD69 (right). Violin plots represent the distribution of the module scores for each cluster, and the error bars represent the median and interquartile range. One-way analysis of variance with Bonferroni’s multiple comparison. Nonsignificant (n.s) P > .05; *P < .03; **P < .02; ***P < .0002; ****P < .0001.
Figure 4.
Figure 4.
A fraction of peripheral blood NK cells is a population of type I IFN-responding cells. (A) Dot plot (left) of selected markers of interest within unstimulated cells only (columns) across the different clusters (rows). The size of the dot represents the percentage of cells expressing the markers, and the color encodes the average scaled expression values. Heat map (right) of same markers of interest within unstimulated cells only. Clusters are plotted in columns, and genes are shown in rows. Gene expression is color coded using average scaled expression values per cluster, based on a z-score distribution, ranging from low expression (purple) to high expression (yellow). (B) Comparison of average gene expression values (calculated in unstimulated cells only) for cluster 3 and grouped CD56dim clusters (clusters 0, 1, and 2). The markers shown differentiate CD56neg and CD56dim blood NK cells by flow cytometry. *Markers that are not consistent with flow cytometry. (C) Comparison of average gene expression values for cluster 3 between unstimulated and IL-2–stimulated cells. Genes with a fold change >0.5 and Bonferroni-corrected P < .05 are highlighted. (D) Heat map (right) of top 20 markers which define cluster 3 within unstimulated cells only. Format and expression scale are as described for the heat map in panel A. (E) Selected GO terms using all conserved markers upregulated or downregulated within this cluster with an adjusted P < .05.
Figure 5.
Figure 5.
A small fraction of peripheral blood NK cells displays a cytokine-induced memory-like phenotype. (A) Dot plot (left) of selected markers of interest within unstimulated cells only (columns) across the different clusters (rows). The size of the dot represents the percentage of cells expressing the markers, and the color encodes the average scaled expression values. Heat map (right) of the same markers of interest within unstimulated cells only. Clusters are plotted in columns, and genes are shown in rows. Gene expression is color coded, using average scaled expression values per cluster, based on a z-score distribution, ranging from low expression (purple) to high expression (yellow). (B) Expression distribution of each cluster and stimulation condition (violin plots) specifically of granzyme B (GZMB) expression. The shape represents the distribution of cells based on their log(+1) expression values. The color scale represents the mean expression. (C) Module score for each NK cell cluster at the single-cell level, defined using CIML markers. Module scores were calculated for unstimulated cells only. Violin plots represent the distribution of the module scores for each cluster, and the error bars represent median and interquartile range. One-way analysis of variance with Bonferroni’s multiple comparison. Nonsignificant (n.s) P > .05; *P < .03; **P < .02; ***P < .0002; ****P < .0001. (D) Comparison of average gene expression values for cluster 6 between unstimulated and IL-2–stimulated cells. Genes with a fold change >0.5 and Bonferroni-corrected P < .05 are highlighted. (E) Selected GO terms using all conserved markers upregulated within this cluster with an adjusted P < .05. No markers were downregulated within this cluster at this significance threshold.
Figure 6.
Figure 6.
A small, novel population of blood NK cells exhibits loss of ribosomal expression. (A) Same heat map of the top 20 markers distinguishing each NK cell cluster as shown in Figure 1D, highlighting the similarities (blue boxes) and dissimilarity (red box) between clusters 2 and 8. Cells are plotted in columns, and genes are shown in rows. Gene expression is color coded using a scale based on z-score distribution, ranging from low expression (purple) to high expression (yellow). (B) Dot plot (left) of 20 top markers associated with cluster 8 within unstimulated cells only (columns) across the different clusters (rows). The size of the dot represents the percentage of cells expressing the markers, whereas the color encodes the average scaled expression values. Heat map (right) of the same markers of interest within unstimulated cells only. Clusters are plotted in columns, and genes are shown in rows. The gene expression scale is as in panel A. (C) Module score analysis for each NK cell cluster at the single-cell level, defined using markers of mammalian autophagy. Module scores were calculated for unstimulated cells only. Violin plots represent the distribution of the module scores for each cluster and the error bars represent median and interquartile range. One-way analysis of variance with Bonferroni’s multiple comparison. Nonsignificant (n.s) P > .05; *P < .03; **P < .02; ***P < .0002; ****P < .0001. (D) tSNE plot (excluding clusters 5, 7, and 9), showing the expression of selected autophagy markers within the full data set. Expression is color coded from blue (low) to red (high) and cells positively expressing a marker were brought toward the front of the plot. (E) Selected GO terms using all conserved markers downregulated within this cluster with an adjusted P < .05. No markers were upregulated within this cluster at this significance threshold. (F) tSNE, 2-dimensional plot of 1000 NK cells from the unstimulated condition (500 randomly selected from each donor). The analysis was performed using the first 15 principle components and a resolution of 0.4. The top markers positively associated with each cluster are highlighted. (G) The same tSNE plot as in panel F) but cells are color coded according to the cluster identities assigned using the full data set of 8462 cells.
Figure 6.
Figure 6.
A small, novel population of blood NK cells exhibits loss of ribosomal expression. (A) Same heat map of the top 20 markers distinguishing each NK cell cluster as shown in Figure 1D, highlighting the similarities (blue boxes) and dissimilarity (red box) between clusters 2 and 8. Cells are plotted in columns, and genes are shown in rows. Gene expression is color coded using a scale based on z-score distribution, ranging from low expression (purple) to high expression (yellow). (B) Dot plot (left) of 20 top markers associated with cluster 8 within unstimulated cells only (columns) across the different clusters (rows). The size of the dot represents the percentage of cells expressing the markers, whereas the color encodes the average scaled expression values. Heat map (right) of the same markers of interest within unstimulated cells only. Clusters are plotted in columns, and genes are shown in rows. The gene expression scale is as in panel A. (C) Module score analysis for each NK cell cluster at the single-cell level, defined using markers of mammalian autophagy. Module scores were calculated for unstimulated cells only. Violin plots represent the distribution of the module scores for each cluster and the error bars represent median and interquartile range. One-way analysis of variance with Bonferroni’s multiple comparison. Nonsignificant (n.s) P > .05; *P < .03; **P < .02; ***P < .0002; ****P < .0001. (D) tSNE plot (excluding clusters 5, 7, and 9), showing the expression of selected autophagy markers within the full data set. Expression is color coded from blue (low) to red (high) and cells positively expressing a marker were brought toward the front of the plot. (E) Selected GO terms using all conserved markers downregulated within this cluster with an adjusted P < .05. No markers were upregulated within this cluster at this significance threshold. (F) tSNE, 2-dimensional plot of 1000 NK cells from the unstimulated condition (500 randomly selected from each donor). The analysis was performed using the first 15 principle components and a resolution of 0.4. The top markers positively associated with each cluster are highlighted. (G) The same tSNE plot as in panel F) but cells are color coded according to the cluster identities assigned using the full data set of 8462 cells.
Figure 7.
Figure 7.
Peripheral blood NK cells from CMV+ individuals have several altered features. (A) tSNE, 2-dimensional plot of 8000 individual NK cells, with clusters (A-K) identified using unsupervised hierarchical clustering. (B) Mean percentage of CMV and CMV+ cells contributing toward each cluster. (C) Heat map of canonical adaptive NK cell markers and markers that distinguish this cluster from other cells. Clusters are plotted in columns, and genes are shown in rows. Gene expression is color coded using average scaled expression values per cluster, based on a z-score distribution, ranging from low expression (purple) to high expression (yellow). (D) Selected GO terms using all markers upregulated within cluster C, adaptive NK cells, with an adjusted P < .05. (E) Within cluster A, CD56dim NK cells, comparison of average gene expression values for CMV cells and CMV+ cells. Genes with a fold-change >1 are highlighted. (F) Summary schematic of NK cell populations identified by scRNA-seq. Markers highlighted in red represent downregulation within that population. Of note, the schematic is based on transcript levels that may not entirely correlate with protein expression.

References

    1. Mace EM, Orange JS. Emerging insights into human health and NK cell biology from the study of NK cell deficiencies. Immunol Rev. 2019;287(1):202-225. - PMC - PubMed
    1. Chiossone L, Dumas PY, Vienne M, Vivier E. Natural killer cells and other innate lymphoid cells in cancer [published correction appears in Nat Rev Innunol. 2018;18:726]. Nat Rev Immunol. 2018;18(11):671-688. - PubMed
    1. Ogbomo H, Mody CH. Granule-dependent natural killer cell cytotoxicity to fungal pathogens. Front Immunol. 2017;7:692. - PMC - PubMed
    1. Wolf AS, Sherratt S, Riley EM. NK cells: Uncertain allies against malaria. Front Immunol. 2017;8:212. - PMC - PubMed
    1. Horowitz A, Stegmann KA, Riley EM. Activation of natural killer cells during microbial infections. Front Immunol. 2012;2:88. - PMC - PubMed

Publication types