. 2020 May 8;6(5):1058-1075.
doi: 10.1021/acsinfecdis.9b00455. Epub 2020 Apr 24.

Disruption of the Plasmodium falciparum Life Cycle through Transcriptional Reprogramming by Inhibitors of Jumonji Demethylases

Affiliations

Disruption of the Plasmodium falciparum Life Cycle through Transcriptional Reprogramming by Inhibitors of Jumonji Demethylases

Krista A Matthews et al. ACS Infect Dis. .

Abstract

Little is known about the role of the three Jumonji C (JmjC) enzymes in Plasmodium falciparum (Pf). Here, we show that JIB-04 and other established inhibitors of mammalian JmjC histone demethylases kill asexual blood stage parasites and are even more potent at blocking gametocyte development and gamete formation. In late stage parasites, JIB-04 increased levels of trimethylated lysine residues on histones, suggesting the inhibition of P. falciparum Jumonji demethylase activity. These epigenetic defects coincide with deregulation of invasion, cell motor, and sexual development gene programs, including gene targets coregulated by the PfAP2-I transcription factor and chromatin-binding factor, PfBDP1. Mechanistically, we demonstrate that PfJmj3 converts 2-oxoglutarate to succinate in an iron-dependent manner consistent with mammalian Jumonji enzymes, and this catalytic activity is inhibited by JIB-04 and other Jumonji inhibitors. Our pharmacological studies of Jumonji activity in the malaria parasite provide evidence that inhibition of these enzymatic activities is detrimental to the parasite.

Keywords: JIB-04; Jumonji inhibitors; Plasmodium falciparum; demethylases; gametocytes; malaria; transcriptional reprogramming.


Conflict of interest statement

The authors declare no competing financial interest.

Figures
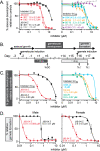
Figure 1
Figure 1
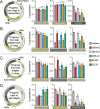
Jumonji inhibitors are active against asexual erythrocytic growth and potently block  P. falciparum gametocyte development and gamete formation. Representative Jumonji inhibitor concentration curves against (A) asexual development, (C) gametocyte development, and (D) gamete formation. (A) 3D7 (solid line) or Dd2 (dashed line) asexual parasites synchronized to rings were treated with JIB-04 E (red circles) and Z (black squares) isomers (left panel) or GSK-J4 (cyan circles), ML324 (orange triangles), SD-70 (green squares), CPI-455 (gray inverted triangles), and KDM5-C70 (purple diamonds) (right panel). Asexual development was measured using the standard 3 day growth assay as described in the Materials and Methods and is presented as a percent of vehicle-treated controls. (B) Schematic of gametocyte and gamete induction relative to inhibitor exposure. Synchronized asexual parasites were cultured at high parasitemia on day −2 to induce gametocytogenesis. For the development assays (dark gray boxes), gametocytes were exposed to the inhibitor starting on day +1 through day +6. Parasitemia (%PT) and gametocytemia (%GC) were measured by flow cytometry as described in the Materials and Methods. For gamete formation assays (light gray boxes), inhibitor was added to stage V gametocytes for 48 h prior to induction on day +14. Male exflagellation (%♂) and female gamete formation (%♀) was measured on day +16 and day +17, respectively, as described in the Materials and Methods. (C) Representative concentration curves of JIB-04 E and Z (left panel) and other Jumonji inhibitors (right panel) against gametocyte development relative to vehicle controls. (D) Representative concentration curves of JIB-04 E and Z against male (left panel) and female (right panel) gamete formation relative to vehicle controls. Nonlinear regression curves ([inhibitor] vs response – variable slope (four parameters)) were fit to the data using GraphPad Prism v8. Error bars represent the standard deviation of technical triplicates. EC50 concentrations (μM) are presented as mean ± SEM of the fitted inhibition curves from three or more independent experiments.
Figure 2
Figure 2
Exposure of ring or late stage asexual parasites to Jumonji inhibitors significantly impairs parasite development through IDC. Synchronized (A, B) ring parasites or (C, D) trophozoite parasites were grown in the presence of 1× EC50 concentrations of Jumonji inhibitors for 48 h. Quantification of parasite progression after 24 h exposure (A, C) and 48 h exposure (B, D) was monitored by flow cytometry and Giemsa stained thin blood smears as shown by the representative dot plots and images in Figure S3. Ring, trophozoite, and schizont parasites are gated as described in the Materials and Methods. Bar graphs present the mean ± SD of rings, trophozoites, and schizonts as % parasitemia of triplicate wells from one of two independent experiments. p values are calculated using a t test between vehicle- and inhibitor-treated samples. n.s., nonsignificant; *, p < 0.05; **, p < 0.01; ***, p < 0.001.
Figure 3
Figure 3
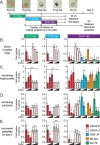
Transient exposure to JIB-04 E impairs development at all stages throughout the IDC with long-term consequences. (A) Schematic of the experimental setup. Tightly synchronized parasites were exposed to the vehicle or 1.5, 7.5, or 15 μM JIB-04 E (corresponding to 1×, 5×, or 10× EC50 from Figure 1) or inactive Z isomer during one of three 12 h periods: 5 to 17 hpi (green), 17 to 29 hpi (cyan), or 29 to 41 hpi (purple). Additional Jumonji inhibitors (GSK-J4, ML324, and SD-70) were only tested during the 29 to 41 hpi treatment period at 1×, 5×, or 10× EC50. After the 12 h incubation, parasites were extensively washed to remove drug and returned to the incubator to continue growth. (B–D) Progression through and completion of (reinvasion) the IDC was measured at 50 hpi by flow cytometry as described in the Materials and Methods. (B) Newly invaded rings and (C) remaining trophozoite and (D) schizont parasites that failed to complete the IDC are presented as the fold change relative to vehicle-treated parasites. (E) At the end of each treatment period, a 1:40 dilution of washed parasites was transferred into fresh RBCs and media and cultured for two additional life cycles. Surviving parasites were measured on day 5 by flow cytometry, and data are presented as the fold change relative to vehicle-treated parasites. Data represent the mean ± SEM of 3–6 independent experiments. p values are calculated using a t test between vehicle- and inhibitor-treated samples. ns, nonsignificant; *, p < 0.05; **, p < 0.01; ***, p < 0.001.
Figure 4
Figure 4
Jumonji inhibitors block the enzymatic activity of recombinant PfJmj3. (A) Purity of wild-type and catalytically dead (HDH > AAA) recombinant PfJmj3 as assessed by Coomassie staining. (B) Representative concentration curves of PfJmj3 enzymatic activity. Succinate formation is measured indirectly through a luciferase-coupled reaction (relative luciferase units (RLUs)). Wild-type PfJmj3, but not heat inactivated wild-type or the catalytically dead HDH > AAA mutant, converts 2-OG to succinate in the presence of Fe(II), ascorbate, and O2. Data are presented as the mean ± SD of two technical replicates from 1 of 3 independent experiments. (C) Succinate formation by PfJmj3 is dependent upon ascorbate, Fe(II), and 2-OG. Data are presented as a percent of wild-type and represent the mean ± SEM of 3–9 independent experiments. p values are calculated using a t test between vehicle- and inhibitor-treated samples. ns, nonsignificant; *, p < 0.05; **, p < 0.01; ***, p < 0.001. (D) Jumonji inhibitors block the formation of succinate by PfJmj3 in a dose-dependent manner under assay conditions. Data are presented as a percent of the vehicle control and represent the mean ± SD of two technical replicates from 1 of 4–5 independent experiments. IC50 concentrations (μM) are the mean ± SEM of the fitted inhibition curves ([inhibitor] vs response – variable slope (four parameters)) from 4 to 5 independent experiments using GraphPad Prism v8.
Figure 5
Figure 5
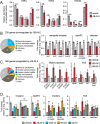
JIB-04 E increases global trimethylated histone marks and deregulates transcription in the IDC. (A) Relative abundance of histone methylation on H3K4, H3K9, and H4K20 in 29 hpi parasites treated with vehicle or 4.5 μM JIB-04 E for 6 h. Bar graphs represent the mean ± SEM of three biological replicates. p values are calculated using a t test between vehicle- and inhibitor-treated samples. (B, C) Functional categorization of genes whose expression levels are deregulated by JIB-04 E on the basis of gene ontology analysis and literature review. See also Table S3. Examples of genes (B) down- or (C) upregulated in 29 hpi parasites treated for 6 h with 4.5 μM JIB-04 E compared to the vehicle and Z isomer. Data are presented as the fold change relative to vehicle-treated controls (mean ± SEM of four replicates). p values are calculated using a t test between vehicle- and inhibitor-treated samples. (D) qRT-PCR analysis of select genes from 29 hpi parasites treated with vehicle or 3× EC50 concentrations of Jumonji inhibitors for 6 h as above. Data are presented as the mean ± SEM of the fold change relative to vehicle-treated controls from three biological replicates. p values are calculated using a t test between vehicle- and inhibitor-treated samples. n.s., nonsignificant; *, p < 0.05; **, p < 0.01; ***, p < 0.001.
Figure 6
Figure 6
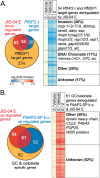
JIB-04 E deregulates genes that overlap known invasion and gametocyte transcription- and chromatin-binding factor targets. (A) Venn diagrams of genes downregulated by JIB-04 E (red) that overlap with PfBDP-1 (orange) and PfAP2-I (blue) target genes. Heat map showing the differential expression between JIB-04 E and the controls of the 54 genes common to all three groups. See also Table S3 and S4. (B) Venn diagrams showing the overlap of genes upregulated by JIB-04 E (red) with gametocyte and ookinete-specific genes (orange) and genes upregulated in P. berghei schizonts lacking PbAP2-SP (blue). Heat map showing the differential expression between JIB-04 E and the controls of the 61 genes common to all three groups. See also Tables S3 and S4.

Similar articles

Cited by

References

    1. WHO (2018) World malaria report 2018, WHO, Geneva.
    1. Merrick C. J.; Duraisingh M. T. (2010) Epigenetics in Plasmodium: what do we really know?. Eukaryotic Cell 9 (8), 1150–8. 10.1128/EC.00093-10. - DOI - PMC - PubMed
    1. Rovira-Graells N.; Gupta A. P.; Planet E.; Crowley V. M.; Mok S.; Ribas de Pouplana L.; Preiser P. R.; Bozdech Z.; Cortes A. (2012) Transcriptional variation in the malaria parasite Plasmodium falciparum. Genome Res. 22 (5), 925–38. 10.1101/gr.129692.111. - DOI - PMC - PubMed
    1. Flueck C.; Bartfai R.; Volz J.; Niederwieser I.; Salcedo-Amaya A. M.; Alako B. T.; Ehlgen F.; Ralph S. A.; Cowman A. F.; Bozdech Z.; Stunnenberg H. G.; Voss T. S. (2009) Plasmodium falciparum heterochromatin protein 1 marks genomic loci linked to phenotypic variation of exported virulence factors. PLoS Pathog. 5 (9), e1000569.10.1371/journal.ppat.1000569. - DOI - PMC - PubMed
    1. Lopez-Rubio J. J.; Mancio-Silva L.; Scherf A. (2009) Genome-wide analysis of heterochromatin associates clonally variant gene regulation with perinuclear repressive centers in malaria parasites. Cell Host Microbe 5 (2), 179–90. 10.1016/j.chom.2008.12.012. - DOI - PubMed

Publication types

MeSH terms