. 2020 Jun 3;106(5):743-758.e5.
doi: 10.1016/j.neuron.2020.03.011. Epub 2020 Apr 8.

Transcriptional and Spatial Resolution of Cell Types in the Mammalian Habenula

Affiliations

Transcriptional and Spatial Resolution of Cell Types in the Mammalian Habenula

Yoshiko Hashikawa et al. Neuron. .

Abstract

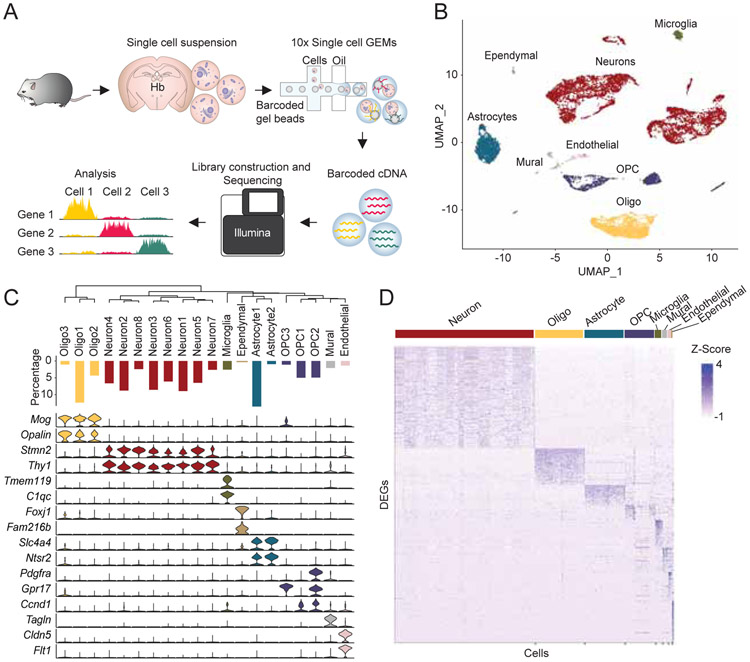
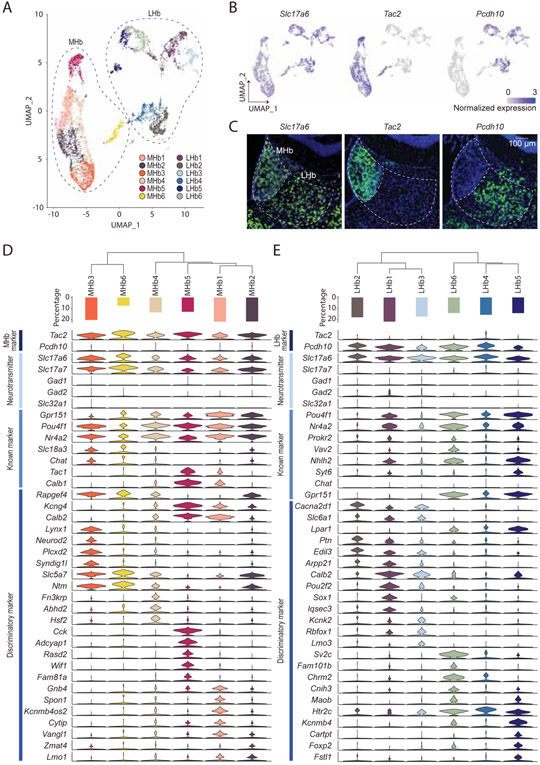
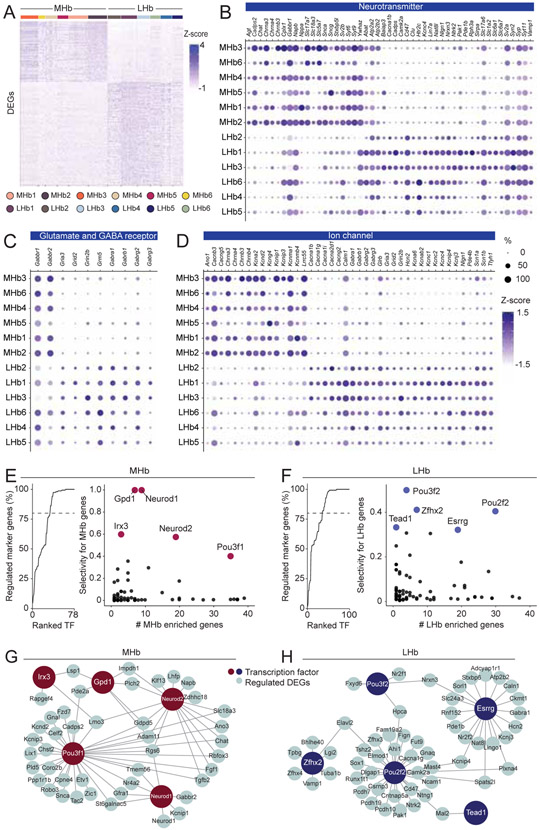
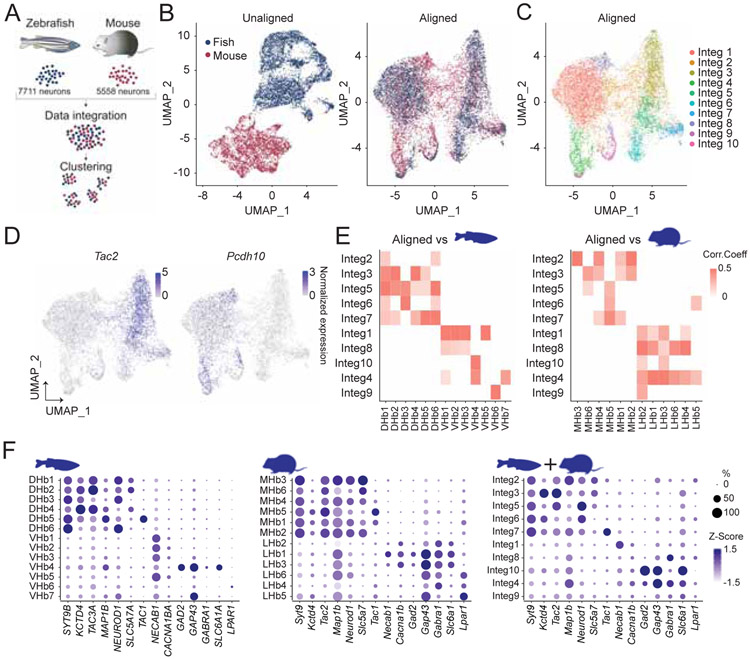
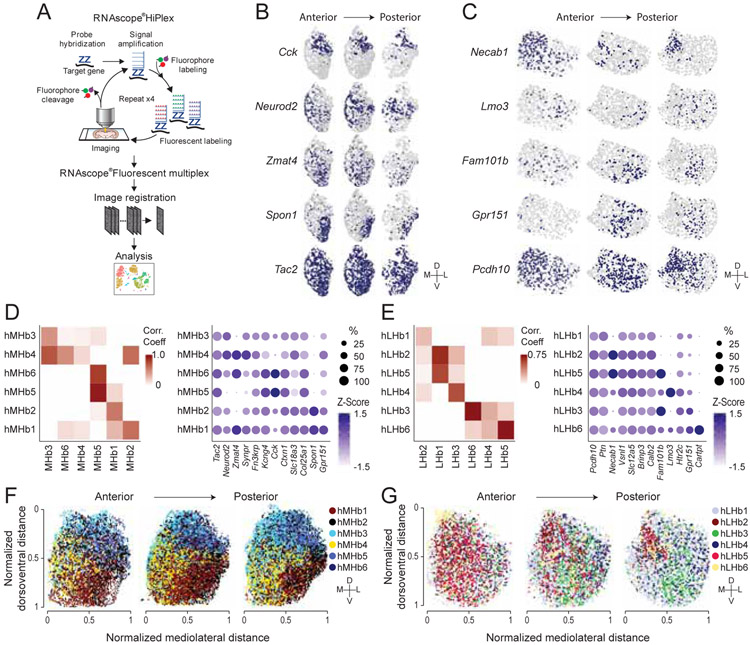
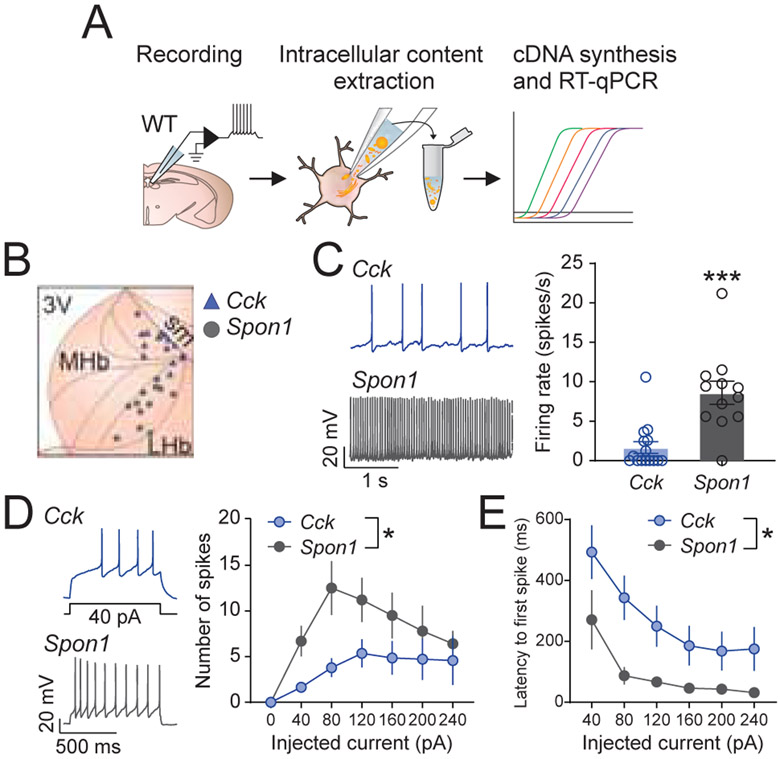
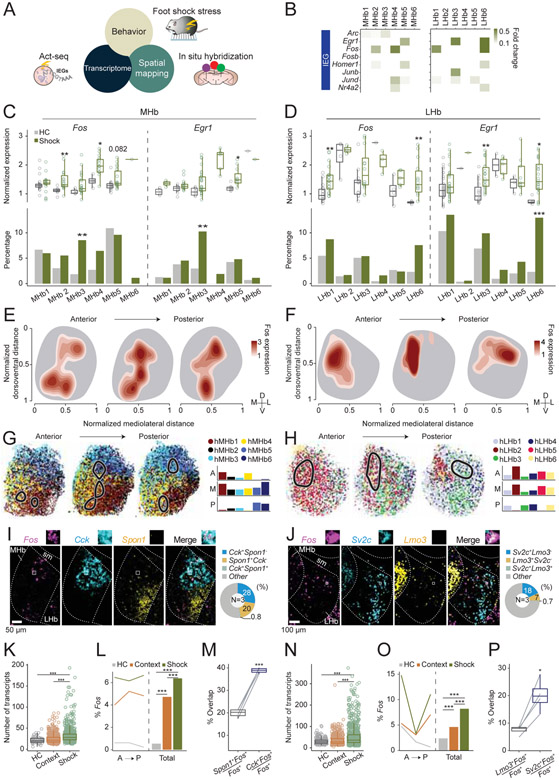
The habenula complex is appreciated as a critical regulator of motivated and pathological behavioral states via its output to midbrain nuclei. Despite this, transcriptional definition of cell populations that comprise both the medial habenular (MHb) and lateral habenular (LHb) subregions in mammals remain undefined. To resolve this, we performed single-cell transcriptional profiling and highly multiplexed in situ hybridization experiments of the mouse habenula complex in naive mice and those exposed to an acute aversive stimulus. Transcriptionally distinct neuronal cell types identified within the MHb and LHb, were spatially defined, differentially engaged by aversive stimuli, and had distinct electrophysiological properties. Cell types identified in mice also displayed a high degree of transcriptional similarity to those previously described in zebrafish, highlighting the well-conserved nature of habenular cell types across the phylum. These data identify key molecular targets within habenular cell types and provide a critical resource for future studies.

Keywords: Act-seq; Habenula; HiPlex; SCENIC; Seurat; cross-species analysis; gene ontology analysis; mouse; scRNA-seq; zebrafish.


Conflict of interest statement

Declaration of Interests The authors declare no competing interests.

Figures

Figure 1.
Figure 1.. Single cell RNAseq analysis on mammalian habenula.
A. Schematic of scRNAseq experiments. B. UMAP dimensional reduction and visualization of transcriptional profiles of 11,878 habenular cells. C. Top: dendrogram showing relationships between clusters. Middle: proportions of cells in each cluster. Bottom: violin plots showing levels of expression of canonical marker genes in neuronal and non-neuronal cells. D. Heat map showing scaled expression of all marker genes in each cell class (e.g. Neuron). Related to Figure S1.
Figure 2.
Figure 2.. Transcriptional clusters of habenula neurons.
A. UMAP visualization of 12 MHb or LHb neuronal clusters. 4 peri-habenula clusters were removed. B. Expression plots in UMAP space illustrating normalized expression values of Slc17a6, Tac2 and Pcdh10. C. Representative FISH images for Slc17a6, Tac2 and Pcdh10 in and around the habenula. Scale bar: 100 μm. D and E. D and E correspond to the MHb and LHb respectively. Top: dendrogram showing relationships between clusters. Middle: proportions of cells in each cluster. Bottom: violin plots showing levels of expression of genes including entire MHb and/or LHb markers, major fast neurotransmitters, known markers and discriminatory markers in each cluster. Related to Figure S2 and Table S1.
Figure 3.
Figure 3.. Comparative analysis of transcriptions and their regulations between the MHb and the LHb.
A. Heat map showing scaled expression of all marker genes for entire MHb clusters or LHb clusters. B, C and D. Dot plot illustrating scaled expression levels (color) and the proportions of expressing cells (dot size) of Neurotransmitter related genes (B), Glutamate and GABA receptor related genes (C) and Ion Channel related genes (D) in each MHb and LHb cluster. E and F. Left: Cumulative percentage of MHb (E) or LHb (F) marker genes regulated by transcription factors (TF) sorted by their selectivity to regulate marker genes. Right: Scatter plot showing the number of marker genes regulated by transcription factors (only TFs regulating <40 markers are shown) and the selectivity of gene regulation for marker genes. 5 genes with highest selectivity scores were highlighted. G and H. Schematic illustrating the regulation of marker genes by 5 TFs of high selectivity in the MHb (G) and the LHb (H). Related to Figure S3.
Figure 4.
Figure 4.. Integrative cross-species analysis on transcriptomes of mouse and fish habenula.
A. Schematics illustrating integrative cross species analysis of mouse and zebrafish transcriptional profiles of habenula neurons. B. UMAP dimensional reduction of transcriptional profile of jointly analyzed zebrafish and mice habenula neurons without alignment (Left) and with Seurat V3 alignment (Right). C. UMAP visualization of 10 clusters of jointly analyzed neurons. D. Expression plots showing normalized expression values for Tac2 and Pcdh10 in the UMAP space. E. Heatmap illustrating Pearson correlations between integrated clusters and zebrafish clusters (Left) and between integrated clusters and mouse clusters (Right). White, p>0.05 or correlation value<0. F. Dot plot showing scaled expression levels (color) and the proportion of expressing cells (dot size) of marker genes in zebrafish (Left), mouse (Middle) and integrated (Right) clusters. Related to Figure S4.
Figure 5.
Figure 5.. Visualization of habenular transcriptional cell types in situ.
A. Schematic illustrating experimental design of HiPlex FISH. B and C. Representative ROI images showing in situ expressions of genes targeting the MHb (B) and the LHb (C). D and E. Left: Heatmap showing Pearson correlations between HiPlex clusters and scRNAseq clusters of MHb (D) and LHb (E). White, correlation value<0. Right: Dot plot illustrating the expression levels (color) and the proportions of expressing cells (dot size) of marker genes in MHb (D) and LHb (E) HiPlex clusters. F and G. Spatial distributions of MHb (F) and LHb (G) HiPlex clusters along anterior posterior axis. Related to Figure S5.
Figure 6.
Figure 6.. Electrophysiological properties of transcriptionally defined neurons in the MHb.
A. Schematic illustrating experimental design of slice physiology experiments from molecularly defined MHb neurons. B. The spatial distributions of recorded cells. Blue: Cck (+) cells, grey: Spon1 (+) cells. C. Left: Example resting firing rate of Cck (+) (top) and Spon1 (+) (bottom) cells recorded in whole cell mode. Right: Basal firing rate was higher for Spon1 (+) cells (t-test with Welch’s correction for unequal variance: t(16.46) = 4.24, p=0.0006). D. Left: Example of Cck (+) (top) and Spon1 (+) (bottom) cells’ traces during 40 pA current injection. Right: Spon1 (+) cells spiked more in response to current injection (40 pA steps, 800 ms duration). Two-way repeated measures ANOVA [Current x Cell Type]: Main effect of Current, F(6,132)=7.99, p<0.001; Main Effect of Cell Type, F(1,22)=4.70, p=0.041; No Current x Cell Type interaction, F(6,132)=1.94, p=0.079. E. Spon1 (+) cells exhibited a shorter latency to spike during current injections. Two-way repeated measures ANOVA [Current x Cell Type]: Main effect of Current, F(5,100)=11.31, p<0.001; Main Effect of Cell Type, F(1,20)=7.35, p=0.014; No Current x Cell Type interaction, F(5,100)=0.66, p=0.65. Related to Figure S6.
Figure 7.
Figure 7.. Activation of habenular clusters by aversive stimulus.
A. Act-seq (B-D) and multiplexed FISH (E-P) were used to identify transcriptionally defined populations responsive to aversive stimulus. B. Heatmap illustrating log fold changes in expression levels of various IEGs at each cell type comparing shock and home cage groups. White, p>0.05 or fold change<0.1. C, D. Comparison of Fos and Egr1 expression values in the expressing cells (Top) and the proportions of expressing cells (Bottom) between home cage and shock groups in the scRNAseq experiments (C: MHb and D: LHb). Wilcoxon rank sum test (Top), and Fisher’s exact test (Bottom). *p <0.05, **p <0.01, ***p <0.001. E, F. Kernel density estimation maps of foot shock induced Fos expression in the MHb (E) and the LHb (F). The outlines of the MHb or the LHb were drawn based on the HiPlex experiments. G, H. Left: Fos dense areas in the Kernel density estimation maps (level>2.5; black line) were projected onto the maps of transcriptional clusters generated by HiPlex (Figure 5F,G) in the MHb (G) and the LHb (H). Right: The percentage of cells from each cluster, which were in the Fos dense area (level>2.5). I, J. Left: Representative images of Fos and various marker genes in the MHb (I) and the LHb (J). Right. Percentage of cells expressing marker genes. K, L, N, O. Comparisons of the numbers of Fos transcripts (K: MHb, N: LHb) or the percentage of Fos (+) cells (L:MHb, O: LHb) between home cage, context and foot shock groups. Wilcoxon rank sum test (K, N), and Fisher’s exact test (L, O). ***p <0.001. M, P. The percentage of Fos cells expressing various marker genes in the MHb (M) or in the LHb (P). Paired t-test. *p <0.05, ***p <0.001. Related to Figure S7.

References

    1. Agetsuma M, Aizawa H, Aoki T, Nakayama R, Takahoko M, Goto M, Sassa T, Amo R, Shiraki T, Kawakami K, et al. (2010). The habenula is crucial for experience-dependent modification of fear responses in zebrafish. Nat. Neurosci 13, 1354–1356. - PubMed
    1. Aibar S, González-Blas CB, Moerman T, Huynh-Thu VA, Imrichova H, Hulselmans G, Rambow F, Marine J-C, Geurts P, Aerts J, et al. (2017). SCENIC: single-cell regulatory network inference and clustering. Nat. Methods 14, 1083–1086. - PMC - PubMed
    1. Aizawa H, Bianco IH, Hamaoka T, Miyashita T, Uemura O, Concha ML, Russell C, Wilson SW, and Okamoto H (2005). Laterotopic Representation of Left-Right Information onto the Dorso-Ventral Axis of a Zebrafish Midbrain Target Nucleus. Curr. Biol 15, 238–243. - PMC - PubMed
    1. Aizawa H, Amo R, and Okamoto H (2011). Phylogeny and Ontogeny of the Habenular Structure. Front. Neurosci 5. - PMC - PubMed
    1. Aizawa H, Kobayashi M, Tanaka S, Fukai T, and Okamoto H (2012). Molecular characterization of the subnuclei in rat habenula. J. Comp. Neurol 520, 4051–4066. - PubMed

Publication types

MeSH terms