Review
. 2020 Apr 8;106(1):21-36.
doi: 10.1016/j.neuron.2020.01.031.

Circuitry Underlying Experience-Dependent Plasticity in the Mouse Visual System

Affiliations
Review

Circuitry Underlying Experience-Dependent Plasticity in the Mouse Visual System

Bryan M Hooks et al. Neuron. .

Erratum in

Abstract

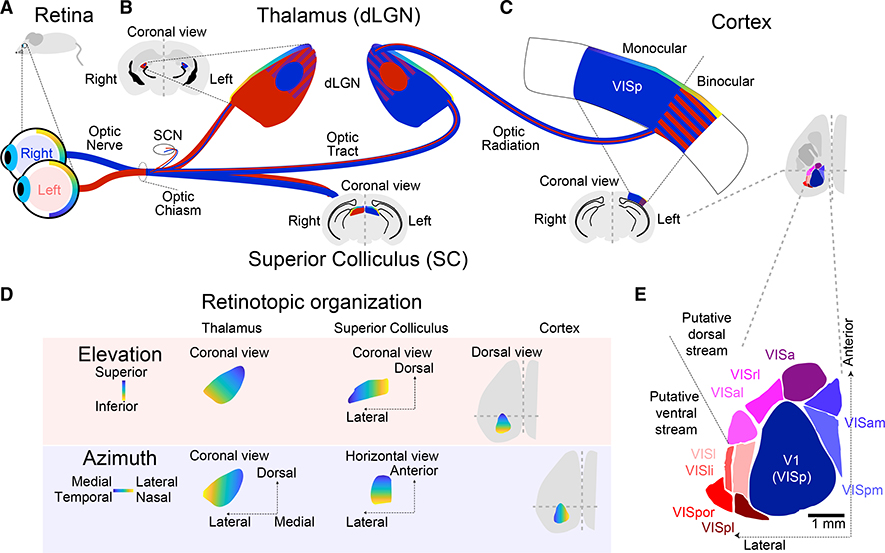
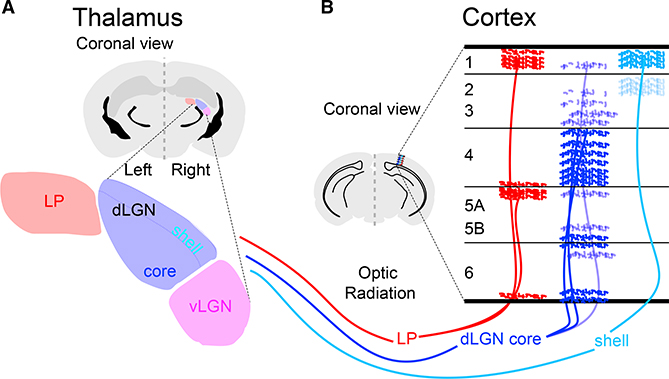
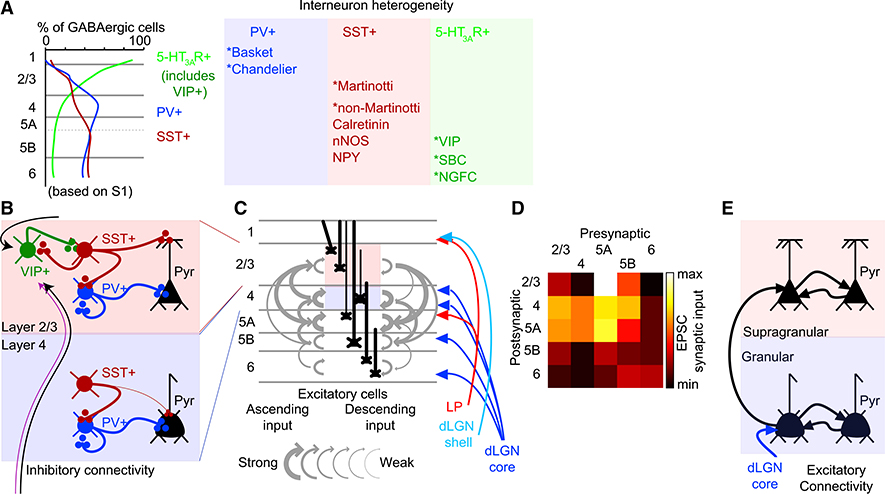
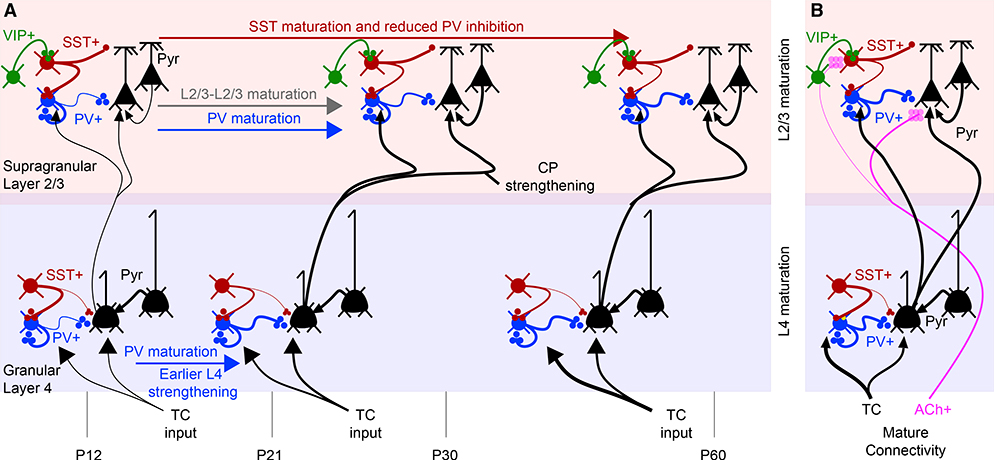
Since the discovery of ocular dominance plasticity, neuroscientists have understood that changes in visual experience during a discrete developmental time, the critical period, trigger robust changes in the visual cortex. State-of-the-art tools used to probe connectivity with cell-type-specific resolution have expanded the understanding of circuit changes underlying experience-dependent plasticity. Here, we review the visual circuitry of the mouse, describing projections from retina to thalamus, between thalamus and cortex, and within cortex. We discuss how visual circuit development leads to precise connectivity and identify synaptic loci, which can be altered by activity or experience. Plasticity extends to visual features beyond ocular dominance, involving subcortical and cortical regions, and connections between cortical inhibitory interneurons. Experience-dependent plasticity contributes to the alignment of networks spanning retina to thalamus to cortex. Disruption of this plasticity may underlie aberrant sensory processing in some neurodevelopmental disorders.

Keywords: binocular matching; cortical circuits; critical periods; inhibitory neurons; neurodevelopmental disorders; receptive field development; sensitive periods; sensory processing; synaptic plasticity; thalamus.


Figures

Figure 1.
Figure 1.. Ascending Pathways to Visual Cortex
(A) Visual information enters the brain via the retina. Retinotopy is represented by the yellow-blue gradient, corresponding to (D). Output from the eyes is shown as red (left) and blue (right). (B) Output via the optic nerve projects to targets in the SCN, SC, and dLGN. Insets show SC and dLGN in coronal brain sections. Output crosses the midline to represent a given visual field in the contralateral thalamus and cortex. The right dLGN receives strong input from the left eye in rodents, whose eyes have reduced visual field overlap compared to binocular species such as primates. Retinal projections segregate into eye-specific layers (or zones) in adult dLGN. These then project to the cortex. Locations of neurons with binocular RFs are marked with red and blue stripes outside the ipsilateral patch. (C) Mouse primary visual cortex (V1 or VISp) is predominantly monocular, with a smaller binocular field. (D) Retinotopic organization in elevation and azimuth in dLGN (left), SC (center), and cortex (right) is preserved (Piscopo et al., 2013). (E) Higher-order visual cortex in mice includes 9 areas adjacent to V1. V1(VISp), primary visual area; VISa, anterior area; VISal, anterolateral visual area; VISam, anteromedial visual area; VISl, lateral visual area (also LM in some papers); VISli, laterointermediate area; VISpl, posterolateral visual area; VISpm, posteromedial visual area; VISpor, postrhinal area; VISrl, rostrolateral visual area. Scale bar: 1 mm. Structures in (A)–(E) not to relative scale.
Figure 2.
Figure 2.. Thalamocortical (TC) Organization
(A) Visual thalamus includes dorsal and ventral subdivisions (dLGN and vLGN, blue and purple). Core and shell areas of dLGN receive inputs from distinct RGC cell types. Higher-order visual thalamus includes LP (red). (B) Thalamic axons in V1 arborize in distinct cortical laminae.
Figure 3.
Figure 3.. Inhibitory and Excitatory Local Connectivity in Cortex
(A) Inhibitory interneurons vary in their laminar distribution across the cortex. 5-HT3AR+ neurons are concentrated in L1 and L2/3, including the VIP+ interneurons. PV+ and SST+ interneurons are present across all of the layers, except L1 (after Lee et al., 2010; Xu et al., 2010). Subtypes are highlighted in the table at right. (B) In L2/3, bipolar VIP+ interneurons disinhibit the cortex by specifically inhibiting SST+ neurons. SST+ cells tonically inhibit PV+ neurons and pyramidal (Pyr) neuron apical dendrites. Tonic inhibition is released when VIP+ neurons become active (Pfeffer et al., 2013). Input to VIP neurons (black and magenta arrows) may vary across cortical areas. Local inhibitory circuits differ in L4, where SST+ interneurons also inhibit PV+ cells, but VIP+ neurons are less abundant. (C and D) Major excitatory connections of the granular and supragranular visual cortex. The local excitatory circuit includes connections from excitatory cells in a given layer to those in nearby layers (Xu et al., 2016). Ascending (left) and descending projections (right), with thicknesses proportional to excitatory connection strength. Laminae targeted by thalamic input shown in blue and red. Strength is shown in the illustration (C) and as a connectivity matrix (D), with pre- and postsynaptic layers labeled. (E) Local excitatory connectivity in L2/3 and L4.
Figure 4.
Figure 4.. Developmental Changes in Cortical Connectivity Near the Critical Period (CP)
(A) For granular and supragranular layers, developmental changes in the connectivity of local circuits are illustrated. Excitatory neurons are illustrated in black. PV+ (blue), SST+ (burgundy), and VIP+ (green) inputs are color coded, along with neuromodulatory inputs such as acetylcholine (purple). Excitatory TC inputs are shown in black. Developmental age and time are annotated at the bottom. L4 changes in interneuron connectivity precede L2/3 changes (Jiang et al., 2010), with PV maturation in L2/3 correlated in time to CP onset and closure (Fagiolini et al., 2004). L2/3 connectivity matures during this period (Cossell et al., 2015; Ko et al., 2013). SST+ connectivity to PV+ neurons, initially strong, grows weaker during this time and loses sensitivity to cholinergic modulation (Yaeger et al., 2019). (B) Mature connectivity is summarized.
Figure 5.
Figure 5.. Developmental Changes in L4 Cortical Connectivity
Effect of visual deprivation (MD in monocular V1) on excitatory connectivity in L4. TC inputs to both PV+ and Pyr neurons weaken, while within-layer excitatory connections strengthen.
Figure 6.
Figure 6.. Time Course of Synaptic Changes Following Visual Deprivation
Timeline of changes during short periods around MD. Initial firing rates of excitatory L2/3 neurons fall for the deprived contralateral eye on a short timescale, but partially recover over 1 week (Frenkel and Bear, 2004; Mrsic-Flogel et al., 2007). The initial loss of responsiveness is attributed to Hebbian mechanisms, but the slower recovery involves some homeostatic changes as well. In contrast, non-deprived eye responses strengthen more slowly. The transient rapid change is associated with the loss of excitation to PV+ interneurons, which occurs as rapidly as 1 day and is associated with the loss of excitatory synaptic input to these cells (Kuhlman et al., 2013).
Figure 7.
Figure 7.. Functional Consequences of L2/3 CP Plasticity
(A) In early development, L2/3 Pyr neurons inherit their orientation selectivity (OS) from L4 inputs, not intralaminar L2/3 inputs. OS tuning curve is shown as solid lines above each L2/3 cell, with dotted lines reflecting heterogeneous OS preference of other L2/3 inputs. (B) During development, L2/3 neurons resolve into smaller L2/3 networks preferentially sharing OS preference (black and gray networks). This process occurs with developmental time, even during visual deprivation (Ko et al., 2014).
Figure 8.
Figure 8.. Developmental Changes in L2/3 Cortical Connectivity
(A) Timeline summarizes the developmental changes in the cholinergic innervation of L2/3. (B) Timeline emphasizing the effect of visual deprivation on PV and SST maturation. Manipulations such as dark rearing modulate CP onset by preventing PV maturation. Within-L2/3 excitatory connectivity is emphasized as a site of slow plasticity (over days; see Figure 7) for ODP and binocular matching. SST blockade prevents binocular matching.

References

    1. Antoine MW, Langberg T, Schnepel P, and Feldman DE (2019). Increased Excitation-Inhibition Ratio Stabilizes Synapse and Circuit Excitability in Four Autism Mouse Models. Neuron 101, 648–661.e4. - PMC - PubMed
    1. Antonini A, and Stryker MP (1993). Rapid remodeling of axonal arbors in the visual cortex. Science 260, 1819–1821. - PubMed
    1. Antonini A, Fagiolini M, and Stryker MP (1999). Anatomical correlates of functional plasticity in mouse visual cortex. J. Neurosci. 19, 4388–4406. - PMC - PubMed
    1. Arcaro MJ, Schade PF, Vincent JL, Ponce CR, and Livingstone MS (2017). Seeing faces is necessary for face-domain formation. Nat. Neurosci. 20, 1404–1412. - PMC - PubMed
    1. Arroyo ED, Fiole D, Mantri SS, Huang C, and Portera-Cailliau C (2019). Dendritic Spines in Early Postnatal Fragile X Mice Are Insensitive to Novel Sensory Experience. J. Neurosci. 39, 412–419. - PMC - PubMed

Publication types

MeSH terms

LinkOut - more resources