. 2020 Apr 7;25(7):1691.
doi: 10.3390/molecules25071691.

Influence of Carboxylate Anions on Phase Behavior of Choline Ionic Liquid Mixtures

Affiliations

Influence of Carboxylate Anions on Phase Behavior of Choline Ionic Liquid Mixtures

Fred Elhi et al. Molecules. .

Abstract

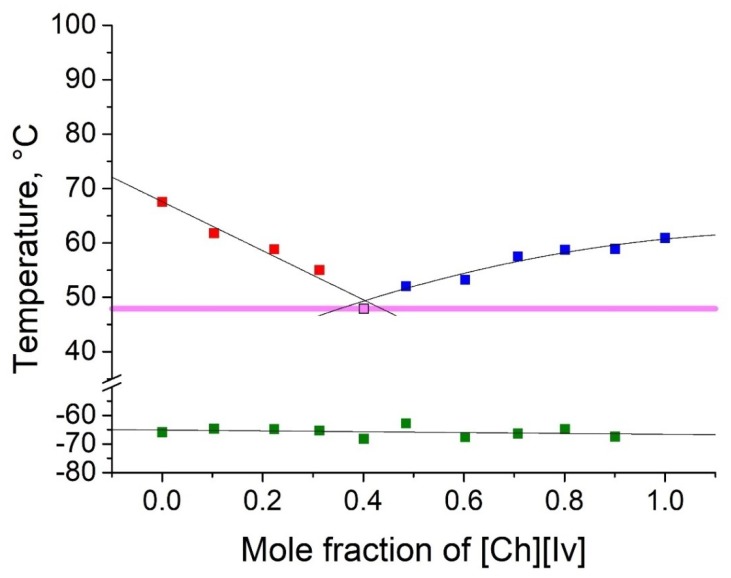
Mixing ionic liquids is a suitable strategy to tailor properties, e.g., to reduce melting points. The present study aims to widen the application range of low-toxic choline-based ionic liquids by studying eight binary phase diagrams of six different choline carboxylates. Five of them show eutectic points with melting points dropping by 13 to 45 °C. The eutectic mixtures of choline acetate and choline 2-methylbutarate were found to melt at 45 °C, which represents a remarkable melting point depression compared to the pure compounds with melting points of 81 (choline acetate) and 90 °C (choline 2-methylbutarate), respectively. Besides melting points, the thermal stabilities of the choline salt mixtures were investigated to define the thermal operation range for potential practical applications of these mixtures. Typical decomposition temperatures were found between 165 and 207 °C, with choline lactate exhibiting the highest thermal stability.

Keywords: choline; differential scanning calorimetry; eutectic mixture; ionic liquid; phase diagram.


Conflict of interest statement

The authors declare no conflict of interest. The funders had no role in the design of the study; in the collection, analyses, or interpretation of data; in the writing of the manuscript, or in the decision to publish the results.

Figures

Figure 1
Figure 1
Temperature composition phase diagram for the mixture of choline acetate ([Ch][Ac]) and choline isobutyrate ([Ch][Ib]), and their individual components at 0.0 and 1.0 mole fractions. Legend: —melting point of the excess component [Ch][Ac] in the mixture; —melting point of the excess component [Ch][Ib] in the mixture; —glass transition temperature; —eutectic point; eutectic transition line.
Figure 2
Figure 2
Temperature composition phase diagram for the mixture of [Ch][Ac] and choline 2-methylbutyrate ([Ch][2mb]), and their individual components at 0.0 and 1.0 mole fractions. Legend: —melting point of the excess component [Ch][Ac] in the mixture; —melting point of the excess component [Ch][2mb] in the mixture; —glass transition temperature; —eutectic point; eutectic transition line.
Figure 3
Figure 3
Temperature composition phase diagram for the mixture of [Ch][Ac] and choline isovalerate ([Ch][Iv]), and their individual components at 0.0 and 1.0 mole fractions. Legend: —melting point of the excess component [Ch][Ac] in the mixture; —melting point of the excess component [Ch][Iv] in the mixture; —glass transition temperature; —eutectic point; eutectic transition line.
Figure 4
Figure 4
Temperature-composition phase diagram for the mixture of [Ch][Ib] and [Ch][2mb], and their individual components at 0.0 and 1.0 mole fractions. Legend: —melting point of the excess component [Ch][Ib] in the mixture; —melting point of the excess component [Ch][2mb] in the mixture; —glass transition temperature; —eutectic point; eutectic transition line.
Figure 5
Figure 5
Temperature-composition phase diagram for the mixture of [Ch][Ib] and [Ch][Iv], and their individual components at 0.0 and 1.0 mole fractions. Legend: —melting point of the excess component [Ch][Ib] in the mixture; —melting point of the excess component [Ch][Iv] in the mixture; —glass transition temperature; —eutectic point; eutectic transition line.
Figure 6
Figure 6
Temperature-composition phase diagram for the mixture of [Ch][Ac] and choline malonate ([Ch][Mal]). Legend: —melting points of mixture and [Ch][Ac] component at 1.0 mole fraction; ▪—glass transition temperatures of the mixture and [Ch][Ac] component at 1.0 mole fraction.

References

    1. Xiao J., Chen G., Li N. Ionic Liquid Solutions as a Green Tool for the Extraction and Isolation of Natural Products. Molecules. 2018;23:1765. doi: 10.3390/molecules23071765. - DOI - PMC - PubMed
    1. MacFarlane D.R., Chong A.L., Forsyth M., Kar M., Vijayaraghavan R., Somers A., Pringle J.M. New dimensions in salt–solvent mixtures: A 4th evolution of ionic liquids. Faraday Discuss. 2018;206:9–28. doi: 10.1039/C7FD00189D. - DOI - PubMed
    1. Peng H., Wang S., Xu H., Dai G. Preparations, properties, and formation mechanism of novel cellulose hydrogel membrane based on ionic liquid. J. Appl. Polym. Sci. 2018;135:45488. doi: 10.1002/app.45488. - DOI
    1. Abbott A.P., Capper G., Davies D.L., Rasheed R.K., Tambyrajah V. Novel solvent properties of choline chloride/urea mixtures. Chem. Commun. 2003:70–71. doi: 10.1039/b210714g. - DOI - PubMed
    1. Smith E.L., Abbott A.P., Ryder K.S. Deep Eutectic Solvents (DESs) and Their Applications. Chem. Rev. 2014;114:11060–11082. doi: 10.1021/cr300162p. - DOI - PubMed

LinkOut - more resources