

Sales of Sugar-Sweetened Beverages in Australia: A Trend Analysis from 1997 to 2018
- PMID: 32272711
- PMCID: PMC7230225
- DOI: 10.3390/nu12041016
Sales of Sugar-Sweetened Beverages in Australia: A Trend Analysis from 1997 to 2018
Erratum in
-
Correction: Shrapnel, W.S.; Butcher, B.E. Sales of Sugar-Sweetened Beverages in Australia: A Trend Analysis from 1997 to 2018. Nutrients 2020, 12, 1016.Nutrients. 2021 Apr 19;13(4):1356. doi: 10.3390/nu13041356. Nutrients. 2021. PMID: 33921916 Free PMC article.
Abstract
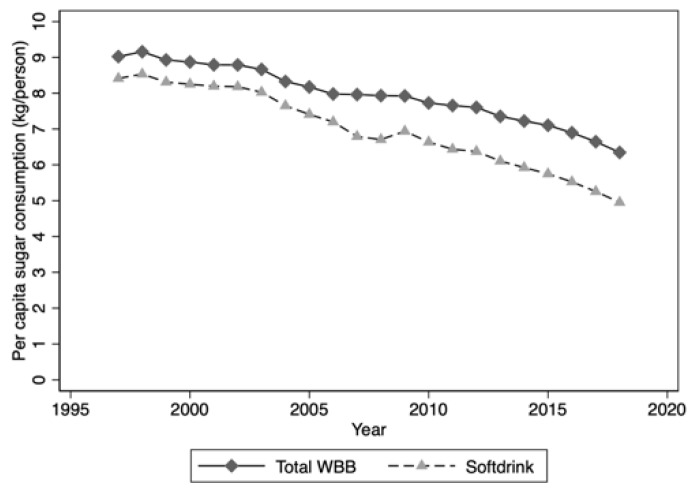
Lowering intake of sugar-sweetened beverages (SSBs) is being advocated as an obesity prevention strategy in Australia. The purpose of this study was to extend on previous reports of trends in national volume sales of SSBs. Data were extracted from commercially available datasets of beverage sales (AC Nielsen (1997-2011) and IRI Australia (2009-2018)). Linear regression was used to examine trends for the period 1997 to 2018. Per capita attribution of volume sales and sugar contribution was estimated by dividing by the Australian resident population for the relevant year. Per capita volume sales of SSBs fell 27%, from 83L/person to 61L/person, largely driven by declining sales of sugar-sweetened carbonated soft drinks (76 to 45L/person). Volume sales of non-SSB increased, from 48 to 88L/person, the largest contributor being pure unflavoured still waters (6 to 48L/person). Volume sales of non-SSBs have exceeded those of SSBs since 2015. The yearly contribution of SSBs to the sugar content of the national diet declined from 9.0 to 6.4kg/person. Major, long-term shifts are occurring in the market for non-alcoholic, water-based beverages in Australia, notably a fall in per capita volume sales of SSBs and an increase in volume sales of water. Both trends are consistent with obesity prevention strategies.
Keywords: Keywords: sugar-sweetened beverages; added sugar; sales; soft drinks; trends.
Conflict of interest statement
This analysis was funded by an unrestricted grant from The Australian Beverages Council Ltd. The funders had no role in the design of the study; in the collection, analyses, or interpretation of data; in the writing of the manuscript, or in the decision to publish the results.
Figures


References
-
- National Health and Medical Research Council . Australian Dietary Guidelines. National Health and Medical Research Council; Canberra, Australian: 2013.
-
- Trumbo P., Schlicker S., Yates A.A., Poos M., Food and Nutrition Board of the Institute of Medicine. The National Academies Dietary reference intakes for energy, carbohydrate, fiber, fat, fatty acids, cholesterol, protein and amino acids. J. Am. Diet. Assoc. 2002;102:1621–1630. doi: 10.1016/S0002-8223(02)90346-9. - DOI - PubMed
-
- ESFA Panel of Dietetic Products Nutrition and Allergies Scientific Opinion on Dietary Reference Values for carbohydrates and dietary fibre. EFSA J. 2010;8:1462. doi: 10.2903/j.efsa.2010.1462. - DOI
-
- Imamura F., O’Connor L., Ye Z., Mursu J., Hayashino Y., Bhupathiraju S.N., Forouhi N.G. Consumption of sugar sweetened beverages, artificially sweetened beverages, and fruit juice and incidence of type 2 diabetes: systematic review, meta-analysis, and estimation of population attributable fraction. BMJ. 2015;351:3576. doi: 10.1136/bmj.h3576. - DOI - PMC - PubMed
MeSH terms
Substances
Grants and funding
LinkOut - more resources
Full Text Sources
